Full Terms & Conditions of access and use can be found at
https://www.tandfonline.com/action/journalInformation?journalCode=mree20
ISSN: 1540-496X (Print) 1558-0938 (Online) Journal homepage: https://www.tandfonline.com/loi/mree20
Is Fiscal Policy Sustainable in Turkey?
Meltem Ucal & Asli Alici
To cite this article: Meltem Ucal & Asli Alici (2010) Is Fiscal Policy Sustainable in Turkey?,
Emerging Markets Finance and Trade, 46:sup1, 83-93, DOI: 10.2753/REE1540-496X4603S106 To link to this article: https://doi.org/10.2753/REE1540-496X4603S106
Published online: 07 Dec 2014.
Submit your article to this journal
Article views: 59
View related articles
Emerging Markets Finance & Trade / May–June 2010, Vol. 46, Supplement 1, pp. 83–93. Copyright © 2010 M.E. Sharpe, Inc. All rights reserved.
1540-496X/2010 $9.50 + 0.00. DOI 10.2753/REE1540-496X4603S106
Is Fiscal Policy Sustainable in Turkey?
Meltem Ucal and Asli Alici
AbSTrAcT: The issue of the budget deficit has become one of the main themes of the economic policy implemented in Turkey and backed by the International Monetary Fund (IMF) following the economic crisis of 2001. The main motivation for this study is the question of whether or not the government’s financial policy is sustainable and satisfies the government’s long-term budget constraint. The empirical analysis is based on tests of whether government expenditure and revenue are cointegrated, considering the economic liberalization period of 1989–2008. The stability of fiscal policy is examined using the Johansen multivariate cointegration method. The findings of the sustainability tests indi-cate that fiscal policy from the liberalization of the economy up until the 2001 economic crisis was not sustainable.
KEy WOrDS: budget deficit, cointegration, financial policy.
Long-term sustainability has moved to center stage in the analysis of fiscal policy as the emphasis has moved away from short-term concerns with smoothing business cycle variations after the breakdown of stabilization policies in the West following the 1973 oil crisis. This reorientation has been part of a process of rethinking the role of government, with less emphasis on active involvement and a stronger focus on providing a stable environment for the operation of the private sector. The state’s main objective under this model is to act as a financially sound macroeconomic agent in an effort to keep the budget deficit and public debt at manageable levels.
The sustainability of fiscal policies has drawn more attention among policymakers, academicians, and international organizations. The sustainability of governments’ fiscal policies and the effects of budget deficits have been investigated in a series of articles. The majority of such articles have employed time-series methods to examine whether governments effectively respect intertemporal budget constraints in present value terms. Early empirical investigations in this area have been confined to data from the United States. In their innovative article, Hamilton and Flavin (1986) proposed an empirical framework for testing the “limits” of public borrowing, using postwar U.S. data. They concluded that sustainability requires stationarity of the government debt. Trehan and Walsh (1988) applied the stationarity test under the assumption of a constant real in-terest rate and demonstrated that it is equivalent to the test for cointegration between government expenditures inclusive of interest payments and revenues. Wilcox (1989) extended Hamilton and Flavin’s views by allowing for a nonconstant real interest rate in the study. Hakkio and Rush (1991) tested the cointegrating vector under the assumption
Meltem Ucal (corresponding author: [email protected]) is a lecturer at Kadir Has University, Turkey, Department of Economics, Faculty of Economics and Administrative Sciences. Asli Alici ([email protected]) is an associate professor at Yeditepe University, Department of International Finance, Faculty of Commerce, Turkey. The authors thank Kévélcém Metin Özcan, Bilkent University, and Sinem ªenol, Kadir Has University, for support during the writing of this paper.
that the real interest rate is stationary. Quintos (1995) expanded on Hakkio and Rush (1991) and introduced “strong” and “weak” conditions for fiscal sustainability.
Perron (1989) suggested that if structural shifts do not take into account analyses of the sustainability of budget deficits, the fiscal variables may yield incorrect results. His findings have led many researchers to regulate their empirical analyses to include structural shifts in the fiscal deficit variables (e.g., Cunado et al. 2004; Goyal et al. 2004; Tanner and Liu 1994; Wu 1998). The topic of fiscal deficits has also been at the forefront of many academic discussions on macroeconomic policy in Turkey since financial liberalization in 1989. The sustainability of the Turkish budget deficit has been investigated in recent years, for example, by Agénor et al. (2006), Akçay et al. (2001), Budina and Wijnbergen (2009). Günaydén (2003), Kalyoncu (2005), Kia (2008), Özatay (1997), Özmen and Ko¢¢gar (1998), Sakal (2002), Voyvoda and Yeldan (2005). Özatay (1997) studied a macroeconomic model for Turkey for the period 1977–1995 and found that fiscal policy was not sustainable even if the long-term money demand function was stationary. Özmen and Ko¢gar (1998) examined structural shifts for sus-tainability during the 1969–1998 period. They showed a structural break in 1983 and weakly sustainable government deficits. Günaydén (2003) arrived at the same results for 1987–2003 using Engle-Granger cointegration techniques. Akçay et al. (2001) re-vealed that fiscal deficits are unsustainable for 1970–2000 due to the fact that the gross national product (GNP) ratio is nonstationary. Kalyoncu (2005) applied a cointegration test based on the 1991 approach of Hakkio and Rush, and the results based on annual observations supported the existence of long-run equilibrium between real revenue and expenditure, suggesting the fiscal stance satisfied the weak sustainability condition for the period 1970–2001. Following this, Agénor et al. (2006) analyzed the effects of monetary and fiscal adjustment on public debt sustainability and the behavior of wages and unemployment in Turkey. They used various simulation scenarios, and their results indicate the importance of a broad range of fiscal measures for putting domestic public debt on a sustainable path. These results are consistent with those of several other studies of the Turkish economy. For example, Voyvoda and Yeldan (2005), using an overlapping generation model, demonstrated that the path of public debt per gross domestic product (GDP) shows a significant degree of inertia. Kia (2008) examined the fiscal sustainability of two emerging countries: Iran and Turkey. Cointegration and multicointegration methodologies were used to estimate fiscal budgeting processes in these countries. For both countries, he found that the fiscal budgeting process is not sustainable. Budina and Wijnbergen (2009) studied fiscal sustainability in Turkey after the crisis in 2001 and also reviewed and extended the quantitative approaches to fiscal sustainability analysis.
In this study, we conduct a formal test of whether, after financial liberalization, Turkey’s fiscal policy stance is sustainable, by examining whether or not Turkey has violated its intertemporal budget constraint. Our approach consists of an analysis of the time series properties of the fiscal policies of Turkish central governments dating back to 1989 to determine whether Ponzi financing arrangements have been employed. The stability of fiscal policy is examined using an econometric approach to the present value budget constraint (PVBC) method. Our data run from 1989:1 to 2008:12. In practice, it may be necessary to change fiscal policy to achieve sustainability. This suggests that the fiscal policy stance was changed and that the new regime may or may not be consistent with intertemporal budget balance. From this perspective, we tested for cointegration over the whole sample and over the two subsamples, which run from 1989:1 to 2000:12
and 2001:1 to 2008:12 because of International Monetary Fund (IMF) and World Bank programs after the 2001 crisis.
An Overview of the Turkish Economy
The beginning of the 1980s constituted a turning point in Turkey’s economy. At the time, the government decided to shift the economy from an inward-oriented and protec-tive system to an outward-oriented and liberalized environment. In 1980, the Turkish government initiated a series of reforms to accomplish a major policy shift from import substitution to an export-led growth strategy, mainly by liberalizing foreign trade. The lifting of repressive controls on financial markets, referred to as financial liberalization, was realized gradually over the 1980s as part of this policy change. Turkey liberalized its capital accounts in 1989, taking an important step toward integrating its economy with the global economic system (see Alici and Ucal 2003).
Average GNP growth rate was 5.5 percent during the period from 1984 through 1993. The highest GNP growth rate occurred in 1987 (+9.8 percent), and the lowest occurred in 2001 (–9.5 percent). Budget deficits1 as a percentage of GNP reached 3.5 percent in 1987 and were stable at 3 percent until 1990, when sharp increases were noted. After 1990, compared with previous periods, the growth rate of the economy slowed significantly, continuity in growth disappeared, fluctuations increased in number, and their dimension expanded. The Turkish economy experienced a severe financial crisis in early 1994, due to unsustainable budget deficits and several other reasons. The budget deficit/GNP ratio was 6.7 percent in 1993, which caused the 1994 crisis. From 1993 to 1994, real GNP contracted by 6.1 percent, and the Turkish lira depreciated by more than 150 percent against the U.S. dollar. In mid-1994, Turkey adopted an IMF-based standby agreement and managed to subdue the severe economic crisis. Although increases in the budget deficit slowed down in the following years, the deficit continued to rise in the late 1990s and macroeconomic instability continued until the late 1990s. During this period, public sector balances were unsustainable due to a reliance on do-mestic borrowing. In December 1999, Turkey signed a three-year IMF-based standby agreement, which mainly aimed to solve public sector imbalances. However, the budget deficit followed its upward trend, reaching its highest level to date at 16.9 percent in 2001. The IMF program failed in early 2001 due to the most severe financial crisis in the history of the Turkish Republic, and Turkey then signed another program backed by the IMF and the World Bank. The annual average real gross domestic product (GDP) growth rate, which was 0.8 percent during the period 1998 to 2002, reached 7 percent in the period 2002 to 2007 after the IMF and the World Bank agreement.
Turkey consequently entered the new millennium with an exchange-rate-based stabilization program, which was supported by IMF standby credits. The program was also accompanied by limited budgetary and monetary policies that enabled the central bank to increase domestic liquidity only with capital inflows (which gave the program a currency board character). During the period 2002 to 2007, the Turkish economy performed strongly, recovering from the disastrous 2001 economic crisis. Owing to effective fiscal policies implemented between 2002 and 2007, many positive develop-ments have been achieved and are reflected in the budget values. As a result of fiscal discipline and the expanding sphere of the registered economy, the budget deficit, which was 11.5 percent of GDP in 2002, dropped to 1.6 percent at the end of 2007.2
Theoretical Model
Governments in a given period are known to put in place budget constraints. In this respect, the government budget constraint is as follows:
GGt + (1 + i)tBt–1 = Rt + B t (1)
where GGt is government expenditures excluding interest payment, Rtis the
govern-ment’s revenues, itis the annual interest rate, and Btis the government’s debt at time t.
The forward equations are: 0 1 ( ) lim t t t n n n t B ∞ R GG B →∞ = =
∑
� − + � where 1 and 1 / (1 ) t t s s s s i = =Π
= + � � � (2) lim n n 0 n→∞� B =is generally called a no-Ponzi-scheme condition, meaning that if the government issues new debt to finance its deficits, the government debt B0 must be equal to the present value of primary budget surpluses
1 ( ) t t t t R GG ∞ = −
∑
� .To ensure sustainability of the intertemporal budget deficit, the expected value of limit term
lim n n 0 n E B →∞ = �
in Equation (2) must be zero. Under the assumption that the variables are stationary, Equation (1) has been converted by Hakkio and Rush (1991) into the following regression equation:
Rt = α + βGEt + εt (3)
where GEt is government expenditures plus the interest payments on the debt (obtained
from GEt = GGt + itBt–1,), Rt is government revenues, and εt is a stationary random
variable.
Econometric Methodology
In this study, fiscal sustainability in Turkey is examined by testing the existence of cointegration between government expenditures and revenues using Hakkio and Rush’s Equation (3).
The econometric methodology consists of two steps: In the first step, the stationarity properties of the time series are studied by using unit root tests, and in the second step, given that the series are nonstationary, tests of cointegration are applied to the series to determine fiscal sustainability.
An essential condition for the Johansen procedure testing for a long-run relationship between government revenue and expenditure is that the variables entering the cointe-grating equation should be integrated of the same order. As a preliminary step, we tested for the stationary status of two variables to determine their order of integration and to ensure that the variables are integrated of the same order, thus avoiding spurious results. Therefore, augmented Dickey–Fuller (ADF), Phillips–Perron (PP), and Elliot, Rothen-burg, and Stock tests (ERS) were used to ensure that all series are I(1). In the tests, the lag length and bandwidth were selected with the Akaike information criterion (AIC) and the Newey-West Bartlett kernel, respectively.
After setting up the stationarity of the data, we then employed Johansen multivariate cointegration tests to investigate any possible long-run relationship between the variables in terms of fiscal sustainability.
In conducting the Johansen test, consider a vector autoregressive model (VAR) of the form: B(L)Wt = ξt, where W = [Rt, GEt]′. By applying the Beveridge-Nelson
decomposi-tion B(L) = B(1) + (1 – L)B * (L) to the lag polynomial operadecomposi-tion on Wt+1, the equation can be rewritten as:
1 1
(1)
m t t t j t jB
−B
− =∆Ω = −
Ω +
∑
∆Ω + ξ
(4)where B(1) is a matrix of long-run multipliers and B is the short-run dynamic coefficients. The rank, r, of B(1) determines the number of cointegrating vectors that exist. If B(1) is less than full rank, Wt is cointegrated and B(1) can be expressed as (1)B = α� , where α is the
matrix of cointegrating vectors and the coefficients in� represent the speed of adjustment of the system to disequilibrium. The B(1) matrix is estimated as an unrestricted VAR and tested as to whether the restriction implied by the reduced rank of B(1) can be rejected. The null hypothesis is H1(r) against H1(k), and the test statistics used in this decision are the trace statistic given by
Ζt i i T k T =− − = −
∑
log(1 1 λ )for r = 0,1,...k – 1 and λi = the ith largest eigenvalue, and the maximum eigenvalue
statistic given by 1 1 1 log(1 ) -k T t T T i T Z T − + = − = −
∑
− λ = Ζ Ζ (5)The null hypothesis that there is cointegration between the two I(1) variables is tested assuming β = 1 and εt is stationary by carrying out the Johansen cointegration
test using Equation (3). If there is no cointegration, the PVBC does not hold and the fiscal deficit is not sustainable. However, the β = 1 condition is not, strictly speaking, a necessary condition for the government’s budget constraint to hold. Hakkio and Rush (1991) showed that when GEtand Rtare in levels, the condition 0 < β < 1 is a sufficient
condition for the budget constraint to be sustained. Quintos (1995) also demonstrated that a cointegrating vector (1, –1) between Rtand GEtis a sufficient condition only for
“weak” condition can be referred to as a case when the budget constraint holds and Rt
and GEtare cointegrated with cointegrating vector (1, β), 0 < β < 1. On the other hand,
if β = 0, the deficit is unsustainable. Consequently, it is expected that these variables will be nonstationary and cointegrated. It is also likely for both cointegration and the values of the parameters to change in the different sample periods that are used in this study.
Empirical Results: Unit Root and Cointegration
This section presents the data and results of the PVBC fiscal sustainability analysis for Turkey using cointegration testing.
The data used in this study were collected monthly on government revenues, inter-est rates, government debt, and expenditures/spending. They were obtained from the Republic of Turkey Prime Ministry Undersecretariat of Treasury data bank. It spans the period 1989:1 to 2008:12 and also the two subperiods of 1989:1 to 2000:12 and 2001:1 to 2008:12. The analysis suggests a possible shift in fiscal policy behaviors.3 All vari-ables are measured in millions of Turkish lira (TL), and the logarithms of real varivari-ables are used. Rt denotes government revenues, It denotes interest rate (long-term weighted
government security bond), Bt denotes the stock of debt, GGt denotesgovernment
expen-ditures,GEt denotes government expenditures plus the interest payments on government
debt (government spending).
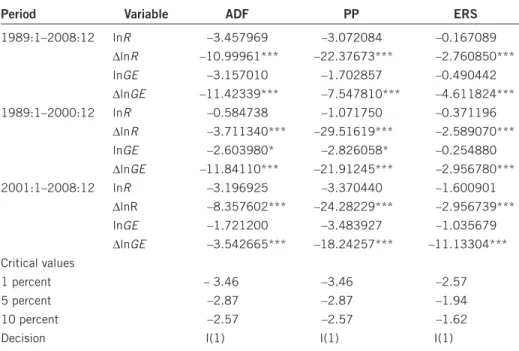
To begin the analysis, unit root tests are first carried out in levels and first differences so as to identify the univariate specifications of the series used in this study. The results are presented in Table 1 for the whole period, 1989:1 to 2008:12 and for the two subperiods,
Table 1. Unit root testing
Period Variable ADF PP ERS
1989:1–2008:12 lnr –3.457969 –3.072084 –0.167089 Dlnr –10.99961*** –22.37673*** –2.760850*** lnGE –3.157010 –1.702857 –0.490442 DlnGE –11.42339*** –7.547810*** –4.611824*** 1989:1–2000:12 lnr –0.584738 –1.071750 –0.371196 Dlnr –3.711340*** –29.51619*** –2.589070*** lnGE –2.603980* –2.826058* –0.254880 DlnGE –11.84110*** –21.91245*** –2.956780*** 2001:1–2008:12 lnr –3.196925 –3.370440 –1.600901 DlnR –8.357602*** –24.28229*** –2.956739*** lnGE –1.721200 –3.483927 –1.035679 DlnGE –3.542665*** –18.24257*** –11.13304*** Critical values 1 percent – 3.46 –3.46 –2.57 5 percent –2.87 –2.87 –1.94 10 percent –2.57 –2.57 –1.62
Decision I(1) I(1) I(1)
1989:1 to 2000:12 and 2001:1 to 2008:12. Our findings suggest that all the series are I(1) for the whole period and for the two subperiods.
We first determined the appropriate order of lags (p) of the VAR model using the Schwarz Bayesian Criterion (SBC), AIC, final prediction error (FPE), and Hannan-Quinn information criterion (HQ) before the Johansen cointegration tests. Lag in the VAR model is six for all the time periods. Accordingly, the estimated form of the vector error correc-tion (VEC) is of lag length p′ = (p – 1) = 5.
Table 2 demonstrates that for the whole sample and the two subperiods used in this study there are two cointegrating vectors, that is, the rank, r, of B(1) = 1.
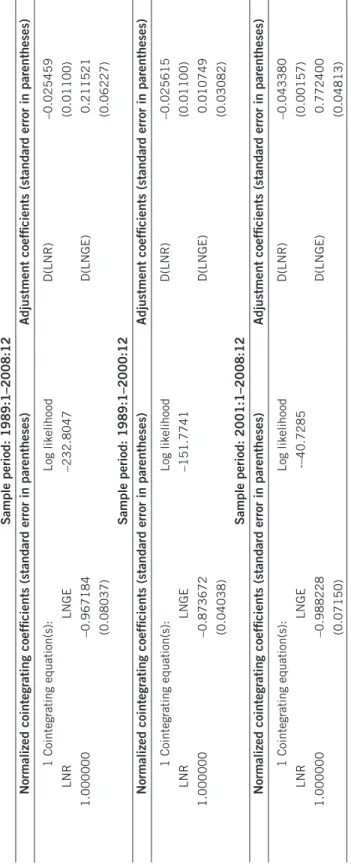
Cointegrating and adjustment coefficients of interest for the whole period and the two subperiods from the unrestricted VEC estimation are presented in Table 3.
The estimated unrestricted VEC was stable and constructed white noise errors. Cointe-grating coefficients were of the expected signs and statistically significant. The results also show cointegration relations between the two time series in all the sample periods. Diagnostic tests showed that the cointegration model passed through all the tests in this stage. The results indicate no evidence of serial correlation, no normality of residuals, and heteroskedasticity.
Table 4 summarizes our findings in a rearranged version. The results indicate that the variables under examination are cointegrated and that the estimated coefficient for expenditures is statistically significant. However, fiscal policy has “weak” sustainability for 1989:1 to 2008:12 and 1989:1 to 2000:12. Conversely, the second subperiod (2001:1 to 2008:12) is relatively close to one and fiscal policy has “strong” sustainability because of the IMF and World Bank programs after the 2001 crisis.
The continuity of Turkey’s “strong” fiscal sustainability in the long run is extremely important. In this context, the IMF set the stabilization of the debt to GDP ratio by 2011 as a target for Turkey. In the report “The State of Public Finances: A Cross-Country Fiscal Monitor” (Horton et al. 2009), experts state that Turkey will need to take “nonrenewal of stimulus, improved expenditure control, local government reform, introduction of fiscal rule and continuation of tax administration reforms” measures.
Conclusion
Turkey has a long history of high and volatile inflation and large budget deficits. The past decade has started off as a repeat of that history, but Turkey has succeeded in lowering inflation dramatically, while making headway in improving the public debt composition since the major economic crisis in 2001.
This study has employed cointegration analysis to examine whether fiscal policy is sustainable in Turkey based on the government’s intertemporal budget constraint. Our findings suggest that the fiscal policy since liberalization of the economy has “weak” sustainability for the whole period through the end of 2008 and also for the subperiod up to the 2001 economic crisis. On the other hand, the sustainability of fiscal policy in the subperiod 2001.1 to 2008.12 has been “strong,” suggesting that the government has adhered to its budget constraints since the implementation of the IMF and World Bank program. The fact that we found strong sustainability for the second subperiod suggests that the policy changes and the government’s effort to strengthen the underlying financial structures in the economy following the 2001 economic crisis represent moves in the right direction.
Table 2. Johansen test for number of cointegrating vectors Sample period Null Alternative Trace statistic b 0.05 Critical values Prob a Null Alternative Max. eigenvalue b 0.05 Critical values Prob a 1989:1–2008:12 r = 0 r ≥ 1 71.57551 20.26184 0.000** r = 0 r = 1 50.37411 15.89210 0.000** r ≤ 1 r ≥ 2 21.20141 9.16454 0.000 r ≤ 1 r = 2 21.20141 9.16454 0.000 1989:1–2000:12 r = 0 r ≥ 1 44.99949 20.26184 0.000** r = 0 r = 1 34.62445 15.89210 0.000** r ≤ 1 r ≥ 2 10.37504 9.164546 0.0293 r ≤ 1 r = 2 10.37504 9.164546 0.0293 2001:1–2008:12 r = 0 r ≥ 1 13.56225 12.32090 0.0308* r = 0 r = 1 18.12248 11.22480 0.0207* r ≤ 1 r ≥ 2 5.43976 4.129906 0.0234 r ≤ 1 r = 2 5.439764 4.129906 0.0234 Notes:
* and ** reject the null h
ypothesis (no cointe
gration) at 5 percent and 1 percent, respecti
vely
.
a p-v
alues,
r refers to the number of cointe
grating v
ectors (J.G. MacKinnon,
A. Haug, and L. Michelis, “Numerical Distrib
ution Functions of Lik
elihood Ratio Tests for Cointe gration, ” Journal of Applied Econometrics 14, no. 5 (September–October 1999): 563–577. bT
race and max-eigen
value test indicates 2 cointe
grating eqn(s) at the 0.05 le
Table 3. Unrestricted VEC estimation
Sample period: 1989:1–2008:12
Normalized cointegrating coefficients (standard error in parentheses)
Adjustment coefficients (standard error in parentheses)
1 Cointegrating equation(s): Log likelihood D(LNR) –0.025459 LNR LNGE –232.8047 (0.01100) 1.000000 –0.967184 D(LNGE) 0.211521 (0.08037) (0.06227) Sample period: 1989:1–2000:12
Normalized cointegrating coefficients (standard error in parentheses)
Adjustment coefficients (standard error in parentheses)
1 Cointegrating equation(s): Log likelihood D(LNR) –0.025615 LNR LNGE –151.7741 (0.01100) 1.000000 –0.873672 D(LNGE) 0.010749 (0.04038) (0.03082) Sample period: 2001:1–2008:12
Normalized cointegrating coefficients (standard error in parentheses)
Adjustment coefficients (standard error in parentheses)
1 Cointegrating equation(s): Log likelihood D(LNR) –0.043380 LNR LNGE -–40.7285 (0.00157) 1.000000 –0.988228 D(LNGE) 0.772400 (0.07150) (0.04813)
Notes
1. Metin (1998) has analyzed the relationship between inflation and the budget deficit in Turkey before 1987. Her findings suggest that budget deficits (as well as real income growth and debt monetization) significantly affect inflation in Turkey.
2. Recent budget deficit history in Turkey is as follows: –11.9 percent (2001); –11.5 percent (2002); –8.4 percent (2003); –5.2 percent (2004); –1.1 percent (2005); –0.8 percent (2006); and –1.6 percent (2007) (Investment Support and Promotion Agency 2008).
3. See Binay (2003), Burnside (2005), and Pamukcu and Yeldan (2005) for changes in fiscal policy. In 2001, backed by the IMF and World Bank, a new stabilization program relying on float-ing exchange rates was adopted. This program was based on strict monetary policy aimed at price and fiscal stability. In this context, some structural reforms such as privatization, elimination of subsidies, and reductions in both wage payments and public employment were applied to reduce the necessity of public sector borrowing and increase Turkey’s credibility.
References
Agénor, P.R.; J.T. Henning; M. Verghis; and E. Yeldan. 2006. “Disinflation, Fiscal Sustainability, and Labor Market Adjustment in Turkey.” World Bank Policy Research Working Paper, no. 3804.
Akçay, O.C.; C.E. Alper; and S. Özmucur. 2001. “Budget Deficit, Inflation and Debt Sustain-ability: Evidence from Turkey (1970–2000).” Working Paper no. ISS/EC 2001–12. Depart-ment of Economics, Bogazici University, Istanbul.
Alici, A., and M. Ucal. 2003. “Foreign Direct Investment, Exports and Output Growth of Turkey: Causality Analysis.” Paper presented at the fifth annual conference of the European Trade Study Group (ETSG) Universidad Carlos III de Madrid. Available at www.etsg.org/ ETSG2003/papers/alici.pdf, accessed April 10, 2010.
Binay, ª. 2003. “Some Issues in Fiscal Policy and Central Banking: The Case of Turkey.” BIS paper, no. 20 (October): 245–259.
Budina, N., and S. Wijnbergen. 2009. “Quantitative Approaches to Fiscal Sustainability Analy-sis: A Case Study of Turkey Since the Crisis of 2001.” World Bank Economic Review 23, no. 1: 119–140.
Burnside, C. 2005. Fiscal Sustainability in Theory and practice: A Handbook. Washington, DC: World Bank.
Cunado, J.; L.A. Gil-Alana; and F. Perez de Garcia. 2004. “Is the U.S. Fiscal Deficit Sustain-able? A Fractionally Integrated Approach.” Journal of Economics and Business 56, no. 6 (November–December): 501–526.
Goyal, R.; J.K. Khundrakpam; and P. Ray. 2004. “Is India’s Public Finance Unsustainable? Or, Are the Claims Exaggerated?” Journal of policy Modeling 26, no. 3 (April): 401–420. Table 4. Cointegration tests for fiscal sustainability
Periods Cointegration
Cointegration coefficient b
Johansen Results of b test Sustainability
1989:1–2008:12 Yes** –0.967184 0 < β < 1 Weak (0.08058) 1989:1–2000:12 Yes** –0.873672 0 < β < 1 Weak (0.04038) 2001:1–2008:12 Yes** –0.988228 β = 1 Strong (0.07150)
Günaydén, E. 2003. “Analyzing the Sustainability of Fiscal Deficit in Turkey.” Hazine Dergisi 16. Undersecreteriat of the Treasury, Ankara.
Hakkio, C.S., and M. Rush. 1991. “Is the Budget Deficit ‘Too Large’?” Economic Inquiry 29, no. 3: 429–445.
Hamilton, J. D., and M.A. Flavin. 1986. “On the Limitations of Government Borrowing: A Framework for Empirical Testing.” American Economic Review 76, no. 4 (September): 808–819.
Horton, M.; M. Kumar; and P. Mauro. 2009. “The State of Public Finances: A Cross-Country Fiscal Monitor.” IMF Staff Position Note, Fiscal Affairs Department. Available at www.imf .org/external/np/pp/eng/2009/030609.pdf, accessed April 2010.
Investment Support and Promotion Agency of the Prime Minister of the Republic of Turkey. 2008. Investor Guide for Turkey. Available at www.invest.gov.tr, accessed April 2010. Johansen, S. 1991. “Estimation and Hypothesis Testing of Cointegration Vectors in Gaussian
Vector Autoregressive Models.” Econometrica 59, no. 6 (November): 1551–1580.
Kalyoncu, H. 2005. “Fiscal Policy Sustainability: Test of Intertemporal Borrowing Constraints.” Applied Economics Letters 12, no. 15 (December): 957–962.
Kia, A. 2008. “Fiscal Sustainability in Emerging Countries: Evidence from Iran and Turkey.” Journal of policy Modeling 30, no. 3: 957–972.
Metin, K. 1998. “The Relationship Between Inflation and the Budget Deficit in Turkey.” Journal of Business & Economic Statistics 16, no. 4 (October): 412–422.
Özatay, F. 1997. “Sustainability of Fiscal Deficits, Monetary Policy and Inflation Stabilization: The Case of Turkey.” Journal of policy Modeling 19, no. 6 (December): 661–681.
Özmen, E., and Ç.µI. Ko¢gar. 1998. “Sustainability of Budget Deficits in Turkey with a Structural Shift.” ODTÜ Geliºme Dergisi 25, no. 1: 107–127.
Pamukcu, T., and E. Yeldan. 2005. “Country Profile: Turkey Public Sector and Fiscal Policy Issues.” Economic Research Forum report. Available at www.bilkent.edu.tr/~yeldane/FEM-ISE_Fisca12005.pdf.
Perron, P. 1989. “The Great Crash, the Oil Price Shock, and the Unit Root Hypothesis.” Econo-metrica 57, no. 6 (November): 1361–1401.
Quintos, C. 1995. “Sustainability of the Deficit Process with Structural Shifts.” Journal of Busi-ness & Economic Statistics 13, no. 4 (October): 409–417.
Sakal, M. 2002. “Türkiye’de Kamu Açéklaré ve Borçlanmanén Sürdürülebilirli¢¢g¬i Sorunu: 1988–2000 Dönem Analizi.” Dokuz Eylül University, Journal of Faculty of Economic and Administrative Sciences 17, no. 1: 35–60.
Tanner, E., and P. Liu. 1994. “Is the Budget Deficit Too Large? Some Further Evidence.” Eco-nomic Inquiry 32, no. 3 (July): 511–518.
Trehan, B., and C. E. Walsh. 1988. “Common Trends, Intertemporal Budget Balance, and Revenue Smoothing.” Journal of Economic Dynamics and Control 12 (June–September): 425–444.
Voyvoda, E., and E. Yeldan. 2005. “Managing Turkish Debt: An OLG Investigation of the IMF’s Fiscal Programming Model for Turkey.” Journal of policy Modeling 27, no. 6 (September): 743–765.
Wilcox, D.W. 1989. “The Sustainability of Government Deficits: Implications of the Present Value Borrowing Constraint.” Journal of Money, Credit, and Banking 21, no. 3 (August): 291–306.
Wu, J. 1998. “Are Budget Deficits ‘Too Large’? The Evidence from Taiwan.” Journal of Asian Economics 9, no. 3: 519–528.