676 IEEE TRANSACTIONS ON APPLIED SUPERCONDUCTIVITY, VOL. 17, NO. 2, JUNE 2007
Effect of rf Pumping Frequency and rf Input Power on
the Flux to Voltage Transfer Function of rf-SQUIDs
R. Akram, T. Eker, A. Bozbey, M. Fardmanesh, J. Schubert, and M. Banzet
Abstract—We present the results on the correlation between the
flux to voltage transfer function,Vspp, of the rf-SQUID and the rf-bias frequency as well as rf-bias power. Measurements were per-formed for different SQUID gradiometer samples chosen from the same batch or different batches. In order to have full control on the electronics parameters, an experimental rf-SQUID circuit was de-signed and implemented with an operation frequency of 600 MHz to 900 MHz.
According to our findings, it has been observed that at any par-ticular rf-bias power,Vsppvs. rf-bias frequency shows Sinc-like behavior. We observed that the main lobe maxima exist close to the resonance frequency of the LC tank circuit and by changing only the power, amplitude of the main lobe and side lobes can be controlled. TheVsppvs. rf-bias power analysis shows that max-imum ofVspp, strongly depends on the bias frequency. This can be correlated with the S11 parameter of LC tank circuit.
We also observed that the devices from the same batch show main lobe maxima at different frequencies and/or power. Our SQUIDs with high working frequency gave their maxima at lower rf-bias powers leading to the need of having high frequency electronics with low bias power handling capabilities. It has also been observed that the SQUIDs from the same chip show similar characteristics regarding Vspp vs. frequency and power while the SQUIDs from different batches show completely different behavior for a fixed LC tank circuit configuration.
Index Terms—Flux to voltage transfer function, gradiometer,
rf-SQUID, rf-SQUID electronics.
I. INTRODUCTION
I
N CHARACTERIZATION of rf-SQUIDs, the effect of the used electronics (rf-pumping frequency and applied power) and tank circuit on the flux to voltage transfer function, , is a well-known fact [1], but their exact correlation has not been reported in detail to the best of our knowledge. In this work, theManuscript received August 28, 2006.
R. Akram was with Electrical and Electronics Engineering Department, Bilkent University, 06800 Bilkent, Ankara, Turkey. He is now with the Depart-ment of Physics, Bilkent University, 06800 Bilkent, Ankara, Turkey.
T. Eker was with Electrical and Electronics Engineering Department, Bilkent University, 06800 Bilkent, Ankara, Turkey. He is now with Aselsan AS, Ankara, Turkey.
A. Bozbey is with the Electrical and Electronics Engineering Department, Bilkent University, 06800 Bilkent, Ankara, Turkey.
M. Fardmanesh is with the Electrical and Electronics Engineering Depart-ment, Bilkent University, 06800 Bilkent, Ankara, Turkey. He is also with the Electrical Engineering Department, Sharif University of Technology, Tehran, Iran.
J. Schubert and M. Banzet are with the ISG1-IT and Center of Nanoelec-tronic Systems for Information Technology, Forschungszentrum Juelich GmbH, D-52425 Juelich, Germany.
Digital Object Identifier 10.1109/TASC.2007.899840
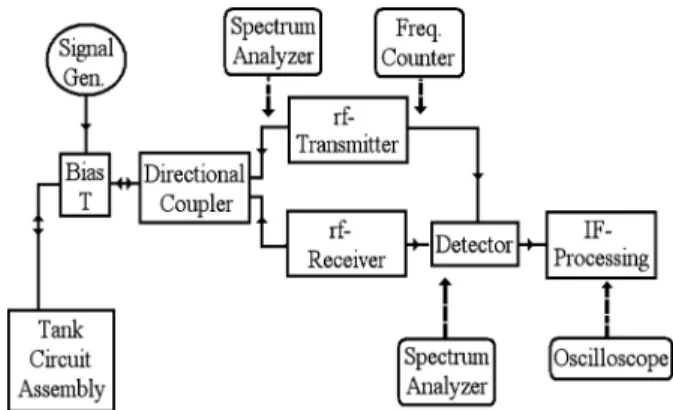
Fig. 1. A schematic diagram of the implemented 600 MHz to 900 MHz rf-elec-tronics system. In this system design, input and output of each component can be accessed independently.
effect of these parameters on the flux to voltage transfer func-tion, and the output power spectrum of the rf-electronics has been observed and reported. In order to achieve the control on the parameters of an rf-electronics, an rf-SQUID electronics with working frequency range of 600 MHz to 900 MHz has been realized and implemented. Fig. 1 shows a schematic diagram of the rf-electronics whereas the details of the electronics will be presented elsewhere.
II. SAMPLEPREPARATION
The rf-SQUID gradiometers used were made from 200 nm thick (YBCO) film deposited on (100) substrate [2] using Step Edge Junctions [3] technology. The YBCO films were deposited by the pulsed laser deposition tech-niques using KrF excimer laser and were patterned using dif-ferent low energy argon Ion beam etching processes. The gra-diometers were made using layouts with washer areas with 1.5 mm diameter, loop areas of and a base line of 1.5 mm. Two different batches of SQUIDs made on two
substrates have been investigated [4].
III. MEASUREMENTS ANDANALYSIS
Using the implemented system, different SQUID samples have been used to investigate the relationship between SQUID signal level, applied rf-frequency and in put rf-power.
A. vs. rf-Parameters
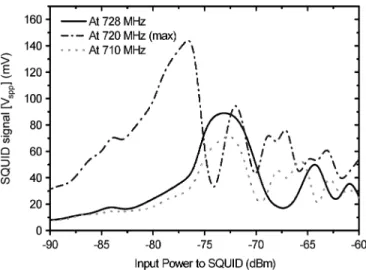
Effect of rf-frequency on the SQUID signal level, , re-sembles the Sinc like behavior at a particular fix power as shown in Fig. 2. The main lobe shifts slightly versus frequency as input
AKRAM et al.: EFFECT OF rf PUMPING FREQUENCY AND INPUT POWER ON FLUX TO VOLTAGE TRANSFER 677
Fig. 2. Effect of the rf-frequency on theV while input power is kept con-stant at three different values. The data is taken from SQUID 1. Inset shows the absolute value of Sinc function withf = 270 MHz.
Fig. 3. Effect of the input power on theV while the rf-frequency is kept constant at three different values. The data is taken from SQUID 1.
power is either increased or decreased. This can be explained by the change in the SQUID effective inductance, changing the tank circuit effective inductance and the tank circuit Q.
The behavior of versus the input power at fixed pumping rf-frequencies is also shown in Fig. 3. As shown in the figure, for a certain applied power (here 77 dBm), show max-imum at resonance frequency of the tank circuit. Fig. 3 shows that by decreasing the power, we get maximum where the peak value is consistent with effective resonance frequency of the tank circuit as shown in Fig. 4.
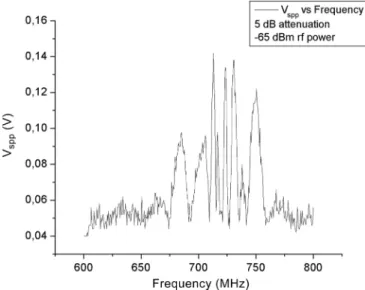
By using the flexibility of the system, effect of rf-frequency on the power at the rf-input of the mixer has been characterized. As shown in Fig. 5, there are absorption dips not only at the res-onance frequency of the tank circuit, but also at several frequen-cies in a periodic like repetition. This Sinc-like type of modu-lation might be due to two factors. One is due to the fact that the modulation of the amplitude of the signal decreases as the
Fig. 4. The effect of the rf-frequency and pump power onV for SQUID 2 The 3D graph is obtained by combining theV vs. rf-frequency (Fig. 1) and V vs. rf-power data (Fig. 2).
Fig. 5. The effect of the rf-frequency on the power at the rf-input of the mixer. The data is taken from SQUID 1.
rf-power increases as can be observed from the typical vs. curves of rf-SQUIDs under ‘ ’ and ‘ ’. Another is the resonance effect and variation of S11 (instead of Q factor) which is due to the interference effect of the connector’s param-eters with that of the tank circuit and the SQUIDs, the detailed analysis of which is under further investigation [4], [5]. The re-lationship between the measured S11 parameter and , as a function of rf-frequency, is shown in Fig. 6. As shown in the figure for sample points, when there is a discontinuity in the power spectrum, we get an observable SQUID signal. The mag-nitude of this signal depends on how close the distortion fre-quency is to the main resonance frefre-quency of the tank circuit.
We also investigated the effect of very high applied power where the symmetry in the was lost and the signal does not show anymore Sinc-like behavior. As shown in Fig. 7, rather the envelope of the peaks in the signal showed the Sinc like behavior. According to our speculation, the rf signal also starts to drive the SQUID characteristics across the hysteretic curve
678 IEEE TRANSACTIONS ON APPLIED SUPERCONDUCTIVITY, VOL. 17, NO. 2, JUNE 2007
Fig. 6. The relation between the power spectrum andV with respect to rf-frequency. The open circle on the power spectral graph show few examples of discontinuity in the power curve giving rise to a peak inV of the SQUID signal.
Fig. 7. The effect of the very high applied power. Note that the symmetry in the V is lost and the signal does not show anymore Sinc-like behavior compared to Fig. 2.
causing extra peaks around the resonance frequency due to high rf-power [6].
B. SQUID Dependence of the rf Characteristics
Three different SQUIDs from the same chip have been inves-tigated to find the effect of consistency of the above-mentioned behavior. It was observed that by shifting from one SQUID to another on the same chip, there is a slight change in the max-imum rf-frequency. But the overall behavior of their was similarly Sinc like. The contour plots for two of the SQUIDs on a single chip are shown in Fig. 8.
The vs. frequency at a single applied power for two SQUIDs are shown in Fig. 9. It is clear that the rf-frequency of the max has been shifted from 717 MHz to 721 MHz while power shifts from 75.13 dBm to 77.06 dBm. The data
Fig. 8. The effect of the rf-frequency and pump power onV for SQUID 1 (a) and SQUID 2 (b). The contour plots are obtained by combining theV vs. rf-frequency (Fig. 2) andV vs. rf-power data.
Fig. 9. V vs. rf-frequency for two different SQUIDs from the same chip at a fixed input power.
obtained from the of a third SQUID on the same chip, had a at a higher tune frequency for a lower tune power than either examples one and two. So, one might con-clude that SQUIDs with higher frequencies requires lower input power. And as stated before, this resonance frequency matches to that of tank circuit and alternatively to the electronics leading
AKRAM et al.: EFFECT OF rf PUMPING FREQUENCY AND INPUT POWER ON FLUX TO VOLTAGE TRANSFER 679
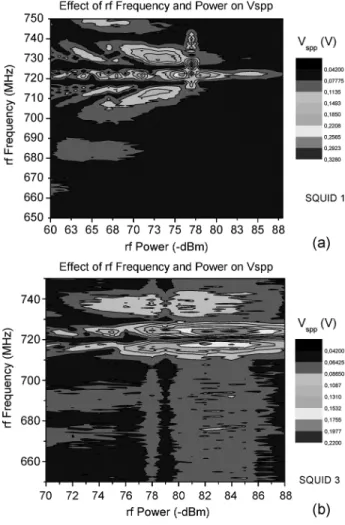
Fig. 10. The effect of the rf-frequency and pump power on V for (a) SQUID 1 and (b) SQUID 3. The contour plots are obtained by combining theV vs. rf-frequency (Fig. 2) andV vs. rf-power data (Fig. 3).
to the need for high frequency electronics. The result shown in Fig. 9 depicts the consistency of the behavior of the prop-erties vs. rf-frequency for different SQUIDs.
C. Effect of Different Substrate Devices
In order to investigate the dependence of the behavior of of the SQUIDs on different processing techniques and substrates, the signal of devices on various chips were com-pared. As our initial findings, it was observed that the Sinc behavior is associated with a particular chip characteristics and fabrication. The results of two SQUIDs from different chips are shown in Fig. 10. For the SQUID in Fig. 10-b, the Sinc like behavior could not be observed, which was confirmed with an-other SQUID from the same chip. This change in the behavior
can be speculated due to change in the substrate properties, film deposition, and/or change in the substrate surface finishing due to ion beam etching processes, or due to inconsistencies in patterning which is under further investigation.
IV. CONCLUSION ANDFUTUREWORK
During the course of this study, we have successfully de-signed and implemented low noise rf-SQUID electronics with working frequency range of 600 MHz to 900 MHz. Different from commercially available rf-electronics, we were able to ac-cess the inputs and outputs of each unit. Using this flexibility of the home made rf electronic system, SQUID signal characteris-tics have been investigated versus input rf-frequency and input rf-power. According to the observations, it was found that the SQUIDs made on same chip shows similar Sinc like behavior with slight shifts in the frequency of or rf-input power. On the other hand, the relation between maximum frequency and power shows a inverse linear behavior for different SQUIDs from the same chip. This is while the SQUIDs from different chips show different behaviors due to different inductances and physical characteristics. Power spectrum at the rf-input of mixer shows one to one relationship with the maximum of the vs. rf-frequency graph, while the maximum lobes are around the resonance frequency of the tank circuit system. As a future work, it is required to test different rf-SQUID types (magnetometer and gradiometer), effect of tank circuit configuration, and effect of substrate res-onator. This would lead to a better understanding of the SQUID characteristics and their relation with rf-frequency and input power, which would further lead to an optimal system design.
REFERENCES
[1] Clarke and Braginski, “The SQUID Handbook,” 2004, vol. 1, pp. 79–80.
[2] J. Schubert, M. Siegert, M. Fardmanesh, W. Zander, M. Prompers, C. Buvhal, J. Lisoni, and C. H. Lei, “Superconducting and electro-optical thin films prepared by pulsed laser deposition technique,” Appl. Surface Science, vol. 168, p. 208, 2000.
[3] M. Fardmanesh, J. Schubert, R. Akram, M. Bick, M. Banzet, W. Zander, and J.-H. Krause, “Dependence of the substrate structure and the film growth at the junction of YBCO SEJ rf-SQUIDs on the IBE process and effects on the SQUID’s characteristics,” Physica C, vol. 372, p. 240, 2002.
[4] R. Akram, “Development of SC SQUID Magnetic Sensor for Scan-ning SQUID Microscope Application,” PhD thesis, Bilkent university, , 2005.
[5] T. Eker, “Design and implementation of an rf-SQUID read out system working in the frequency band of 600 MHz–900 MHz and investigation of SQUID characteristics,” MS Thesis, Bilkent University, , June 2005. [6] A. I. Braginski, H.-J. Krause, and J. Vrba, “SQUID magnetometers,” in Handbook of Thin Film Devices: Frontiers of Research, Technology and Applications, P. Broussard, Ed. San Diego: Academic Press, 2000, vol. 3.