Mugla Journal of Science and Technology
143
AN EFFECTIVE ROCOMMENDER MODEL FOR E-COMMERCE PLATFORMS
Muhittin IŞIK1 , Hasan DAĞ 21
Institute of Science and Engineering, Kadir Has University, 34200, Istanbul, Turkey
Management Information Systems, Kadir Has University, 34200, Istanbul, Turkey
Received: 30.10.2017, Accepted: 24.11.2017
*Corresponding author doi: 10.22531/muglajsci.357313
Abstract
Because of the sparsity problems in databases, fake accounts can easily affect results of recommender algorithms especially when a product does not have enough votes by consumers. Generally, fake accounts are created by the owner of the product in order to raise their product score or by the ill-wishers who wants to denigrate a product or a company. This situation represents a great sense for e-commerce platforms especially when considering that majority of companies have less than 1% density of database. In order to overcome negative effects of the fake accounts in e-commerce platforms, this study proposes a recommender model, which will find the consumers who are trustful and have a great effect on other’s opinion by analyzing the relationship between consumers. With the proposed model, the Recommender Systems (RS) are expected to provide recommendations to customers based on trustful users’ opinions to improve the quality of RS in e-commerce platforms.
Keywords: e-commerce, trustful users, recommender model.
E-TİCARET ORTAMLARI İÇİN ETKİLİ BİR TAVSİYE MODELİ
Öz
Sahte kullanıcı hesapları, veri tabalarındaki seyreklik problemlerinden dolayı özellikle yeteri kadar kullanıcı tarafından puanlanmamış ürünlerde tavsiye algoritmalarını kolaylıkla etkileyebilmektedirler. Genellikle bu kullanıcı hesapları kendi ürününün puanını artırmak isteyen ürün sahipleri olabildiği gibi herhangi bir ürünü veya şirketi karalamak isteyen kötü niyetli kişiler de olabilmektedir. Bu durum birçok şirketin veri tabanı yoğunluğunun %1 den daha az olduğu düşünülürse e-ticaret ortamlarına nasıl bir etki yarattığı tahmin edilebilir. Bu çalışmada, sahte hesapların e-ticaret ortamlarında oluşturdukları negatif etkilerin üstesinden gelebilmek için, kullanıcılar arasındaki ilişkiler analiz edilerek diğer kullanıcılar üzerinde etkisi olan ve gerçekten güvenilir olduğu düşünülen kullanıcılar bulunarak bir tavsiye modeli oluşturulmaktadır. Böylece, güvenilir kullanıcıların düşüncelerinden yola çıkılarak e-ticaret ortamlarında kullanıcılara tavsiyelerde bulunan Tavsiye Sistemlerinin (TS) kalitesini artıracak bir tavsiye sistemi oluşturulacaktır.
Anahtar Kelimeler: E-ticaret, güvenilir kullanıcılar, tavsiye modeli. 1. Introduction
The more number of the customers shopping online increase with developed secure e-commerce systems, the more companies work on e-commerce platforms rather than traditional commerce. Moreover, it is speculated that soon the amount of commerce done on e-commerce systems, will pass the amount in the traditional commerce [1]. For this purpose, today’s e-commerce companies analyze click and purchase history of customers. It is necessary to determine customers’ behaviors for improving the quality of recommender systems. Unfortunately, the feedback of users is insufficient for analyzing customers better. Even most of the companies state that the density of their database is less than 1% [2]. This is really a major obstacle in front of the further success of the companies.
Todays, when buying a product online, the product score is very important when making our last decision but due to the sparsity problems in databases, fake accounts can easily affect results of recommender algorithms especially when the product doesn’t have enough votes by consumers. Generally, fake accounts are created either by the owner of the product
in order to raise their product score or by the ill-wishers who want to denigrate a product or a company. For instance, on average 100 fake accounts can easily identify the score of a hotel on TripAdvisor if that hotel does not have too much votes. Thus, in order to overcome the negative effects of the fake accounts in e-commerce platforms, we try to create a recommender model, which will find the consumers who are trustful and have a great effect on other users’ opinion. On the other hand, some products or items do not have enough ratings in order to calculate their real rating value or score. Sometimes products get very high or very low rating value because of this reason. Therefore, we can get the real rating value of a product by looking at trustful users’ opinions. Thus, relationship between customers will be revealed in order to find out trustful customers via PageRank algorithm and recommendations will be provided to customers based on trustful customers.
The significance and implications of the proposed system can be listed as follows:
i. It will be a different recommender model on products based on trustful users’ opinions, unlike the current recommender systems.
144
ii. It will break down the power of fake accounts on recommender algorithms in order to get real score of a product.
iii. It will help to overcome to the sparsity problem of recommender systems in e-commerce platforms.
iv. The system will be based on trust relationship between users but it will be different from the existing trust-based recommender models since the trustworthiness value of a user will be calculated by the consensus about a product not the similarity between target users to others. v. It can be used for comparing normal score with expert
score when buying or consuming a product to confirm the quality. This is really a big problem for the customers because they generally buy the products by trusting normal rating score, most of which are boomed values.
2. Background and Context
In recent years, with the rise of the importance of recommender engines in e-commerce platforms, people and companies start to affect results of recommender algorithms in order to increase the ratings of their products by creating fake accounts. Because, in real life, when we make our decision about buying or choosing a product or service, obviously, we are influenced by the opinions of the people surrounding us. Especially in e-commerce platforms, people pay attention to the rating of products which they want to buy or use as a service and examine most of all, if not all of, the reviews before making a final decision. For example, when we search a hotel on TripAdvisor, at first, we are checking on how many stars that hotel has and then we are reading almost all comments about that hotel. On this type of website, people can also click like button if they agree with that comment or dislike button if they do not. This feature is also important for checking the quality of that hotel. In this study, we will analyze the relationship among users in order to find users, who are trusted by others, and calculate the ratings of products according to those trustful users’ opinions. In this way, we will present two types of ratings to the users. The first one will be the normal score and the second one will be weighted score based on trustworthiness of the users. Therefore, people will have a chance to compare two rating results. Moreover, it will show the quality of rating result if the two rating results are almost equal. We will first explain the basic background of the recommender systems and explain the basic mathematical background of the PageRank algorithm, which we will use in our research in order to reveal relationship between customers. This will let us find trustful users.
2.1 Recommendation Systems
Recommendation engines are software tools for providing next best offer, next best decision or next best activity suggestion for a particular customer. These suggestions, decisions or offers help customers or users to make a decision in numerous fields such as when choosing a music to listen, when buying an item, when selecting a movie to watch, or when trying to find a book similar with one before. Amazon, Netflix, eHarmony, and Pandora are probably the most well-known examples that use recommendation systems [3].There are a couple of techniques in Recommendation Systems such as non-personalized recommenders, content-based recommenders, and collaborative filtering recommenders etc.
2.1.1 Content Based Filtering
“Content-based recommender systems base recommendations on user ratings and similarity between items” [4]. Actually, this
approach comes from information retrieval. It is based on content analysis. This content can be a document or a website, or it can be defining a movie, music or a restaurant. It tries to provide items that are similar to those that users preferred before. In order to recommend new items, this algorithm compares attributes of items by looking at a user profile in which preferences are pre-existed in database. In other words, it is actually based on prosperities of the products and a profile of the customer’s personal preferences or interests.
2.1.2 Collaborative Filtering
Collaborative Filtering is a technique in Recommendation Systems, especially used by the biggest websites such as Amazon, Netflix, Pandora and others, that uses user behavior such as purchases, clicks and ratings. In this way, it provides recommendations to users using by consumer items such as movies, music, books etc. Collaborative filtering (CF) has a couple of algorithms to provide recommendations. Two of them are user-based and item-based algorithms. These two ways of generating recommendations are typical.
2.1.2.1 User-based Recommendation
User-based is the most common techniques used in recommendation systems and some of the earliest studies were also on this model in the field. The basic logic is to advise people starting out in similar user ratings. Namely, “a subset of users is chosen based on their similarity to the active user and a weighted combination of their ratings is used to produce predictions for this user” [5].
2.1.2.2 Item-based Recommendation
The basic logic is to calculate similarity between items instead of users and make recommendations. Therefore, instead of finding similar users when giving a recommendation to a user, it tries to find out similar items by using his/her likes [6].
2.2 PageRank Mathematics
PageRank algorithm was the backbone of the Google search engine in 2000s. The PageRank algorithm when given an inquiry to the search engine determine the importance of a web page in the ranking pages result list. As it is known, the basic logic of PageRank algorithm is that the importance of a website increases so long as the number of inlinks increases. In this regard, the PageRank algorithm can be considered as election logic. However, in this algorithm, one can distribute his/her vote between attendees. Namely, you distribute your vote between other websites by giving links if you think those websites are the best to represent your website. Then, when given an inquiry to the search engine, the algorithm controls the scores of each page in the related field. The website, which has more inlinks than the rest comes to the top of the resulting list.
It is useful to explain one more thing in this election logic. Since the score of each website is calculated by inlinks, each website has different score. Therefore, it is important which website sent a link to your website and at what rate. Namely, because of getting more inlinks, bbc.com will have more affect than any ordinary website on your website if you get a link from. Of course, it is a dynamic structure and the score of each website is constantly changing. As a result, everyone’s vote is not equal as in general election on the internet graph. Let us look at the mathematics of PageRank algorithm.
145
Larry Page and Sergey Brin summarized the PageRank calculation with a simple sum formula.
𝑟(𝑃𝑖) = ∑
𝑟(𝑃𝑗)
|𝑃𝑗| 𝑃𝑖∈𝐵(𝑃𝑖)
(1) As it is seen in (1), the Simple PageRank Formula, PageRank of a page “i”, 𝑟(𝑃𝑖), is calculated by collecting of all PageRank
coming from other webpages to the page “i”. 𝐵(𝑃𝑖) represents the inlinks to the page 𝑃𝑖. |𝑃𝑗| represents the outlinks from the
page 𝑃𝑗 . But how can we calculate 𝑟(𝑃𝑗)? In order to overcome
this problem, Brin and Page used an iterative calculation. According to this iterative calculation, each webpage has an equal PageRank score at the beginning of calculation.
𝑟𝑘+1(𝑃𝑖) = ∑
𝑟𝑘(𝑃𝑗)
|𝑃𝑗| 𝑃𝑖∈𝐵(𝑃𝑖)
(2) In (2), the Iterative PageRank Formula, the PageRank value of each 𝑃𝑖 is calculated by getting one before value of the 𝑃𝑗. So, in
order to get 𝑟𝑘+1(𝑃𝑖) of page 𝑃𝑖 at iteration k+1, we use the
adjacent formula. This process is started for all page in the graph with 𝑟0(𝑃𝑖)= 1/n, where n is the number of page in the
related graph. To illustrate this calculation, let us apply on a simple graph.
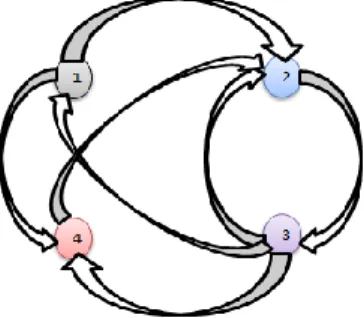
Figure 1. A graph with four nodes
Assume that we have “1” point value and 4 pages. So, when we start to calculate, each node will get 1/4 scores at the beginning. In the first iteration, node 1 will distribute its point between node 2 and node 4 (each node will get 1/8 points). Node 2 will give all its points to the node 3. Node 3 will distribute its points between node 1, 2, and 4 (each node will get 1/12 points). Lastly, the node 4 will give all its points to the node 2. At the end of the first iteration node 1 will have 1/12 points coming just from node 3. Node 2 will have 11/24 (1/8+1/12+1/4) coming from node 1, node 3, and node 4 respectively. Node 3 will have 1/4 points coming just from node 2. Lastly node 4 will have 5/24 (1/8+1/12) points coming from node 1 and node 3. Let us show the first two iterations in the table.
Table 1. First few iterates using on Fig. 1.
Iteration 0 Iteration 1 Iteration 2 Rank r0(P1) = 1/4 r1(P1) = 1/12 r2(P1) = 1/12 4 r0(P2) = 1/4 r1(P2) = 11/24 (1/8+1/12+1/4) r(1/24+1/12+5/24) 2(P2) = 8/24 2 r0(P3) = 1/4 r1(P3) = 1/4 r2(P3) = 11/24 1 r0(P4) = 1/4 r1(P4) = 5/24 (1/8+1/12) r(1/24+1/12) 2(P4) = 3/24 3
In Table 1, at the end of the iteration 2, node 1 will be the last page and node 3 will be the first page on the raking page result list. Even if node 1 gets a link from the winner node 3, it could
not pass the others. Because the winner node 3 distributes its point to all pages, so it is meaningless to get a link from node 3. Likewise, even if node 2 gets links from all nodes, node 3 comes first because of getting all points of nodes 2. Consequently, in order to find most trustful users in our dataset via PageRank algorithm which sometimes we will call Trustworthiness in this study in order to understand concept easily and we will assume that each user in our dataset is a node on a graph.
2.2.1 Matrix Representation to Compute User Trustworthiness Score
Trustworthiness calculation can be considered as a matrix problem. We saw how we can calculate the PageRank score by given formula. However, it can be calculated in an easier and understandable way using matrices at each iteration. It can also be easier to apply other operations on matrix. To accomplish this, we just transform our graph to a matrix structure. To illustrate, let us apply on a simple graph. To transform our graph to a matrix, we use the following rule [7].
𝐻𝑖𝑗≔ {
1
𝑁 𝑖𝑓 𝑡ℎ𝑒𝑟𝑒 𝑖𝑠 𝑎 𝑙𝑖𝑛𝑘 𝑓𝑟𝑜𝑚 𝑃𝑖 𝑡𝑜 𝑃𝑗
0 𝑂𝑡ℎ𝑒𝑟𝑤𝑖𝑠𝑒
Figure 2. A graph with six nodes
As it can be seen in the Fig. 2, our directed graph consists of six users, which represents a very small version of our dataset. Here, links are indicated trust relationship between users. For instance, there are two links from user 1 to user 2 and 3, respectively. It means that user 1 distributes its trust between user 2 and 3 by half-and-half. User 2 does not distribute its trust. User 3 distributes its trust between node 1, 2 and 4 by a third, user 4 distributes its point between node 5 and 6 by half-and-half, user 5 gives all its trust to user 6, and lastly user 6 distributes its trust between user 4 and 5 by half-and-half. After distributing trusts, we can arrange our matrix:
H= [ 0 1 2 1 2 0 0 0 0 0 0 0 0 0 1 3 1 3 0 1 3 0 0 0 0 0 0 1 2 1 2 0 0 0 0 0 1 0 0 0 1 2 1 2 0]
As it is seen in the “H” matrix, if there is no link from the user (node) Pi to another user, we put a “0” to that place. Namely,
146
we don’t share Pi’s trust with that user. Accordingly, 𝐻𝑖𝑗
indicates a directed link from user “i” to user “j”. Likewise, 𝑁𝑖
indicates the total number of outlinks from user “i”. Thus, each row represents the outlinks from user “i”, whereas each column represents the inlinks to user “i”. Then, we can calculate the Trustworthiness score for each user according to the obtained values by the iterative formula:
𝑟(𝑃)𝑇
𝑘+1= 𝑟(𝑃)𝑇𝑘∗ 𝐻 , k = 0, 1, 2, … (3)
We will denote the Trustworthiness score with “π” in the following sections. Thus,
𝜋𝑇
𝑘+1= 𝜋𝑇𝑘∗ 𝐻, 𝑘 = 0, 1, 2, … (4)
2.2.2 Random Walk on the Web Graph
It will be useful to know Random Walker in order to understand the structure and problems of Trustworthiness algorithm since it will be easy to comprehend the transition between users by Random Walk model. Random Walker starts to move by selecting a random user and move on to one another user using one of the external links on this user. This movement is repeated for each occurrence of a new user. However, there is one more thing that we should pay attention to this movement. If the Random Walker chooses a user according to the external links, it means that that user has too much inlinks and the probability of the Random Walker chooses that user will be more than other users. Another important point of the Random Walker movement is that the probability of a user being selected by the Random Walker is not relevant the previous user [8]. Namely, assume that Random Walker passed from user “i” to user “j”, the next movement of Random Walker is not affected by user “i”. Random Walker goes on its way by choosing an outlink on the user “j”.
2.2.3 Dangling Users Problem in the Trustworthiness Algorithm
We have seen how to the Random Walker provides the transition between users. But if we look at the graph in figure 2 carefully, we will realize several problems when the Random Walker passes from one user to another. As we mentioned before, the Random Walker passes to another user by choosing an outlink on arrived user. However, when the Random Walker arrives user 2, it cannot move from user 2 to another users since there is no outlinks on user 2. We called user 2 as a dangling user. For this reason, as it is seen in “H” matrix, all the entries are “0” on row 2. But how the Random Walker will move to other users in this circumstance. The Random Walker will stop the process or it will start again in such a case. Nevertheless, because of reducing the performance of the Random Walker, such a solution is not a very attractive method. To overcome this problem, Brin and Page appealed to the following method [9].
𝑑𝑖≔ {
1 𝑖𝑓 𝑝𝑎𝑔𝑒 "i" 𝑖𝑠 𝑎 𝑑𝑎𝑛𝑔𝑙𝑖𝑛𝑔 𝑛𝑜𝑑𝑒 𝑖 = 1,2, … , 𝑛
0 𝑂𝑡ℎ𝑒𝑟𝑤𝑖𝑠𝑒
If a user does not trust to any other users, its Trustworthiness score will be distributed equally to all other users. For “n” dimensional matrices, all the entries of the row consisted by zeros will be replaced by 1/n. according to this process, our new matrix formulation will be as follows.
𝑆 = 𝐻 + (1
𝑛) 𝑑𝑒𝑇 (5)
Where in formula 5, “e” represents the column vector of all 1s and “d” indicates the dangling node and equal to “1”, or “0” otherwise as it is stated as below. If we apply this formula on our graph (figure 2), the d2 column vector which is second row
consisted of zeros will get “1” value in our matrix.
Accordingly, when we also add “H” matrix over “S” matrix, it will be as follow: [ 0 1 2 1 2 0 0 0 0 0 0 0 0 0 1 3 1 3 0 1 3 0 0 0 0 0 0 1 2 1 2 0 0 0 0 0 1 0 0 0 1 2 1 2 0] + [ 0 𝟎 0 0 0 0 𝟏 𝟔 𝟏 𝟔 𝟏 𝟔 𝟏 𝟔 𝟏 𝟔 𝟏 𝟔 𝟎 𝟎 0 0 0 0 0 0 0 0 0 0 0 0 0 0 0 0 0 0 0 0 0 0] = [ 0 1 2 1 2 0 0 0 𝟏 𝟔 𝟏 𝟔 𝟏 𝟔 𝟏 𝟔 𝟏 𝟔 𝟏 𝟔 1 3 1 3 0 1 3 0 0 0 0 0 0 1 2 1 2 0 0 0 0 0 1 0 0 0 1 2 1 2 0]
We will get the above result. Namely, we used a row stochastic matrix which sum of all the entries is equal to 1 in order to get “S” matrix. Even though we solved the dangling users problem, we have still some problems if we look at carefully to our graph. Let’s take a glance at the next problem.
2.2.4 Rank Sink Graphs Problem in the Trustworthiness Algorithm
We have seen how to solve dangling users problem in the Trustworthiness algorithm. But when we take/divide our graph as several sub graphs, we will see the Random Walker has another problem. Assume that Random Walker passed from user 3 to user 4, Random Walker will drive round and round in that sub graph consisted of users 4, 5, and 6 since there is no outlink from this sub graph to another consisted of users 1, 2, and 3. In this way, users 4, 5, and 6 will get more and more Trustworthiness value at each iteration. We called this as a “rank sink subgraph problem” which refuse to share Trustworthiness via not giving a trust link to another users or sub graphs. To overcome this problem that Random walker gets stuck in a sub graph, we will transform our matrix into an irreducible matrix. It is called “teleportation” method providing PageRank Algorithm turn into an irreducible status. Even if there is a little chance, Random Walker will be able to make a transition between users in this way. Let’s represent this method with a formula:
𝐺 = 𝛼𝑆 + (1 − 𝛼) (1
𝑛) 𝑒𝑒𝑇 (6)
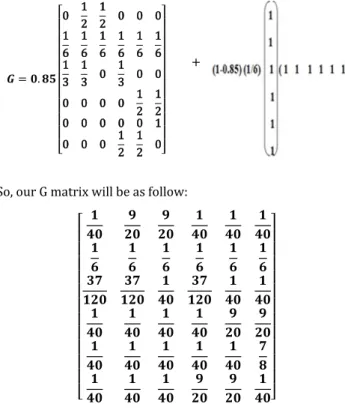
Likewise the before in the formula 5, “e” represents the column vector of all 1s, “α” is the damping factor or breaking the power factor of rank sink sub graphs (teleportation probability factor) which is between “0” and “1” (generally it is equal to 0.85). Let’s apply this formula on our matrix.
147
𝑮 = 𝟎. 𝟖𝟓 [ 0 1 2 1 2 0 0 0 1 6 1 6 1 6 1 6 1 6 1 6 1 3 1 3 0 1 3 0 0 0 0 0 0 1 2 1 2 0 0 0 0 0 1 0 0 0 1 2 1 2 0] +So, our G matrix will be as follow:
[ 𝟏 𝟒𝟎 𝟗 𝟐𝟎 𝟗 𝟐𝟎 𝟏 𝟒𝟎 𝟏 𝟒𝟎 𝟏 𝟒𝟎 𝟏 𝟔 𝟏 𝟔 𝟏 𝟔 𝟏 𝟔 𝟏 𝟔 𝟏 𝟔 𝟑𝟕 𝟏𝟐𝟎 𝟑𝟕 𝟏𝟐𝟎 𝟏 𝟒𝟎 𝟑𝟕 𝟏𝟐𝟎 𝟏 𝟒𝟎 𝟏 𝟒𝟎 𝟏 𝟒𝟎 𝟏 𝟒𝟎 𝟏 𝟒𝟎 𝟏 𝟒𝟎 𝟗 𝟐𝟎 𝟗 𝟐𝟎 𝟏 𝟒𝟎 𝟏 𝟒𝟎 𝟏 𝟒𝟎 𝟏 𝟒𝟎 𝟏 𝟒𝟎 𝟕 𝟖 𝟏 𝟒𝟎 𝟏 𝟒𝟎 𝟏 𝟒𝟎 𝟗 𝟐𝟎 𝟗 𝟐𝟎 𝟏 𝟒𝟎]
2.2.5 Computation of the PageRank Vector
After solving the problems, it is time to calculate Trustworthiness vector which provides the importance of each user in an order. We can start to calculate our “G” matrix now. Since all the entries in matrix “G” are bigger than “0”, there is a path between any user “i” and “j”, we call this type of graphs as strongly connected graphs. In this way, Random Walker could make a transition between any users. As it is done before in the example, we can start with dividing our Trustworthiness value (which is equal to 1) equally among users in order to start iterative process. We have 6 users in our graph. It means each user will get 1/6 Trustworthiness score at the beginning of iterative process. After the first process, the Trustworthiness score of each user will change according to their importance until a threshold. After the threshold, each user will start to get an unchanged score, in other word they will reach a balance or saturation point. This threshold (the number of iteration of the process) is changed according to the graph structure. We will get each result of iterative process according to the logic as we mentioned before in table 1. That operation is the same with multiplying matrix “G” with 𝜋𝑇. Accordingly, our first step of importance
vector will be as follows: 𝜋𝑇 (𝑘+1)= 𝜋𝑇(𝑘)𝐺 (7) 1.step 𝜋𝑇 (𝑘+1)= 𝜋𝑇(𝑘)𝐺, 2.step 𝜋𝑇 (𝑘+1)= (𝜋𝑇(𝑘)𝐺)𝐺, 3.step 𝜋𝑇 (𝑘+1)= ((𝜋𝑇(𝑘)𝐺)𝐺)𝐺, and so on
At the last the Trustworthiness score of each user will reach a saturation point and after that saturation point, results will not be changed. Here the first iterate of the Trustworthiness vector. 𝜋𝑇= [𝟏 𝟔 𝟏 𝟔 𝟏 𝟔 𝟏 𝟔 𝟏 𝟔 𝟏 𝟔] πT1 = πT G = (0,095833333 0,166666667 0,119444444 0,166666667 0,190277778 0,261111111)
If we go on to compute the Trustworthiness vector, we can get ultimate Trustworthiness vector (𝜋𝑇*). It is shown the
Trustworthiness vector of each iteration in the table 2 and ultimate Trustworthiness vector (𝜋𝑇∗).
Table 2. Trustworthiness vector of each iteration and ultimate Trustworthiness vector (𝜋𝑇∗) User / Iterate π T2 πT36 πT* 1 0,08245370 0,05170474 0,05170474 2 0,12318287 0,07367926 0,07367926 3 0,08934027 0,05741241 0,05741241 4 0,19342592 0,19990381 0,19990381 5 0,23041666 0,26859608 0,26859608 6 0,28118055 0,34870368 0,34870368
As it is seen our ultimate Trustworthiness vector (πT* ) fixated at iteration 36. According to the 𝜋𝑇∗, the order of the user
importance is as 2 > 3 > 1. For the second sub graph the order of the user importance is as 6 > 5 > 4. This is show that the importance of user 4 is bigger than user 3 (4 > 3). Consequently, the order of the user importance is as 6 > 5 > 4 > 2 > 3 >1 in this tiny graph. According to the result, the most important person is user 6 and the least important person is user 1. If we interpret the result, the Random Walker visit user 1, 5.170% and user 6, 34.870% of the time.
3. Dataset
Table 3. Rating Dataset
User_id Item_id ratings
0 1 1 3
1 1 2 4
2 1 3 4
3 1 4 5
For the research, we got a dataset from http://www.jiliang.xyz/trust.html because of having trust relationship between users. For each user, we have his ratings and his trust relations. The rating dataset shows “user id”, “item id”, “ratings” which given to the related product by the related user. So, when we look at the table 3. user 1 gives to item 1 “3” point. And our dataset consists of 284086 rows with 3 columns. It is a “.csv” file and 4.82 Mb.
Table 4. Trust Network Dataset trustee trustor
0 1 3
1 1 4
2 1 5
3 1 6
The second dataset, which displays the trust relationship between users. The trustnetwork dataset showss the trustee and the trustor respectively. So, “user 1” trust to “user 3”, “user 4”, “user 5”, and so on. And our trusted network dataset consists of 111781 rows with 2 columns. It is a “.csv” file and
148
998 Kb. Our algorithms are executed on Jupyter Notebook with python version “2.7.11”.
4. Findings
Table 5. Trustfulness of each user
As it is seen to the table 5, when we executed our algorithm on our dataset as we mentioned above, we got the trustworthiness score of each user between the range of 0 to 10. For instance, user 1 has approximately “5” point whereas user 2 has almost “1” point. Namely, we can say that user 1 is more trustful than user 2 according to the other users. So now we will calculate ratings of items based on trustworthiness score. Generally, any item’s rating is calculated by average of all users’ ratings who has a preference/rate that item before but now we will calculate by looking at user’s trustworthiness score. In other words, we will calculate rating of an item with weighted average by trustworthiness score. In short, if user 1 has more trustworthiness score than user 2, it will affect the rating of that item more weighted by his/her trustworthiness score.
𝑊𝑒𝑖𝑔ℎ𝑡𝑒𝑑 𝐴𝑣𝑒𝑟𝑎𝑔𝑒 = (∑ 𝑋𝑖𝑊𝑖)/𝑊𝑖
=(Σ Rating*Trustfulness) / Trustfulness (8)
Table 6. Comparing Average Rating Score and Weighted Rating Score Based on Trustworthiness
Item_id Number of
Users Average Rating Score Rating Score Based on Trustworthiness 1 1 3 3 2 1 4 4 3 1 4 4 4 3 3,6666 3,9860
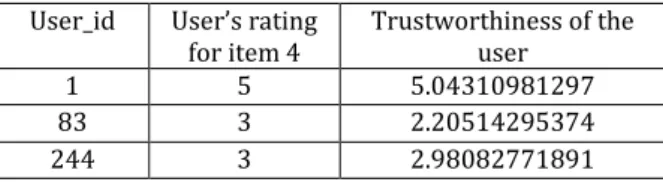
As it is seen from the table 6, for item 1, there is no difference between Average Rating Score (ARS) and Weighted Rating Score Based on Trustworthiness (WRSBT) both are “3.0” because of rating only by one user. But when we look at the item 4, 3 users rated this item and the difference is almost 0.3194. This means that some of these users have more trustworthiness score and rated this item more than average. Let us look at who rated this item “4” and what are their trustworthiness score.
Table 7. Trustworthiness of the User who rated item 4 User_id User’s rating
for item 4 Trustworthiness of the user
1 5 5.04310981297
83 3 2.20514295374
244 3 2.98082771891
As you can see from the table 7, user 1, user 83 and user 244 rated item 4. Since the user 1 is more trustful user and rated with 5 point to the item 4, WRSBT of the item 4 is bigger than ARS. The other important result is the average difference ratio between ARS and WRSBT when the number of users who rated to the related items increase. Let us see the average difference between ARS and WRSBT when the number of rated users increases on 10.000 items in our dataset.
Table 8. Changing the difference between ARS and WRSBT by the different range of users
Number of
users Number of items Average Difference
2-5 3521 0.2368 6-10 1104 0.1888 11-20 753 0.1484 21-50 403 0.1209 51-100 73 0.0901 >100 51 0.0408
According to the table 8, 3521 items were rated by between 2 and 5 users and the average difference between ARS and WRSBT is 0.2368, likewise 51 items were rated by more than 100 persons and the average difference between ARS and WRSBT is 0.0408. Moreover, 94.73% of items were rated by less than 20 people. It means that it is easily to change the rating of an item by creating fake accounts.
5. Discussion and Conclusion
In this study, we tried to show how fake accounts affect rating scores of items in e-commerce platforms and how to overcome these types of problems. For this purpose, we analyzed relationship between users and we found a trustworthiness value for each of them. Thus, we calculated rating score of each items by weighted average of users’ ratings according to their trustworthiness values instead of getting directly average of the users’ ratings. According to the results, the items, which is rated by between 2 and 20 people have a great rating score difference between ARS and WRSBT. It means that when the number of users who rated the item decreases, the effect of the fake accounts is going up. On the other hand, when the number of users increases, especially more than 100 people, the difference between ARS and WRSBT decreases almost “0”. Actually, this is also a proof that our model work very well. Consequently, if we think databases which are suffering from the sparsity problems, this model will be a nice solution. By this model, items will get deserved rating score more than in traditional model.
6. Acknowledgment
This article was presented as an oral presentation at the IMISC2017.
7. References
[1] M. Işık, H. Dağ and I. Yenidoğan, "E-ticaret Sistemleri İçin Bir Öneri Sistemi: Mahout," in YBS.2014, İstanbul, 2014.
[2] S. Deng, L. Huang ve G. Xu, «Social network-based service recommandation with trust enhancement,»
[Çevrimiçi]. Available:
http://www.sciencedirect.com/science/article/pii/S0 957417414004102. [%1 tarihinde erişilmiştirAugust 2014].
[3] P. Winters and M. Zeller, "Social Media, Recommendation Engines and Real-Time Model
149
Execution: A Practical Case Study," 2011. [Online]. Available:
https://www.knime.org/files/knime_zementis_white_ paper.pdf. [Accessed 10 August 2015].
[4] N. Tintarev, «Explaining recommendations,» Aberdeen, 2009.
[5] P. Melville and V. Sindhwani, "Recommender Systems,"
[Online]. Available:
http://www.prem- melville.com/publications/recommender-systems-eml2010.pdf. [Accessed 21 August 2015].
[6] S. Alag, Collective Intelligence, Greenwich: Manning Publication Co., 2009.
[7] A. N. Langville and C. D. Meyer, Google's PageRank and Beyond: The Science of Search Engine Rankings, Princeton, New Jersey: Princeton University Press, 2006.
[8] R. S. Wills, When rank trumps precision: Using the
power method to compute Google's PageRank, Raleigh:
Nort Carolina State University, Dept. of Mathematics, 2007.
[9] S. Brin, L. Page, R. Motwami and T. Winogard, "The PageRank citation ranking: Bringing order to the Web," Stanford University, Computer Science Department, 1999.
[10] J. Chen, "Personalized Recommendation in Social Network Sites," Minnesota, 2011.
[11] M. Işık, Pagerank && Trustrank, İstanbul: İkinci Adam, 2013.
[12] M. Jamali and M. Ester, "TrustWalker: A Random walk model for combining trust-based and item-based recommendation," Proceedings of the 15th ACM
SIGKDD international conference, p. 2009, June 28- July
1 2009.
[13] A. Jane, "Analyzing Big Data with Twitter: Recommender Systems," 9 September 2012. [Online]. Available:
https://www.youtube.com/watch?v=NSscbT7JwxY. [Accessed 20 October 2016].
[14] S. Owen, R. Anil and E. Friedman, Mahout in Action, Shelter Island: Manning Publications Co., 2012.