Assembling Photoluminescent Silicon Nanocrystals into Periodic
Mesoporous Organosilica
Min Guan,
†,‡Wendong Wang,
‡Eric J. Henderson,
‡Ömer Dag,
‡,§Christian Kübel,
∥,⊥Venkata Sai Kiran Chakravadhanula,
∥Julia Rinck,
#Igor L. Moudrakovski,
∇Jordan Thomson,
‡Jeffrey McDowell,
‡Annie K. Powell,
∥,○Haixia Zhang,*
,†and Geoffrey A. Ozin*
,‡†Department of Chemistry, Lanzhou University, Lanzhou 730000, China
‡Materials Chemistry and Nanochemistry Research Group, Center for Inorganic and Polymeric Nanomaterials,
Chemistry Department, University of Toronto, 80 St. George Street, Toronto, Ontario, Canada M5S 3H6
§Department of Chemistry, Bilkent University, 06800 Ankara, Turkey
∥Institute of Nanotechnology, Karlsruhe Institute of Technology (KIT), Hermann-von-Helmholtz-Platz 1,
D-76344 Eggenstein-Leopoldshafen, Germany
⊥Karlsruhe Nano Micro Facility, Hermann-von-Helmholtz-Platz 1, D-76344 Eggenstein-Leopoldshafen, Germany #DFG Center for Functional Nanostructures (CFN), Karlsruhe Institute of Technology, Wolfgang-Gaede-Straße 1a,
76131 Karlsruhe, Germany
∇Steacie Institute for Molecular Sciences, National Research Council of Canada, Ottawa, Ontario, Canada K1A 0R6 ○Institute of Inorganic Chemistry, Karlsruhe Institute of Technology, Engesserstrasse 15, 76131 Karlsruhe, Germany
*
S Supporting InformationABSTRACT: A contemporary question in the intensely active field of periodic mesoporous organosilica (PMO) materials is how large a silsesquioxane precursor can be self-assembled under template direction into the pore walls of an ordered mesostructure. An answer to this question is beginning to emerge with the ability to synthesize dendrimer, buckyball, and polyhedral oligomeric silsesquioxane PMOs. In this paper, we
further expand the library of large-scale silsesquioxane precursors by demonstrating that photoluminescent nanocrystalline silicon that has been surface-capped with oligo(triethoxysilylethylene), denoted as ncSi:(CH2CH2Si(OEt)3)nH, can be self-assembled into a photoluminescent nanocrystalline silicon periodic mesoporous organosilica (ncSi-PMO). A comprehensive multianalytical characterization of the structural and optical properties of ncSi-PMO demonstrates that the material gainfully combines the photoluminescent properties of nanocrystalline silicon with the porous structure of the PMO. This integration of two functional components makes ncSi-PMO a promising multifunctional material for optoelectronic and biomedical applications.
■
INTRODUCTIONSince the first reports on the synthesis of periodically ordered mesoporous silica and aluminosilica through template-directed self-assembly,1−3 the concept of using a sacrificial template to direct the self-assembly has been extended to a rich compositional array of periodic mesoporous materials, which now includes metal oxides,4,5 metal chalcogenides,6,7 metal phosphates,8 metals and semimetals,9−14carbon,15,16and organosilica.17−21In most syntheses, an amphiphilic template drives the separation of mesodomains and organizes small molecular precursors into ordered mesostructures. The ability of an amphiphilic template to organize and the ability of a precursor to diffuse put a practical limit on the size of the precursor for a successful coassembly. It is expected that large precursors are more difficult to assemble than small precursors. However, polymers,22dendrimers,23polyhedral oligomeric silsesquioxane,24C60molecules,
25
and nanoparticles26 have been incorporated into the mesoporous framework through template-directed self-assembly. Although they are mostly the
results of pure scientific curiosity, these synthetic feats have further extended the horizons of mesoporous materials and inspired the design of properties and functions for applying these materials in such areas as sensors, catalysis,27 nanoelec-tronics,28−30light harvesting,31energy storage and conservation,32 water purification,33drug delivery,34and biomedical imaging.35
The use of mesostructured materials in optical applications promises versatile processing strategies forfibers, spheres, films, and lithographic patterns with designed mechanical stability, wettability, and high loading of photoactive species.36,37 Early reports on the incorporation of photoactive species placed dye species in the hydrophobic regions of the micelle templates.36,37 Recent efforts focusing on the synthesis of luminescent forms of periodic mesoporous organosilica (PMO) have aimed at the inclusion of large conjugated structures in the pore walls31in Received: October 10, 2011
Published: April 18, 2012
order to preserve the pore space for further materials designs, such as the loading of another photoactive species to enable light harvesting.38 The chromophores in these luminescent PMOs are conjugated π structures. Compared with these organic chromophores, photoluminescent inorganic nanocryst-als have the advantage of high resistance against photobleaching and tunable size-dependent absorption and emission spectra.39 Nanocrystalline silicon (ncSi) is particularly attractive because of its expected biocompatibility, which makes it one of a growing class of“green” nanomaterials.40The current methods of making photoluminescent ncSi-embedded mesoporous thin films and powders involve the growth of nc-Si in/on the pore walls by either chemical vapor deposition41 or metamorphic transformation of mesoporous hydridosilica (meso-HSO1.5) into mesoporous ncSi/SiO2, with the latter exhibiting stronger photoluminescence (PL).42 Incorporating ncSi into mesopo-rous materials may further hold promise in areas such as lighting, lasers, drug delivery, and bioimaging.
Here we report the synthesis of photoluminescent nano-crystalline silicon periodic mesoporous organosilica (ncSi-PMO) through template-directed self-assembly. The hydride-terminated surface of the ncSi wasfirst capped with triethoxysilylethylene (TESE) oligomers through hydrosilylation with TESE. The capped ncSi was then coassembled with tetraethyl orthosilicate (TEOS) using Pluronic P123 under acidic conditions. We expect this new class of ncSi-PMO materials to show potential in optoelectronic and biomedical applications.
■
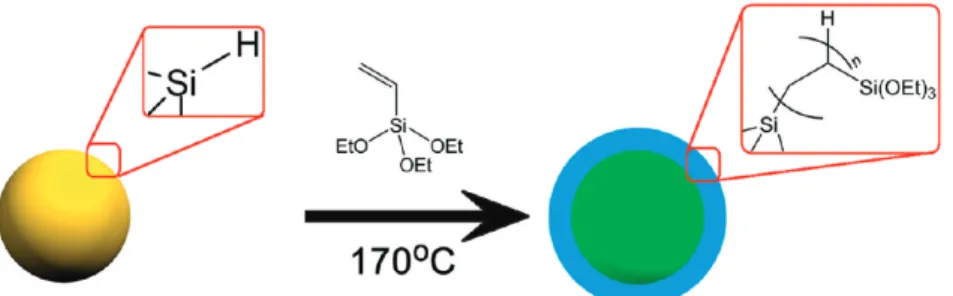
RESULTS AND DISCUSSIONFreestanding silicon nanocrystals synthesized through high-temperature processing of hydridosilicate glass and subsequent HF etching of the ncSi−silica composite possess H-terminated surfaces.43 This H-terminated ncSi is hydrophobic and not soluble in water or ethanol, which are the usual solvents for syntheses of mesostructured materials. To enable self-assembly, the ncSi surface was first capped with oligo(TESE) through thermally initiated hydrosilylation (Figure 1). The oligo(TESE) layer makes the ncSi precursor soluble in ethanol (Figure 2a), and its ethoxysilane groups, after being hydrolyzed and polycondensed, provide bonding that stabilizes the porous gel network. The PL spectrum of the pure ncSi:(CH2CH2 Si-(OEt)3)nH dissolved in ethanol (Figure 2b) displays a peak at 615 nm upon excitation at 330 nm.
The chemical structure of ncSi:(CH2CH2Si(OEt)3)nH was analyzed by FT-IR spectroscopy, UV−vis spectroscopy, liquid-phase NMR spectroscopy, and gel-permeation chromatography (GPC) (Figure 3). The IR spectrum of ncSi:(CH2CH2 Si-(OEt)3)nH (Figure 3a) shows characteristic C−H vibrations at around 2900 and 1390 cm−1, Si−O−C vibrations at around 1100 cm−1, very weak Si−H vibrations at around 2100 cm−1,
and, as anticipated, little evidence for CC vibrations at 1600−1700 cm−1, suggesting almost complete reaction of the surface hydride groups on the ncSi and of the monomeric TESE. The UV−vis absorption spectrum of pure ncSi: (CH2CH2Si(OEt)3)nH (Figure 3b) has a broad absorption in the 200−500 nm region, predominantly originating from the ncSi core. The1H NMR spectrum in CDCl
3(Figure 3c) shows resonances due to the ethoxy groups at 3.79 and 1.20 ppm and resonances due to the oligomer backbone at 0.56 and 1.48 ppm, the latter overlapping with a broad resonance attributed to water (1.59 ppm). The samples contained less than 2% unreacted TESE, as calculated by integrating the vinyl Figure 1.Scheme for the synthesis of nanocrystalline silicon surface-capped with oligo(TESE), denoted as ncSi:(CH2CH2Si(OEt)3)nH, achieved
through thermally initiated hydrosilylation of ncSi:H.
Figure 2. (a) Photos of ncSi:(CH2CH2Si(OEt)3)nH in ethanol
solution displaying photoluminescence under UV light and (b) the corresponding PL spectrum with a peak at 615 nm.
protons (5.6−5.9 ppm). The spectrum appears virtually identical to that of pure oligo(TESE). The additional peak in the high-molecular-weight region (log Mw ≈ 4.5) in the chromatogram of ncSi:(CH2CH2Si(OEt)3)nH (Figure 3d), in comparison with that of pure oligo(TESE), indicates successful grafting of the oligomer onto the surface of ncSi.
The precursor ncSi:(CH2CH2Si(OEt)3)nH was further analyzed using high-resolution transmission electron micros-copy (HRTEM) and energy-filtered TEM (EFTEM).44
EFTEM collects only electrons that have lost a specific amount of energy as a result of the electron−specimen interaction and is advantageous over the other techniques for characterization of Si nanoclusters and nanoparticles.45It generates a chemical map of the species of interest with a very high spatial resolu-tion.46,47 The plasmon loss of ncSi is centered at∼17 eV and that of silicon dioxide at ∼24 eV. This difference allows us clearly to distinguish silicon from silicon dioxide. The plasmon map at 17 eV (Figure 4a) proves the existence of silicon nanoparticles in the precursor. For comparison, the bright-field TEM image (Figure 4a inset) shows a uniform gray background without any appreciable intensity contrast. Other representative nanoparticles showing crystal lattice fringes indicate the ncSi to be ∼2 nm in width and ∼5 nm in length. However, we emphasize here that the sizes of the nanocrystals prepared by high-temperature treatment of hydridosilicate glass are poly-dispersed. Our recent study of monodisperse silicon nano-crystals prepared using the same method and separated using density gradient ultracentrifugation suggests a lack of cry-stallinity for nanoparticles smaller than 2.5 nm.48A comparison of the HF etching time used in our previous report (∼1.5 h) and the time used here (∼2.5 h) suggests that there is an appreciable number of silicon nanoparticles having sizes below 2.5 nm.
The precursor ncSi:(CH2CH2Si(OEt)3)nH was then coas-sembled with TEOS using P123 as the template to form ncSi-PMO (Figure 5). The assembly of pure ncSi:(CH2CH2
Si-(OEt)3)nH without TEOS also gave a mesostructuredfilm, but as expected, it collapsed upon template removal (Figure S1 in the Supporting Information). To minimize any oxidation of Figure 3.Characterization of ncSi:(CH2CH2Si(OEt)3)nH. (a) IR spectrum. (b) UV−vis absorption spectrum. (c) Liquid-phase1H NMR spectra of
pure oligo(TESE) (red) and ncSi:(CH2CH2Si(OEt)3)nH (black). (d) Chromatograms of pure oligo(TESE) (red) and ncSi:(CH2CH2Si(OEt)3)nH
(black).
Figure 4.TEM analysis of ncSi:(CH2CH2Si(OEt)3)nH: (a) plasmon
map (17 eV) and (inset) the corresponding bright-field TEM image; (b) HRTEM micrograph of a silicon nanocrystal in the [110] orientation and (inset) the corresponding Fourier transform; (c) (top) HRTEM micrograph and (bottom) high-resolution plasmon map (17 eV) of the same nanocrystal.
Figure 5.Scheme for the synthesis of ncSi-PMO through coassembly of ncSi:(CH2CH2Si(OEt)3)nH and TEOS using P123 as the template.
ncSi, mild thermal treatments at 85°C under vacuum or under a reductive H2/Ar atmosphere were used to increase the degree of polycondensation in the framework before the template removal. The PL of ncSi was preserved throughout the synthesis and surfactant removal processes. The ncSi-PMO showed visible PL under 400 nm light excitation, with a broad emission peak at 605 nm (Figure 6).
Ordered mesopores were revealed using small-angle X-ray diffraction (XRD) patterns and high-angle annular dark-field scan-ning transmission electron microscopy (HAADF-STEM). The small-angle XRD patterns showed increased signal-to-noise ratios and decreased peak widths after template removal (Figure 7a,b), indicating that the porous structure was preserved upon template removal in the ncSi-PMO films. The d spacings decreased slightly, from 87.4 to 77.4 Å in the spin-coated film and from 76.1 to 66.9 Å in the drop-cast films. The HAADF-STEM images of ncSi-PMO directly confirmed the ordered mesoporous structure (Figure 7c,d). The ordering is anisotropic, with a larger lattice spacing along the direction parallel to the interfaces than along the direction perpendicular to the interfaces.49,50 The quasi-2D hexagonal symmetry (compressed in the direction perpendicular to the substrate) is evident in layers close to the substrate−film and film−air interfaces. The repeat distances obtained from the correspond-ing fast Fourier transform (FFT) are ∼6 nm in the direction parallel to the interfaces and 5−5.5 nm in the direction perpendicular to the interfaces. The images display wormlike disordered mesoporous structures between the ordered regions originating from substrate and air interfaces, with average lattice
parameters of ∼10 nm parallel to the substrate and ∼5.8 nm perpendicular to it. The difference in the d spacings calculated from the small-angle XRD patterns (measured in the Bragg− Brentano geometry, corresponding to the out-of-plane direction) and from the top spot of the FFT of electron microscopy image (also corresponding to the out-of-plane direction) can be attributed to a different degree of anisotropy caused by the additional thermal treatment used to increase the degree of polycondensation in preparing the sample for STEM imaging.51 Furthermore, a slight reduction of the lattice spacings during focused ion beam (FIB) preparation cannot be excluded, but the mesoporous structure was quite stable with respect to the electron beam during TEM and STEM imaging.
Information on the porosity of ncSi-PMO was obtained from nitrogen sorption measurements on powders produced by scratching drop-cast films off their substrates (Figure 8a,b) as well as from ellipsometric porosimetry (EP) measurements on spin-coatedfilms (Figure 8c,d). The nitrogen sorption measure-ments showed type-IV isotherm, with a Brunauer−Emmett− Teller (BET) surface area of 256 m2/g, a total pore volume of 0.35 cm3/g, and a pore size of ∼5.8 nm [as obtained using the Barrett−Joyner−Halenda (BJH) method on the absorption branch]. The surface area and pore volume are both smaller than those of typical periodic mesoporous silica templated by P123.45 This difference is likely due to the thicker pore walls, especially in the disordered region of thefilm due to the presence of ncSi in the pore walls. EP measurements on spin-coated ncSi-PMO showed a total porosity of 39% by volume and a Young’s modulus of 0.57 GPa in the direction perpendicular to the substrate surface (as estimated from thickness profile in Figure 8d). This Young’s modulus value is much lower than those of PMOs made from smaller molecules,30and the difference can be attributed to the low degree of polycondensation as well as the flexibility of the bridging Si−CH2CH2−Si groups in the matrix. The relative amount of ncSi in ncSi-PMO was analyzed by solid-state NMR spectroscopy (SSNMR) (Figure 8). Because of the small amount of ncSi incorporation, together with the long relaxation time of Si atoms in ncSi, a quantitative method for determining the relative amount of ncSi, such as Bloch decay acquisition accompanied by high-power proton decoupling (HPDEC) SSNMR, was unsuitable for the ncSi-PMO films (Figure S2 in the Supporting Information), Thus, we used cross-polarized magic-angle-spinning (CP MAS) SSNMR with con-ditions optimized for Si atoms with no close protons (a direct comparison of the two methods on an ncSi−silica composite before HF etching is given in Figure S3 in the Supporting Information). The samples before and after surfactant removal both showed a small but distinguishable signal from the ncSi at around−79.2 ppm (Figure 9a,b). As a control sample, we also measured the spectrum of an ncSi:(CH2CH2Si(OEt)3)nH gel that was hydrolyzed and polycondensed under the same acidic conditions without P123 and TEOS. This spectrum (Figure 9c) showed only peaks due to T and ncSi sites, indicating no cleavage of C−Si bonds. Semiquantitative analysis showed that 2−3% of the silicon atoms in the ncSi-PMO films are ncSi and that 50−55% of the silicon atoms are at the T sites, with the remaining 42−48% of the silicon atoms at the Q sites (Table 1). These values are consistent with the initial ncSi:(CH2CH2Si(OEt)3)nH and TEOS precursor composition of the films, which provides the ncSi, T, and Q sites, respectively. The oligomeric carbon chains provide additional structural connectivity that increases the loading amount of Si T sites beyond the usual 25% limit.21 Figure 6.(a) Photos of the as-synthesized ncSi-PMO powders under
(left) ambient and (right) UV light and (b) the PL spectrum of ncSi-PMO with a peak at 605 nm.
The Raman spectra provided the most direct evidence for the presence of ncSi in ncSi-PMO. Figure 10 compares the spectrum of the initial ncSi−silica composite before HF etching (the step in which ncSifirst appears) and the spectrum of the ncSi-PMO end product. Both spectra show the transverse optical (TO) mode at∼500 cm−1, indicating that ncSi is preserved throughout the entire synthesis.52,53 The red shift from the typical cry-stalline Si TO mode observed at 520 cm−1is due to the phonon confinement effect in the ncSi.53 The broadening in the full
width at half-maximum is attributed to surface modification by HF etching and TESE capping. For interested readers, we provide additional UV−vis spectra of ncSi-PMO in Figures S4 and S5 in the Supporting Information.
■
CONCLUSIONIn summary, we have successfully incorporated photolumines-cent ncSi into periodic mesoporous organosilica through a creative design of the precursor with an oligomeric capping Figure 7.Evidence of ordered mesoporous ncSi-PMO structures. (a, b) Small-angle XRD patterns of ncSi-PMOfilms deposited by (a) spin-coating and (b) drop-casting. The black and red lines represent patterns before and after surfactant removal, respectively. (c, d) HAADF-STEM analysis of FIB-prepared cross sections of a spin-coated ncSi-PMO thinfilm after template removal; FFT images of the selected regions are shown to the right. A close-packed ordered mesoporous structure is observed close to the substrate−film and film−air interfaces. Between the ordered layers is a region with a disordered mesoporous structure.
ligand, ncSi:(CH2CH2Si(OEt)3)nH, and careful tuning of its template-directed self-assembly conditions. Comprehensive structural and property characterizations indicate that ncSi-PMO
gainfully combines the optical properties of ncSi and the porous structure of PMO. This integration of purposeful components makes ncSi-PMO a promising multifunctional material for optoelectronic and biomedical applications.
■
EXPERIMENTAL SECTIONReagents and Materials. Trichlorosilane (HSiCl3, 99%), TEOS [Si(OC2H5)4, ≥99%], and TESE [C2H3Si(OC2H5)3, 99%] were
purchased from Sigma-Aldrich and used as received. Pluronic P123 surfactant (P123 triblock copolymer) was purchased from BASF Corporation. Decane (C10H22), hydrochloric acid (HCl, 36−38%),
and hydrofluoric acid (HF, 48%) were obtained from Caledon Laboratories Ltd.
Characterization. UV−vis absorption spectra were obtained using either a Cary 100 BIO, PerkinElmer Lamda 900, or Beijing Puxi TU-1810 UV−vis spectrophotometer. PL spectra of surface-functionalized ncSi were obtained on a Varian Caryfluorescence spectrophotometer. Small-angle X-ray scattering (SAXS) patterns were collected on a Nanostar SAXS diffractometer equipped with a high-power point-focus Cu Kα source and low-intensity-background substrates. Small-angle XRD patterns of thin-film samples were acquired on a Siemens D5000 diffractometer using Cu Kα radiation (λ = 1.5418 Å).
SEM images were obtained on Hitachi S5200 microscope operated at 30 kV. TEM images were obtained on an image-corrected FEI Titan 80−300 microscope operated at 300 kV and equipped with a Gatan Tridiem energy filter providing an information limit of 0.08 nm in TEM mode. HAADF-STEM operation was performed with a nominal probe size of 0.19 nm. TEM sample preparation of the ncSi: (CH2CH2Si(OEt)3)nH precursor gel was done by diluting the material
in ethanol and dispersing it on a carbon-coated Au grid (Quantifoil). Cross-section TEM samples of the mesoporous ncSi-PMO were prepared by in situ lift-out in an FEI Strata 400S DualBeam FIB instrument using 30 kV Ga ions for rough cutting and 5 kV Ga ions for fine polishing.
Nitrogen sorption data were collected on a Quantachrome Autosorb-1C instrument. Samples were degassed at 100°C overnight under vacuum before measurements. Raman spectra were collected on LabRam 300 spectrometer equipped with a confocal microscope (100μm slit width and 300 μm pinhole), a 532 nm diode laser source, an electronically cooled CCD camera, and a 1200 groove/mm monochromator. Calibration was done using a crystalline silicon wafer. Figure 8. Porosity information obtained from nitrogen sorption
EP measurements: (a) nitrogen sorption isotherm and (b) the corresponding BJH pore size distribution; (c) EP isotherm and (d) the corresponding thickness profile.
Figure 9.29Si CP MAS SSNMR spectra (spinning speed of 5000 Hz and relaxation delay of 3 s) of (a) ncSi-PMO before template removal, (b) ncSi-PMO after template removal, and (c) a gel of hydrolyzed and polycondensed ncSi:(CH2CH2Si(OEt)3)nH synthesized under the
same conditions as ncSi-PMO but without P123 and TEOS. The signal positions highlighted in red correspond to signals originating from the ncSi core.
Table 1. Integrated Intensities from CP MAS SSNMR Experiments Corrected for Differences in T1ρandTSi−H
signal intensity (mol %)
sample −49 to −50.5 ppm −56 to −58 ppm −64 to −66.5 ppm −77 to −79 ppm −91 to −92 ppm −100 to −101 ppm −108 to −109 ppm
a 4.6 19.2 26.4 2.4 4.9 29.1 13.4
b 8.4 22.8 21.5 2.9 7.2 28.1 9.1
c 7 37.6 52.1 3.3
Figure 10. Raman spectra of (a) ncSi−silica composite before HF etching and (b) ncSi-PMO.
EP measurements were performed using a Sopra GES5E instrument. Liquid-phase NMR spectroscopy was performed on a 400 MHz Varian Mercury NMR spectrometer at 25 °C. Samples were prepared by diluting Si nanocrystals in CDCl3, and the spectra were referenced to
tetramethylsilane (TMS) (0 ppm).
29Si NMR measurements were carried out on a Bruker Avance 200
NMR spectrometer with a magneticfield of 4.7 T and a29Si Larmor
frequency of 39.75 MHz using a BL7 double-resonance MAS probe and 7 mm ZrO2 spinners. All of the NMR measurements were
performed at room temperature at a spinning speed of 5000 Hz. Signal of liquid TMS was used as an external reference (0 ppm). The spectra were acquired both in Bloch decay mode and using CP to protons. The Bloch decay spectra were acquired using a short29Si pulse of 1μs
(π/10) and high-power composite pulse proton decoupling. The delay
between the scans was set at 100 s, which should be sufficient for complete relaxation of all of the signals and quantitative measure-ments, and 2000−3000 scans were commonly acquired. Fitting and deconvolution/integration of the spectra were performed using the DMFit simulation program.54 In quantitative measurements, the absolute intensities of the spectra were normalized to the total number of scans acquired. Since the Bloch decay spectra could not provide a sufficiently high signal-to-noise ratio, quantitative measurements were performed using the data from the CP experiments. The CP spectra were acquired on the same MAS probe using an 1H RF field of
62.5 kHz and a relaxation delay of 3 s. To quantify the CP spectra, the variations of the signal intensities Ii with the CP contact timeτ
(0.1−50 ms) were obtained for all of the samples. The experimental dependencies werefit simultaneously using the equation55
τ = τ τ − − − − ρ ρ ⎡ ⎣ ⎢ ⎢ ⎛ ⎝ ⎜⎜ ⎞⎠⎟⎟ ⎛⎝⎜ ⎞ ⎠ ⎟⎤ ⎦ ⎥ ⎥ I I T T ( ) 4 1 exp exp i i T T 0 1 CH CH 1
and the signal intensities at thermal equilibrium, I0i, together with
relaxation constants T1ρand TCHwere obtained.
Synthetic Procedures. Synthesis of (HSiO1.5)nSol−Gel Glass.
In a typical synthesis, 10 mL of HSiCl3was added to a
round-bottomflask equipped with a magnetic stir bar and cooled in an acetone/dry ice bath (−78 °C). An excess amount of deionized water was rapidly injected into the cooled HSiCl3with vigorous
stirring, and a white precipitate immediately formed. Hydrolysis of the precursor was confirmed by verifying the pH of the reaction mixture (pH <=1). After the reaction, the precipitate was separated by vacuumfiltration, washed with distilled water, and dried under vacuum at 85 °C overnight. The resulting white solid (HSiO1.5)nsol−gel polymer (yield >95%) was kept
under vacuum.
Synthesis of Bulk ncSi/SiO2. Silicon nanocrystals were prepared by
thermally induced disproportionation reactions.43 The white solid (HSiO1.5)nwas placed in a quartz glass reaction boat and transferred to
a high-temperature tube furnace with minimum air exposure. Samples were heated for 1 h at 1100 °C under a flowing 5% H2/95% Ar
atmosphere. After it was cooled to room temperature, the brown ncSi/ SiO2composite was mechanically ground in an agate mortar and pestle
to obtain afine powder.
Synthesis of Hydride-Terminated Freestanding ncSi. A represen-tative etching procedure involved transferring ncSi/SiO2 composite
(0.6 g) to a Teflon beaker containing a mixture of 9 mL of deionized water, 18 mL of ethanol, and 30 mL of 48% aqueous HF. The mixture was stirred for 2.5 h to etch the SiO2matrix and gradually decrease the
size of the ncSi. Hydrophobic, hydride-terminated freestanding silicon nanocrystals were isolated by extraction from the aqueous solution into 30 mL of decane.
Hydrosilylation of ncSi with TESE. Hydride-terminated ncSi in decane was transferred to aflask to which 9 mL of TESE was added. The mixture was kept under N2and degassed three times by repeated
freeze−pump−thaw cycles. Once degassed, the mixture was heated to 170°C overnight with slow stirring. The mixture was then cooled and centrifuged to yield a clear bright-yellow supernatant and a small amount of unreacted precipitate. The supernatant was decanted, and
the solvent and unreacted alkene were removed by vacuum distillation. The resulting oligo(TESE)-terminated ncSi was a viscous liquid that was soluble in ethanol and nonpolar organic solvents such as chloroform.
Synthesis of ncSi-PMO Thin Films. Oligo(TESE)-terminated ncSi (3 g) was diluted with ethanol (7.5 g) to obtain the precursor solution. The surfactant solution were prepared by mixing P123 (5.9 g, 1 mmol), 0.1 M HCl solution (20 g, 2 mmol HCl, 1.1 mol H2O), and ethanol
(92 g, 2 mol). The precursor solution (0.7 g, 0.8 mL), the surfactant solution (5.395 g), and TEOS (0.237 g) were mixed at room temperature and stirred for 3−5 h until a homogeneous clear solution was obtained. This solution was then drop-cast into an open Petri dish and dried to obtain a thickfilm or spin-coated onto silicon wafer to obtain a thinfilm. The as-synthesized samples were then heated under vacuum or a 5% H2/95% Ar atmosphere at 85°C overnight before
surfactant extraction in ethanol/HCl solution (700 mL ethanol and 40 mL concentrated HCl solution).
■
ASSOCIATED CONTENT*
S Supporting InformationSmall-angle XRD patterns of the as-deposited ncSi-PMOfilm, Si SSNMR spectra, and additional UV−vis spectra of ncSi-PMO. This material is available free of charge via the Internet at http://pubs.acs.org.
■
AUTHOR INFORMATIONCorresponding Author
[email protected]; [email protected] Notes
The authors declare no competingfinancial interest.
■
ACKNOWLEDGMENTSG.A.O. is a Government of Canada Research Chair in Materials Chemistry and Nanochemistry. He is deeply indebted to the Natural Sciences and Engineering Council (NSERC) of Canada for strong and sustained support of his research and also thanks the Ministry of Science, Research and the Arts of Baden-Wurttemberg’s International Guest Professorship Program for financial support of this work. This work was partly carried out with the support of the Karlsruhe Nano Micro Facility, a Helmholtz Research Infrastructure at KIT Campus North, and at the Institute of Inorganic Chemisty at KIT Campus South. Ö.D. thanks Bilkent University and the Turkish Academy of Science forfinancial support.
■
REFERENCES(1) Kresge, C. T.; Leonowicz, M. E.; Roth, W. J.; Vartuli, J. C.; Beck, J. S. Nature 1992, 359, 710.
(2) Beck, J. S.; Vartuli, J. C.; Roth, W. J.; Leonowicz, M. E.; Kresge, C. T.; Schmitt, K. D.; Chu, C. T. W.; Olson, D. H.; Sheppard, E. W.; McCullen, S. B.; Higgins, J. B.; Schlenker, J. L. J. Am. Chem. Soc. 1992, 114, 10834.
(3) Yanagisawa, T. S.; Kuroda, K.; Kato, C. Bull. Chem. Soc. Jpn. 1990, 63, 988.
(4) Huo, Q.; Margolese, D. I.; Ciesla, U.; Feng, P.; Gier, T. E.; Sieger, P.; Leon, R.; Petroff, P. M.; Schuth, F.; Stucky, G. D. Nature 1994, 368, 317.
(5) Yang, P.; Zhao, D.; Margolese, D. I.; Chmelka, B. F.; Stucky, G. D. Nature 1998, 396, 152.
(6) MacLachlan, M. J.; Coombs, N.; Ozin, G. A. Nature 1999, 397, 681.
(7) Kanatzidis, M. G. Adv. Mater. 2007, 19, 1165. (8) Tieman, M.; Fröba, M. Chem. Mater. 2001, 13, 3211.
(9) Attard, G. S.; Bartlett, P. N.; Coleman, N. R. B.; Elliott, J. M.; Owen, J. R.; Wang, J. H. Science 1997, 278, 838.
(10) Lee, K.; Kim, Y. H.; Han, S. B.; Kang, H.; Park, S.; Seo, W. S.; Park, J. T.; Kim, B.; Chang, S. J. Am. Chem. Soc. 2003, 125, 6844.
(11) Richman, E. K.; Kang, C. B.; Brezesinski, T.; Tolbert, S. H. Nano Lett. 2008, 8, 3075.
(12) Armatas, G. S.; Kanatzidis, M. G. Nature 2006, 441, 1122. (13) Sun, D.; Riley, A. E.; Cadby, A. J.; Richman, E. K.; Korlann, S. D.; Tolbert, S. H. Nature 2006, 441, 1126.
(14) Armatas, G. S.; Kanatzidis, M. G. Science 2006, 313, 817. (15) Ryoo, R.; Joo, S. H.; Jun, S. J. Phys. Chem. B 1999, 103, 7745. (16) Lee, J.; Kim, J.; Hyeon, T. Adv. Mater. 2006, 18, 2073. (17) Inagaki, S.; Guan, S.; Fukushima, Y.; Ohsuna, T.; Terasaki, O. J. Am. Chem. Soc. 1999, 121, 9611.
(18) Asefa, T.; MacLachlan, M. J.; Coombs, N.; Ozin, G. A. Nature 1999, 402, 867.
(19) Melde, B. J.; Holland, B. T.; Blanford, C. F.; Stein, A. Chem. Mater. 1999, 11, 3302.
(20) Hoffmann, F.; Cornelius, M.; Morell, J.; Froba, M. Angew. Chem., Int. Ed. 2006, 45, 3216.
(21) Wang, W.; Lofgreen, J. E.; Ozin, G. A. Small 2010, 6, 2634. (22) Kang, Y.-S.; Lee, H. I.; Zhang, Y.; Han, Y. J.; Yie, J. E.; Stucky, G. D.; Kim, J. M. Chem. Commun. 2004, 1524.
(23) Landskron, K.; Ozin, G. A. Science 2004, 306, 1529.
(24) Zhang, L.; Abbenhuis, H. C. L.; Yang, Q.; Wang, Y. M.; Magusin, P. C. M. M.; Mezari, B.; Van Santen, R. A.; Li, C. Angew. Chem., Int. Ed. 2007, 46, 5003.
(25) Whitnall, W.; Cademartiri, L.; Ozin, G. A. J. Am. Chem. Soc. 2007, 129, 15644.
(26) Warren, S. C.; Messina, L. C.; Slaughter, L. S.; Kamperman, M.; Zhou, Q.; Gruner, S. M.; DiSalvo, F. J.; Wiesner, U. Science 2008, 320, 1748.
(27) Yang, Q.; Liu, J.; Zhang, L.; Li, C. J. Mater. Chem. 2009, 19, 1945.
(28) Hatton, B. D.; Landskron, K.; Whitnall, W.; Perovic, D. D.; Ozin, G. A. Adv. Funct. Mater. 2005, 15, 823.
(29) Wang, W. D.; Grozea, D.; Kim, A.; Perovic, D. D.; Ozin, G. A. Adv. Mater. 2010, 22, 99.
(30) Wang, W.; Grozea, D.; Kohli, S.; Perovic, D. D.; Ozin, G. A. ACS Nano 2011, 5, 1267.
(31) Tani, T.; Mizoshita, N.; Inagaki, S. J. Mater. Chem. 2009, 19, 4451.
(32) Orilall, M. C.; Wiesner, U. Chem. Soc. Rev. 2011, 40, 520. (33) Zhang, Y.; Xu, S.; Luo, Y.; Pan, S.; Ding, H.; Li, G. J. Mater. Chem. 2011, 21, 3664.
(34) Vivero-Escoto, J. L.; Slowing, I. I.; Lin, V. S. Y.; Trewyn, B. G. Small 2010, 6, 1952.
(35) Kim, T.; Momin, E.; Choi, J.; Yuan, K.; Zaidi, H.; Kim, J.; Park, M.; Lee, N.; McMahon, M. T.; Quinones-Hinojosa, A.; Bulte, J. W. M.; Hyeon, T.; Gilad, A. A. J. Am. Chem. Soc. 2011, 133, 2955.
(36) Yang, P.; Wirnsberger, G.; Huang, H. C.; Cordero, S. R.; McGehee, M. D.; Scott, B.; Deng, T.; Whitesides, G. M.; Chmelka, B. F.; Buratto, S. K.; Stucky, G. D. Science 2000, 287, 465.
(37) Scott, B. J.; Wirnsberger, G.; Stucky, G. D. Chem. Mater. 2001, 13, 3140.
(38) Inagaki, S.; Ohtani, O.; Goto, Y.; Okamoto, K.; Ikai, M.; Yamanaka, K.-i.; Tani, T.; Okada, T. Angew. Chem., Int. Ed. 2009, 48, 4042.
(39) Fan, J.; Chu, P. K. Small 2010, 6, 2080.
(40) Kelly, J. A.; Henderson, E. J.; Veinot, J. G. C. Chem. Commun. 2010, 46, 8704.
(41) Dag, Ö.; Ozin, G. A.; Yang, H.; Reber, C.; Bussiere, G. Adv. Mater. 1999, 11, 474.
(42) Xie, Z.; Henderson, E. J.; Dag, Ö.; Wang, W.; Lofgreen, J. E.; Kübel, C.; Scherer, T.; Brodersen, P. M.; Gu, Z.-Z.; Ozin, G. A. J. Am. Chem. Soc. 2011, 133, 5094.
(43) Hessel, C. M.; Henderson, E. J.; Veinot, J. G. C. Chem. Mater. 2006, 18, 6139.
(44) Schaffer, B.; Grogger, W.; Hofer, F. Micron 2003, 34, 1. (45) Iacona, F.; Franzo, G.; Irrera, A.; Boninelli, S.; Miritello, M.; Priolo, F. In Silicon Nanophotonics: Basic Principles, Present Status and Perspectives; Khriachtchev, L., Ed.; Pan Stanford Publishing: Singapore, 2008.
(46) Boninelli, S.; Iacona, F.; Franzò, G.; Bongiorno, C.; Spinella, C.; Priolo, F. J. Phys.: Condens. Matter 2007, 19, No. 225003.
(47) Iacona, F.; Bongiorno, C.; Spinella, C.; Boninelli, S.; Priolo, F. J. Appl. Phys. 2004, 95, 3723.
(48) Mastronardi, M. L.; Hennrich, F.; Henderson, E. J.; Maier-Flaig, F.; Blum, C.; Reichenbach, J.; Lemmer, U.; Kübel, C.; Wang, D.; Kappes, M. M.; Ozin, G. A. J. Am. Chem. Soc. 2011, 133, 11928.
(49) Yang, H.; Coombs, N.; Sokolov, I.; Ozin, G. A. Nature 1996, 381, 589.
(50) Yang, H.; Kuperman, A.; Coombs, N.; Mamiche-Afara, S.; Ozin, G. A. Nature 1996, 379, 703.
(51) Klotz, M.; Albouy, P. A.; Ayral, A.; Menager, C.; Grosso, D.; Van der Lee, A.; Cabuil, V.; Babonneau, F.; Guizard, C. Chem. Mater. 2000, 12, 1721.
(52) Hessel, C. M.; Henderson, E. J.; Veinot, J. G. C. J. Phys. Chem. C 2007, 111, 6956.
(53) Viera, G.; Huet, S.; Boufendi, L. J. Appl. Phys. 2001, 90, 4175. (54) Massiot, D.; Fayon, F.; Capron, M.; King, I.; Le Calvé, S.; Alonso, B.; Durand, J.-O.; Bujoli, B.; Gan, Z.; Hoatson, G. Magn. Reson. Chem. 2002, 40, 70.
(55) Mehring, M. Principles of High-Resolution NMR in Solids, 2nd revised and enlarged ed.; Springer-Verlag: Berlin, 1983.