PROCEEDINGS OF SPIE
SPIEDigitalLibrary.org/conference-proceedings-of-spie
Polymer-ceramic nanocomposites
Önder Pekcan, Şaziye Uğur
Önder Pekcan, Şaziye Uğur, "Polymer-ceramic nanocomposites," Proc. SPIE
7366, Photonic Materials, Devices, and Applications III, 736609 (20 May
2009); doi: 10.1117/12.821747
Event: SPIE Europe Microtechnologies for the New Millennium, 2009,
Dresden, Germany
Polymer-Ceramic Nanocomposites
Önder Pekcan
1*
and Şaziye Uğur
21
Kadir Has University, Cibali, 34230, Istanbul, Turkey
2
Istanbul Technical University, Department of Physics, 34469 Maslak, Istanbul, Turkey
ABSTRACT
Steady state fluorescence (SSF) and photon transmission (PT) techniques were used for studying film formation from TiO2 and Al2O3 covered polystyrene (PS) latex particles. These films were annealed at elevated temperatures in 10 min time intervals above glass transition (Tg) temperature of polystyrene. Fluorescence emission, IP and transmitted photon, Itr intensities were measured after each annealing step to monitor the stages of film formation. Films present dramatic increase in both Itr and IP above the certain onset temperature called minimum film forming temperature, T0. Dissolution of annealed PS film, with high TiO2 content presented a nice, ordered nano-sized ceramic structure, which may predict the construction of nano-layer photonic crystals. It was observed that latex particles are encapsulated above a critical Al2O3 content of 33 wt% which corresponds to the critical occupation probability of pc=0.33 at which the film obey the
site-percolation model with a critical exponent of 0.45.
Keywords:latex, ceramic, void closure, percolation, photonic crystals.
1. INTRODUCTION
There has been growing interest on producing new materials by filling polymers with inorganic natural and/or synthetic compounds. These composite materials posses’ high heat resistance, mechanical strength and impact resistance or present weak electrical conductivity and low permeability for gases like oxygen or water vapor. Since the inorganic particles display rather macroscopic dimensions and since there is mostly no interaction between the two mixed components at the interface between the two partners, the resulting composite materials can be seen as filled polymers. In general processing and structural development studies are coupled with investigations of coating properties including optical, electrical and mechanical properties1-3. Some efforts have been made to construct microstructure and properties of coatings with composite ceramic-polymer microstructures, where the emphasis in composites in which a ceramic phase forms a connected network in a polymer matrix. Processing and microstructure development of ceramic and polymer coating prepared by depositing a solution or dispersion have been of interest in last few years4,5. Colloidal ceramics, sol-gel derived ceramics and polymers have been studied as coating systems.
In general film formation from soft and hard polymer latex dispersions can occur in several stages. In both cases, the first stage correspond the wet initial stage. Evaporation of solvent leads to second stage in which the particles form a close packed array, here if the particles are soft they are deformed to polyhedrons. Hard latex however stays undeformed at this stage. Annealing of soft particles causes diffusion across particle-particle boundaries which lead the film to form a homogeneous continuous material. In the annealing of hard latex system, however, deformation of particles first leads to void closure6,7 and then after the voids disappear diffusion across particle-particle boundaries starts, i. e. the mechanical properties of hard latex films evolve during annealing; after all solvent has evaporated and all voids have disappeared. The steady state fluorescence technique has been used to examine healing and interdiffusion processes in the dye labeled polymethylmethacrylate (PMMA) latex systems8,9. Photon transmission technique was also employed to study film formation from PMMA and polystyrene (PS) particles10,11 where the transmitted light intensity, I
tr was monitored during film formation process.
In this work, the evolution of film formation from composites prepared with TiO2 and Al2O3 by using surfactant-free polystyrene (PS) latex, were studied. These films were prepared by annealing composites above the glass transition
*[email protected]; phone +90 212 533 65 32 / 1702
Invited Paper
Photonic Materials, Devices, and Applications III, edited by Ali Serpengüzel, Gonçal Badenes, Giancarlo C. Righini, Proc. of SPIE Vol. 7366, 736609 · © 2009 SPIE · CCC code: 0277-786X/09/$18 · doi: 10.1117/12.821747
Proc. of SPIE Vol. 7366 736609-1
Downloaded From: https://www.spiedigitallibrary.org/conference-proceedings-of-spie on 02 Dec 2019 Terms of Use: https://www.spiedigitallibrary.org/terms-of-use
temperature of PS for 10 min intervals at temperatures ranging from 100 to 280 0C. Fluorescence emission, I P and transmitted photon intensity, Itr were monitored to study the evolution of film formation. It was observed that Itr increased dramatically above a certain onset temperature, T0 called minimum film formation temperature for the samples contained more than 67 wt% latex. Films with low latex content (less than 67 wt %) show no variation in Itr upon annealing i. e. microstructure of these films present no change after annealing process has completed. Fluorescence emission intensity, IP, also increased dramatically above T0 and decreased at higher temperatures.
2. EXPERIMENTAL
2.1 PS Latex
Pyrene labeled polystyrene particles were produced via surfactant free emulsion polymerization process. The polymerization was carried out in a four-neck glass reactor equipped with a glass paddle type agitation, condenser and nitrogen inlet. The agitation rate was 300 RPM and the polymerization temperature was controlled at 70°C. Water (100 ml) and styrene (5 g) were first mixed in the polymerization reactor and when the temperature was constant (at 70°C), Potassium Peroxodisulfate (KPS) initiator (0.2g) dissolved in small amount of water (2ml) was introduced in order to induce styrene polymerization. The polymerization was conduced during 18 hours.
2.2 TiO2 Films
Five different films were prepared from the dispersion of PS particles in water by placing the same number of drops on a glass plates with the size of 2.5x0.8 cm2 and allowing the water to evaporate. After drying, these films were dipped separately into TiO2 solution in Ethanol. Films were dried after each covering process at 100 0C and then the consecutive dipping was performed. Five different films were produced with 0, 1, 2, 3, 4 and 5 layers of TiO2. The produced films were separately annealed above Tg of PS, 105 0C, in 10 min at temperatures ranging from 100 to 250 0C. The temperature was maintained within ±2 0C during annealing.
2.3 Fluorescence Measurements
After annealing, each sample was placed in the solid surface accessory of a Perkin-Elmer Model LS-50 fluorescence spectrometer. Pyrene (P) was excited at 345 nm and fluorescence emission spectra were detected between 300-500 nm. All measurements were carried out in the front-face position at room temperature. Slit widths were kept at 8 nm during all SSF measurements. Atomic Force Microscopy (AFM) images were obtained by SPM-9500-J3 Shimadzu scanning probe microscopy.
2.4 Al2O3 Films
Nine different films with 27, 37, 47, 57, 67, 78, 87, 89 and 100 wt% latex contents were prepared from the dispersion of PS/Al2O3 mixtures by placing the same number of drops on a glass plates with the size of 1.0x1.0 cm2 and allowing the water to evaporate. The PS/Al2O3 dispersion was stirred over night to be sure that complete mixing was achieved. Then samples were separately annealed above Tg of PS (105 0C) for 10 min at temperatures ranging from 100 to 300 0C. The temperature was maintained within ±2 0C during annealing.
2.5 Photon transmission Measurements
Photon transmission experiments were carried out using model DU 530 Life Science UV-Visible (UVV) spectrometer from Beckman. The transmittances of the films were detected between 300 and 400 nm. A glass plate was used as a standard for all UVV experiments and measurements were carried out at room temperature after each annealing processes.
3. RESULTS AND DISCUSSION
3.1 TiO2 films
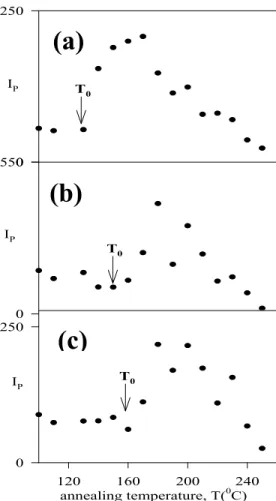
Fluorescence intensity, IP from all TiO2 composite films first increased then decreased by increasing annealing temperature. It is seen in Figs. 1a, b and c that IP intensities from the films prepared with 1, 3 and 5 layer of TiO2 content
Proc. of SPIE Vol. 7366 736609-2
Downloaded From: https://www.spiedigitallibrary.org/conference-proceedings-of-spie on 02 Dec 2019 Terms of Use: https://www.spiedigitallibrary.org/terms-of-use
all behave similarly during the annealing process The increase and decrease of IP upon annealing of the composite films can be explained with the void closure and interdiffusion processes, respectively. Here, in Figs. 1a, b and c it should be noticed that T0 moves to the higher temperature region as the TiO2 layer is increased in the composite film, indicating that the film formation process has delayed during annealing due to the presence of TiO2 layers.
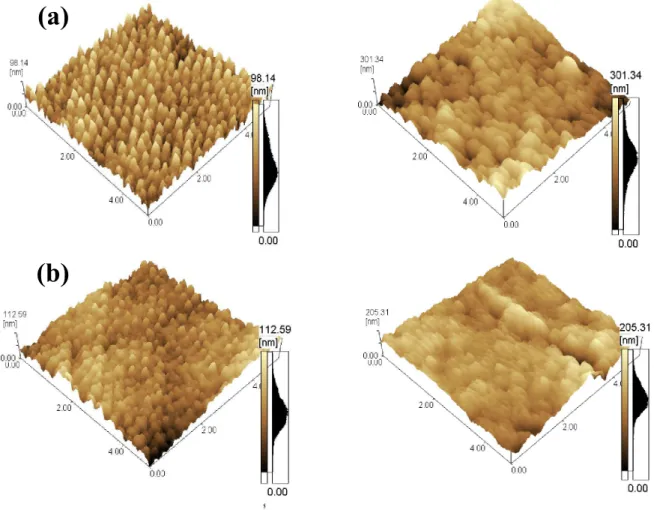
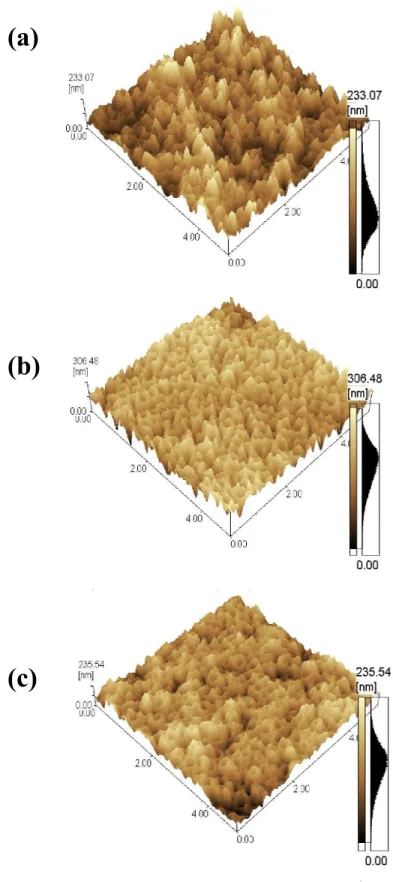
AFM images given in Figs. 2a and b before and after annealing of the composite films with 3 and 5 layers of TiO2, respectively confirm the above picture. In other words all samples present complete film formation after annealing. In order to understand the details of film formation from these composites, films were dissolved in toluene. AFM images of the films with 1, 3 and 5 layers of TiO2 are shown in Figs. 3a, b and c after dissolution. The holes in Fig. 3c present the places, previously occupied by PS latex before dissolution. Some holes are also seen in Figs. 3a and b, but not very clearly. The coverage of the latexes by TiO2 has not been enough for the films in Figs. 3a and b. In other words, latexes in Fig. 3c are perfectly covered by enough amount of TiO2 (5 layers) which results better picture of hole images.
3.2 Voids Closure
In order to quantify the behavior of IP in Figs. 1a, b and c below its maxima (at low temperature region), phenomenological void closure model can be introduced. Latex deformation and void closure between particles can be induced by shearing stress which is generated by surface tension of polymer i. e. polymer-air interfacial tension. The void closure kinetics can determine the time for optical transparency and latex film formation12. In order to relate the shrinkage of spherical void of radius, r to the viscosity of surrounding medium, η an expression was derived and given by the following relation12.
Fig 2 IP 0 250 IP 0 550 120 160 200 240 IP 0 250 T0 T0 annealing temperature, T(0C) T0
(a)
(c)
(b)
Fig 1. Plot of fluorescence intensities, IP versus annealing temperature, T for the composite films.
Proc. of SPIE Vol. 7366 736609-3
Downloaded From: https://www.spiedigitallibrary.org/conference-proceedings-of-spie on 02 Dec 2019 Terms of Use: https://www.spiedigitallibrary.org/terms-of-use
⎟⎟
⎠
⎞
⎜⎜
⎝
⎛
−
=
)
(
1
2
r
dt
dr
ρ
η
γ
(1) where γ is the surface energy, t is time and ρ(r) is the relative density. It has to be noted that here the surface energy causes a decrease in void size and the term ρ(r) varies with the microstructural characteristics of the material, such as thenumber of voids, the initial particle size and packing. If the viscosity is constant in time, integration of Eq. 1 gives the relation as
∫
−
=
r roρ(r)dr
)
kT
ΔH
(
γ
A
t
2
exp
(2) where ΔH is the activation energy of viscous flow i.e. the amount of heat which must be given to one mole of material for creating the act of a jump during viscous flow. Here A represents a constant for the related parameters which do not depend on temperature.(a)
Fig 2. AFM images of composite films with a-3 and b-5 layers of TiO2 before annealing and after annealed at 250 0C.
(b)
Proc. of SPIE Vol. 7366 736609-4
Downloaded From: https://www.spiedigitallibrary.org/conference-proceedings-of-spie on 02 Dec 2019 Terms of Use: https://www.spiedigitallibrary.org/terms-of-use
(a)
(b)
(c)
Fig 3. AFM images of the films with a- 1, b- 3 and c- 5 layers of TiO2 after dissolution.
Proc. of SPIE Vol. 7366 736609-5
Downloaded From: https://www.spiedigitallibrary.org/conference-proceedings-of-spie on 02 Dec 2019 Terms of Use: https://www.spiedigitallibrary.org/terms-of-use
In order to quantify the above results, Eq. 2 can be employed by assuming that the interparticle voids are in equal size and number of voids stay constant during film formation (i.e.
ρ( )
r
∝
r
−3), then integration of Eq. 2 gives the relation)
r
r
)(
kT
ΔH
(
γ
AC
t
o2 21
1
exp
2
−
=
(3) As we stated before, decrease in void size (r) causes an increase in IP. If the assumption is made that IP is inversely proportional to the 6th power of void radius, r then Eq. 3 can be written as)
T
k
ΔH
(
S(t)
T
I
B P3
exp
)
(
=
−
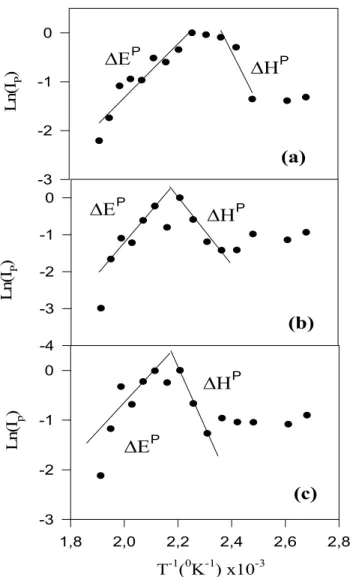
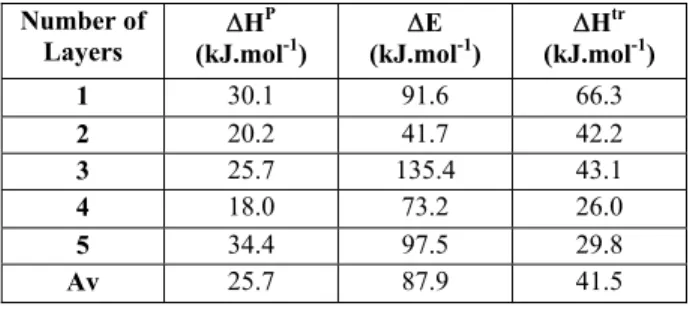
(4) where S(t)=(γt/2AC)3. and C is a constant related to relative density ρ(r).As it was already argued above that, the increase in IP originate due to the void closure process, then Eq. 4 was applied to IP below its maxima for all film samples. Fig. 4 present the Ln (IP) versus T-1 plots from which ΔHP activation energies were obtained and are listed in Table I. It is seen that activation energies do not change much by increasing the TiO2 content i.e. the amount of heat which was required by one mole of polymeric material to accomplish a jump during viscous flow do not change by varying the TiO2 layers in the latex films.
3.3 Healing and Interdiffusion
As the annealing temperature is increased some part of the polymer chains might cross the junction surface and particle boundaries disappear, as a result IP decreases due to transparency of the film. In order to quantify these results, the Prager-Tirrell (PT) model13,14 for the chain crossing density can be employed. The total "crossing density" σ(t) (chains per unit area) at junction surface then was calculated from the contributions σ1(t) due to chains still retaining some portion of their initial tubes, plus a remainder σ2(t) i. e. contribution comes from chains which have relaxed at least once. In terms of reduced time
τ
=
2
ν
t
/
N
2 the total crossing density can be written as132 / 1 2 / 1
2
)
(
/
)
(
τ
σ
π
τ
σ
∞
=
− (5) where ν and N are the diffusion coefficient and number of freely jointed segment of polymer chain13.In order to compare our results with the crossing density of the PT model, the temperature dependence of
σ τ σ
( ) / ( )
∞
can be modeled by taking into account the following Arrhenius relation for the linear diffusion coefficient, which gives the following useful relation as)
2
/
exp(
)
(
/
)
(
τ
σ
∞
=
R
o−
Δ
E
kT
σ
(6) Here ΔE is defined as the activation energy for backbone motion depending on the temperature interval and2 / 1 2) / 8 ( t N
Ro = νo π is a temperature independent coefficient. The decrease in IP in Fig. 1 above maximum is already
related to the disappearance of particle-particle interface. As annealing temperature increased, more chains relaxed across the junction surface and as a result the crossing density increases. Now, it can be assumed that IP is inversely proportional to the crossing density σ(T) and then the phenomenological equation can be written as
)
2
/
exp(
)
(
1 0E
k
T
R
I
P∞
=
−Δ
B (7)Proc. of SPIE Vol. 7366 736609-6
Downloaded From: https://www.spiedigitallibrary.org/conference-proceedings-of-spie on 02 Dec 2019 Terms of Use: https://www.spiedigitallibrary.org/terms-of-use
Logarithmic plots of IP vs. T-1 are presented in Figs. 4a, b and c for the films contain 1, 3 and 5 layers of TiO2, respectively. The activation energy of backbone motion, ΔE is produced by fitting the data in Fig. 4 to Eq. 7 and is listed in Table I. The averaged value for ΔE is found to be 87.9 kj.mol-1, which is much larger than the void closure activation energies. This result is understandable because a single chain needs more energy to execute diffusion across the polymer-polymer interface than to be accomplished by the viscous flow process.
In summary this part of the work has shown that when the PS latex film is covered by TiO2, a replica-layer of ceramic structure can be produced after dissolving the polymeric material from the system. It has understood that latex film formation process can be developed independent of TiO2 content. It has been shown that higher TiO2 content produced a quite ordered ceramic structure by presenting a replica of the PS particles. Here one may predict that higher TiO2 layers can be used to produce a mono-layer, nano-sized photonic crystal.
Ln (I P ) -3 -2 -1 0 -4 -3 -2 -1 0 Ln (I P )
ΔΗ
PΔΕ
P 1,8 2,0 2,2 2,4 2,6 2,8 Ln (Ip ) -3 -2 -1 0ΔΗ
PΔΕ
PΔΗ
PΔΕ
P T-1(0K-1) x10-3Fig 10
(a)
(b)
(c)
Fig 4. The Ln(IP) versus T-1 plots of the data in Fig. 2 for the composite contains a- 1, b-3 and c-5 layers of TiO2. The slope of the straight lines on right and left hand side of the graph produce ΔHP and ΔE activation energies, respectively.
Proc. of SPIE Vol. 7366 736609-7
Downloaded From: https://www.spiedigitallibrary.org/conference-proceedings-of-spie on 02 Dec 2019 Terms of Use: https://www.spiedigitallibrary.org/terms-of-use
Table I. Experimentally produced activation energies: ΔHtr (activation energy of viscous flow, measured from I tr), ΔHP (activation energy of viscous flow, measured from IP), ΔE (activation energy of backbone motion, measured from IP).
3.4 Al2 O3 films
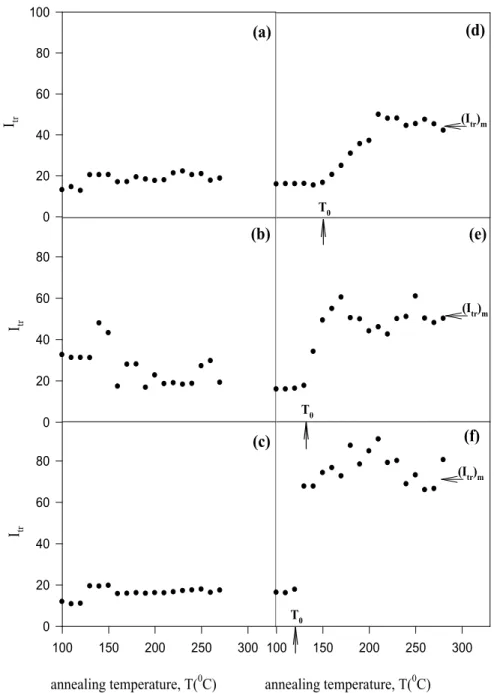
Transmitted photon intensities from the films annealed at elevated temperatures are plotted in Figs. 5a, b, c, d, e and f for the composites contain 37, 47, 57, 67, 89 and 100 wt% PS latex, respectively. It is seen in Figs. 5a, b and c that, Itr present no variation in its intensity by predicting that microstructure of these composite films shows almost no change. However annealing of the films prepared with 67, 89 and 100 wt% latex content, show a dramatic increase above the minimum film formation temperature, T0. In fact T0 moves slightly to the low temperature region by indicating, early film formation process takes place as PS content increased in these composites. Since higher Itr corresponds to higher clarity of the composite, increase in Itr predicts that microstructure of these films change considerably by annealing them above T0 i. e. the transparency of these film evolve upon annealing. Polystyrene starts to flow due to annealing and voids between particles can be filled due to the viscous flow. However composites prepared with 37, 47 and 57 wt% latex do not show this behavior i. e. no viscous flow takes part and the voids can not be filled in these films upon annealing. Most probably encapsulated latex particles can not be destroyed upon annealing. It is also seen in Figs. 5d, e and f that the maxima of Itr, (Itr)m increase by increasing latex content in the composites and reaches its highest value in pure latex film.
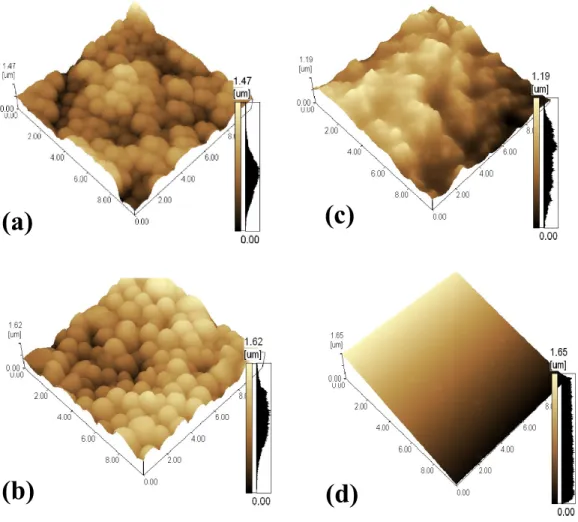
Figs. 6a, b and c, d compare the composite films prepared with 67 and 89 wt% latex, before and after annealed at 280 0C. It is seen that considerable change is occurred by annealing the 67 wt% latex content film at 280 0C (see Figs. a and b) i. e. the microstructure of the composite film is changed and the particle-particle interfaces are beginning to disappear upon annealing. Figs. 6b and d compare the AFM micrographs of 89 wt% latex content films before and after annealing where it is seen that particle-particle boundaries are completely disappeared after annealing process is completed. From here, both Itr and AFM data suggest that, 67 wt% latex content presents a critical percentage, below which composite films are in encapsulated form and the replica of the particles can not be destroyed upon annealing even at 280 0C temperature.
In order to quantify the findings, presented in Figs. 5d, e and f, percolation model can be applied. Extensive simulations and theoretical work have shown that the percolation probability vanishes as a power-law near pc:
β
)
(
)
p
(
p
p
cp
∞≈
−
(8) for p>pc, and p→pc. In a simple cubic lattice pc is found to be 0.31 for site-percolation and 0.249 for bond percolationmodels15. The exponent β for a simple cubic lattice is 0.45.
Two types of treatment can be done for the equation 8, at first it is assumed that |p-pc|β can be taken proportional to
|T-T0|β and then Eq. 1 becomes
β
)
(
)
(
0T
T
T
I
tr tr≈
−
(9) Number of Layers ΔH P(kJ.mol-1) (kJ.molΔE -1) ΔH tr (kJ.mol-1) 1 30.1 91.6 66.3 2 20.2 41.7 42.2 3 25.7 135.4 43.1 4 18.0 73.2 26.0 5 34.4 97.5 29.8 Av 25.7 87.9 41.5
Proc. of SPIE Vol. 7366 736609-8
Downloaded From: https://www.spiedigitallibrary.org/conference-proceedings-of-spie on 02 Dec 2019 Terms of Use: https://www.spiedigitallibrary.org/terms-of-use
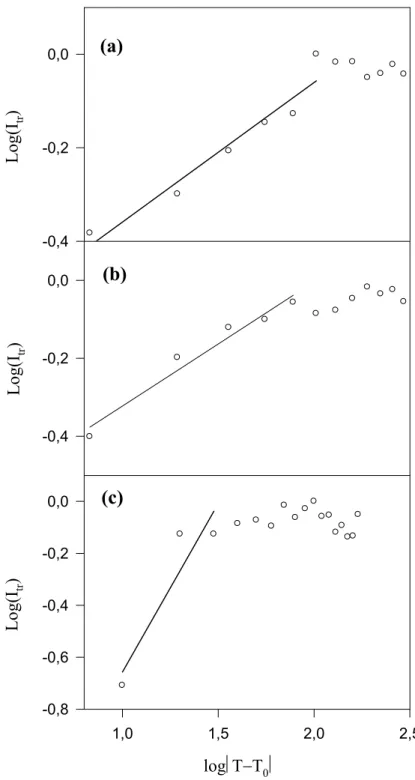
where P∞(p) is considered to be proportional to the transmitted light intensity, Itr16. logItr-log|T-T0| plots are presented in Figs. 7a, b and c for the composites prepared with a- 67, b-89 and c- 100 wt% PS latex. The slopes of the linear relation produce the critical exponent β for the composite film formation process. It is interesting to note that the produced β
Fig 2
Itr 0 20 40 60 80 100 Itr 0 20 40 60 80 annealing temperature, T(0C) 100 150 200 250 300 Itr 0 20 40 60 80 annealing temperature, T(0C) 100 150 200 250 300 T0 T0 T0(a)
(b)
(c)
(d)
(e)
(f)
(Itr)m (Itr)m (Itr)mFig 5. Plot of transmitted photon intensities, Itr versus annealing temperatures, T from the composite film containing a- 37, b- 47, c- 57, d- 67, e- 89 and f- 100 wt% PS latex.
Proc. of SPIE Vol. 7366 736609-9
Downloaded From: https://www.spiedigitallibrary.org/conference-proceedings-of-spie on 02 Dec 2019 Terms of Use: https://www.spiedigitallibrary.org/terms-of-use
value corresponds to the β (=0.45) value of a simple cubic lattice for the film contain 67 wt% PS. For the second treatment we define the following ratio
PS O Al O Al m m m R + = 3 2 3 2 (10) where 3 2O Al
m
and PSm
present the weight of Al2O3 and PS in the composite film. If R is assumed to be the occupation probability, p of Al2O3 in the whole lattice then the percolation threshold, pc becomes Rc and if once again P∞(p) is considered to be proportional to the transmitted light intensity, Itr then Eq. 8 can be written as17β
)
(
)
(
c trR
R
R
I
tr≈
−
(11) Eq. 4 describes the percolation model for Al2O3 distribution in PS matrix. When R reaches Rc, the largest cluster of Al2O3 appears by connecting the left and right edges to the bottom edge of the PS matrix. It is seen in Table II that R with 33 and 22 posses β with 0.45 and 0.48 values . These R values are equivalent to the pc for site-percolation and(a)
(c)
(b)
(d)
Fig 6. AFM images of composite films prepared with a- 67 and b- 89 wt% of PS latex before and after annealed at
280 0C (c and d).
Proc. of SPIE Vol. 7366 736609-10
Downloaded From: https://www.spiedigitallibrary.org/conference-proceedings-of-spie on 02 Dec 2019 Terms of Use: https://www.spiedigitallibrary.org/terms-of-use
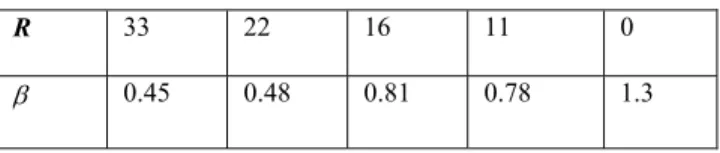
bond-percolation models in simple cubic lattice where β values are also satisfied. From here one may conclude that the composite films with 67 and 78 wt% PS content obey percolation model, i. e. Al2O3 percolate in the composite film during annealing above T0. Composite films above pc (R=33) present Al2O3 encapsulated replica of latexes. However, composite films below pc (R=22) show latex film formation behaviors with a little effect of Al2O3.
Fig 5
Lo
g(I
tr)
-0,4 -0,2 0,0Log(I
tr)
-0,4 -0,2 0,0log⎜Τ−Τ
0⎜
1,0 1,5 2,0 2,5Log(I
tr)
-0,8 -0,6 -0,4 -0,2 0,0(b)
(a)
(c)
Fig 7. logItr versus log(⏐T-T0⏐) plots of composite films prepared with a- 67, b- 89, c- 100 wt% PS latex content.
Proc. of SPIE Vol. 7366 736609-11
Downloaded From: https://www.spiedigitallibrary.org/conference-proceedings-of-spie on 02 Dec 2019 Terms of Use: https://www.spiedigitallibrary.org/terms-of-use
Table II. The β values observed from transmitted light (Itr)
R 33 22 16 11 0
β 0.45 0.48 0.81 0.78 1.3
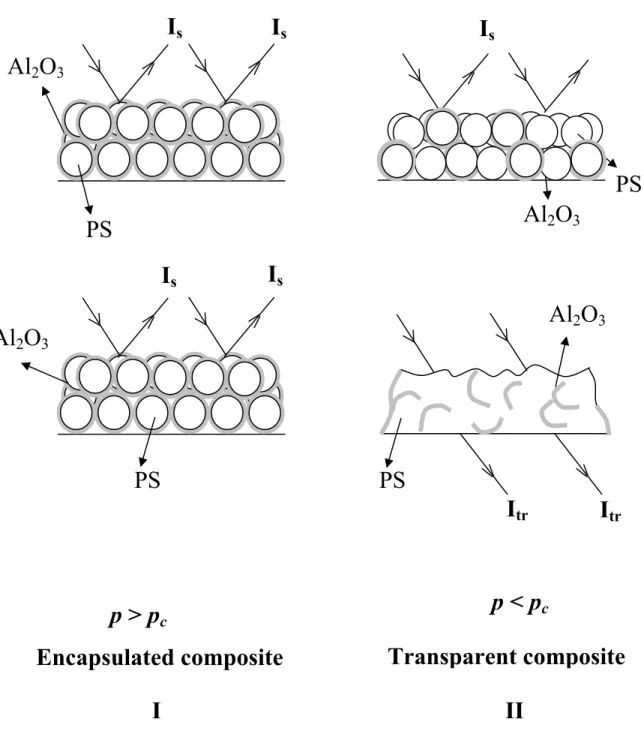
On the other hand Fig. 8 presents the plots of the maximum values of (Itr)max versus wt% latex content. It is interesting to see that (Itr)max shows an increase starting from 67 wt% latex content in composite film, predicting a percolation threshold behavior of Al2O3 in polymer matrix. As we already know that 33 wt% Al2O3 corresponds to the percolation threshold, pc for the latex composite system, above which latex particles encapsulated with Al2O3 ceramic. At pc, Al2O3 percolates among the latex film, below pc however latex film formation can be completed with the residues of Al2O3 barriers. This picture is now depicted in Fig. 9 where the behavior of the composite film below and above pc are
presented which are supported by the AFM pictures in Fig. 6. Here it is seen that when p>pc, encapsulated films shows
no transparency to the light, however if p<pc then composite film becomes transparent to the light and (Itr)max increase dramatically.
In conclusion this part of the work has shown that the presence of Al2O3 in PS matrix can affect the film formation processes. If the presence of Al2O3 is higher than the critical value, Rc the PS lattices are encapsulated by Al2O3. However, if the amount of Al2O3 lower than Rc, the classical latex film formation process can take place.
PS (wt%)
30
60
90
120
(I
tr)
ma x0
30
60
90
120
Fig 8. Plot of the maxima of transmitted light intensities, (Itr)max from Fig. 5 versus PS latex content.
p
cProc. of SPIE Vol. 7366 736609-12
Downloaded From: https://www.spiedigitallibrary.org/conference-proceedings-of-spie on 02 Dec 2019 Terms of Use: https://www.spiedigitallibrary.org/terms-of-use
Encapsulated composite
Transparent composite
I
trI
trI
sI
sI
sI
sI
sI
sp > p
cp < p
cI II
Al
2O
3Al
2O
3PS
Al
2O
3PS
Al
2O
3PS
PS
Fig 9. Cartoon presentation of I- encapsulated (p<pc) and II-transparent (p>pc) composites. Is and Itr are the scattered and transmitted light intensities.
Proc. of SPIE Vol. 7366 736609-13
Downloaded From: https://www.spiedigitallibrary.org/conference-proceedings-of-spie on 02 Dec 2019 Terms of Use: https://www.spiedigitallibrary.org/terms-of-use
4. REFERENCES
[1] Sun, J., Gerberich, W. W., and Francis, L. F., “Electrical and optical properties of ceramic-polymer nanocomposite coatings,” J. Polym. Sci. B: Polymer Physics 41, 1744-1761 (2003).
[2] Francis, L. F., McCormick, A. V., Vaessen, D. M., Payne, J. A., “Development and measurement of stress in polymer coatings”, J. Mats. Sci. 37, 4897-4911 (2002).
[3] Grunlan, J. C,. Gerberich, W. W., Francis, L. F., “Electrical and mechanical behavior of carbon black-filled poly(vinyl acetate) latex-based composites “, Polym. Eng. Sci. 41, 1947-1962 (2001).
[4] Vaessen, D. M, Ngantung., F. A., Palacio, M. L. B., Francis, L. F., McCormick, A. V., “Effect of lamp cycling on conversion and stress development in ultraviolet-cured acrylate coatings “, J. Appl. Polym. Sci. 84, 2784-2793 (2002).
[5] Vaessen, D. M., McCormick, A. V., Francis, L. F., “Effects of phase separation on stress development in polymeric coatings,” Polymer 43, 2267-2277 (2002).
[6] Sperry, P. R., Synder, B. S., O’Dowd, M. L., Lesko, P. M., “Role of Water in Particle Deformation and Compaction in Latex Film Formation“, Langmuir 10, 2619-2628 (1994).
[7] Mazur, S. “Coalescence of Polymer Particles”, Polymer Powder Processing, Ed. N. Rosenweig, John Wiley and Sons, New York (1995).
[8] Pekcan, Ö., Canpolat, M., “Direct fluorescence technique to study evolution in transparency and crossing density at polymer-polymer interface during film formation from high-T latex particles”, J. Appl. Polym. Sci. 59, 277-285 (1996).
[9] Canpolat, M. and Pekcan, Ö., “Healing and photon diffusion during sintering of high-T latex particles”, J. Polym. Sci. Polym. Phys. Ed. 34, 691-698 (1996).
[10] Arda, E., Bulmuş, V., Pişkin, E. and Pekcan, Ö., “Molecular weight effect on latex film formation from polystyrene particles: A photon transmission study“, J. Coll. Int. Sci. 213, 160-168 (1999).
[11] Pekcan, Ö. and Arda, E., “Void closure and interdiffusion in latex film formation by photon transmission and fluorescence methods“, Colloid & Surfaces A, 153, 537-549 (1999).
[12] Keddie, J.L., Meredith, P., Jones, R.A.L and Donald, A.M., Film Formation in Waterborne Coatings, Provder, T., Winnik, M.A. and Urban, M.W., (Eds.), ACS Symp. Ser. 648, pp. 332-348, Amer. Chem. Soc. (1996).
[13] Prager,S., Tirrell, M. J., “The Healing-Process at Polymer-Polymer Interfaces,” Chem. Phys., 75, 5194-5198 (1981).
[14] Wool, R. P., Yuan, B. L. and McGarel, O. J., “Welding of Polymer Interfaces,” J. Polym. Eng. Sci. 29, 1340-1367 (1989).
[15] Stauffer, D., Introduction to Percolation Theory, Taylor and Francis, London (1985).
[16] Özbek, H., Yıldız, S., Pekcan, Ö., Hepuzer,Y., Yağcı, Y., Berker, A. N., Galli, G., Chiellini, E., “Comparative study of liquid-crystalline ordering in a monomer, linear polymer, and graft copolymer by the photon transmission technique,” Phase Transition 76, 991-998 (2003).
[17] Pekcan, Ö. and Arda, E., “Site percolation model for latex film formation in soft polymer matrix,” J. Coll. Inter. Sci. 250, 471-477 (2002).
Proc. of SPIE Vol. 7366 736609-14
Downloaded From: https://www.spiedigitallibrary.org/conference-proceedings-of-spie on 02 Dec 2019 Terms of Use: https://www.spiedigitallibrary.org/terms-of-use