Testte Çevresel Değişikliklerin Denetiminde
Olay-Yönlendirmeli İzleme Yaklaşımı
Şükrü Alataş1 ve Aysu Betin-Can1 1 Orta Doğu Teknik Üniversitesi, Enformatik Enstitüsü
Ankara, Türkiye
{sukru.alatas, betincan}@metu.edu.tr
Özet. Bu çalışmada, çevresel değişikliklerin yazılım testi esnasında nasıl denet-lenebileceğini ve sistem kaynakları üzerindeki etkilerinin test kodunda nasıl teyit edilebileceğini araştırdık. Bu çalışma, popüler test çerçevelerini Microsoft Win-dows işletim sisteminin alt sistemi olan "WinWin-dows için Olay İzleme/Event-Tra-cing for Windows (ETW)“ ile birleştiren yeni bir çözüm sunmaktadır. "İzlenen Test Uzantısı/Traced Test Extension" adlı MSTest2 gibi popüler test çerçevele-riyle çalışan bir uzantı geliştirdik. Bu uzantı, işletim sisteminin test sırasındaki uygulamalar tarafından üretilen olayları dinler ve test edenin, test hedefleriyle ilgili çevresel değişiklikleri kontrol etmesi için teyit mekanizması sağlar. Uzantı, öngörülen bellek ayırma veya dosyaya, kayıt defterine veya ağa erişim gibi, işle-tim sistemi tarafından üretilen olayların miktarını ya da belirli özelliklerinin top-lam değerini teyit etmesini sağlar. Test eden tarafından bu uzantı ile sağlanan arayüzleri kullanarak teste özel teyit kuralları da geliştirebilir. Sonuçlarımız ve vaka çalışmamız ETW ile uygulanan yöntem arasındaki işbirliğinin umut verici sonuçlarını göstermiştir. Sonuçlar ayrıca testte ETW kullanımının potansiyelini ortaya koymuştur.
Anahtar kelimeler: Yazılım Testi, Çevresel Değişikliklerin İncelenmesi
Event-Driven Tracing Approach for Inspecting the
Environmental Changes in Testing
Şükrü Alataş1 and Aysu Betin-Can1
1 Middle East Technical University, Informatics Institute, Ankara, Turkey
{ sukru.alatas, betincan}@metu.edu.tr
Abstract. In this study, we investigated how the environmental changes can be inspected in testing and how to assert the impacts on system resources in test
code. This study offers a new solution which connects the major testing frame-works to a subsystem of the Microsoft Windows operating system, "Event-Trac-ing for Windows" (ETW). We developed an extension, which works with the major testing frameworks like MSTest2, named "Traced Test Extension." This extension listens to the events produced by the operating system's event sources during testing and provides assertion for the tester to check the environmental changes regarding test objectives. The extension enables test code to check the aggregate value of the specific properties of events thrown by the operating sys-tem, such as unpredicted memory allocation and accesses to file, registry, or net-work. The tester could also implement custom assertion rules by using the pro-vided interfaces in this framework. Our results and the case study showed prom-ising results of the co-operation of the ETW and the methodology. Results also revealed the potential of ETW usage in testing.
Keywords: Software Testing, Inspecting Environmental Changes
1
Introduction
Testing is a vital software engineering process that is used for identifying whether a program or a piece of code behaves as anticipated. It is used to evaluate the conform-ance of software to its intended functional and non-functional requirements. Testing is usually considered as an activity to check whether the actual results match the expected results when the intended inputs are given to the software-under-test (SUT). However, testing is also dealing with many different aspects like program or system state altera-tions, or environmental changes during execution. These aspects should be taken into consideration to evaluate the results of the test correctly.
This study presents a new approach to automate the inspection of the environmental changes which have an essential role in assessing the results of the tests. The resulting system enables the test code to check the environmental changes during test execution, as opposed to checking as an after the fact via a profiler or other methods.
1.1 Problem Definition and Motivation
Every test has many results that no one specifies them all. “An ‘expected result’ points the tester at one or a few of these results, but it keeps away from the others [1].”
For example, suppose there is a software that would gather the keyboard inputs and write them to a file. The testing of that software may primarily evaluate whether the keyboard inputs and the resulting file match. However, the software may keep the in-puts in the memory first and write them all to the file at once; or it may write every input to the file as soon as it gets them. Even if the input and the resulting file are the same, these two approaches may behave very differently in terms of the runtime envi-ronment.
Fig. 1. Inputs and outputs of a SUT [1]
Figure 1 shows the different inputs and outputs of SUT to be examined while testing. A proper test design should cover all of them adequately to ensure correctness of the test results. Eventually, it is clear that if all we compare the test results of SUT against the expected result, we will not notice other bugs [1]. We can easily miss apparent problems. “If we are focusing our attention on something else, then we have a signifi-cant probability of completely missing an unexpected event that happens right in front of us [1].”
There is a definition of this phenomenon in psychology, which is called "inatten-tional blindness" [2]. When people focus on a task that demands their attention, they often fail to notice unexpected events that occur in full view. Because people typically do not consciously perceive aspects of their world that fall outside of the focus of their attention.
In software testing, there are many different inputs and outputs rather than the "in-tended inputs" and "monitored outputs" as defined in Figure 1. Any test process should include a thorough inspection of the results at each test [3]. To ensure the quality of the test results, all participants during the execution of the tests, not only the SUT, should be monitored and evaluated. It is necessary since the SUT may cause changes in the environment during testing. Unmonitored outputs may cause misjudgment about the test if they are not considered as an output of the SUT.
Consider our simple keyboard to file streamer application. The first approach that the software keeps the inputs in the memory first and write them all to the file at once causes memory pressure; on the other hand, the second approach that writes every input to the file as soon as it gets them causes too many accesses to the persistent storage. Even if the input and the resulting file are the same, in order to evaluate the software regarding the requirements, these environmental changes should have been observed because the software may have a performance or capacity requirements. Both of these programs conforms only one of these requirements. It is also possible that, this simple program writes the inputs 10 minutes after the last keyboard event, or that there was a memory leak and the program allocates tens of gigabytes of memory. The ‘unexpected’ impacts on system resources are also the results of that program.
In this study, we focus on a way of keeping records of the environment. We give the testers a capability of assertion on these records to validate/check the impacts of the tests on system resources with respect to the non-functional requirements of the SUT.
In this respect, we provide a new way to the tester for inspecting the impacts of the tests on the system resources. Using our mechanism, the tester can verify the SUT in different aspects, with not only the expected outputs but also the other outputs of the SUT. This also keeps tester’s focus on the impacts on system resources and connected devices of a typical software test, which is shown in Figure 1.
1.2 Approach
It is apparent that we need a broader approach to observe and inspect the environment during testing. To capture all of the effects on runtime environment, the events should be traced in all levels from SUT through kernel-level. This study uses a subsystem of the Microsoft Windows operating system, "Event-Tracing for Windows" (ETW) to trace all the events from user-level through kernel-level.
Event Tracing for Windows (ETW) is a kernel-level tracing feature of the Windows operating system that lets the user observe kernel or application-defined events [4]. It was first unveiled with Windows XP operating system in early 2000. In ETW, the user can consume the events in real-time or from a log file and use them to in order to trace the internal activities of an application.
ETW has three components that are "controller," "provider," and "consumer.” The controllers start and stop an event tracing session and enable providers to produce events. The providers produce events on certain conditions, like memory allocation. The consumers create a tracing session and get notified from these events when they are produced.
The diagram in Figure 2 shows the architectural model of the ETW [4].
Fig. 2. Architectural model of the ETW [4]
Consumers consume the events via Event Tracing Sessions. The user creates an event tracing session, and it records the events from one or more providers. The session is also responsible for managing and flushing the event buffers.
All events have the same metadata fields that contain the necessary information shared by all event types. Moreover, events can have an additional payload to carry
more specific information about the event. The consumer can extract that information from the payload section of an event.
In this study, we propose an approach to capture events from ETW providers in a session during testing. With this approach, the tester can inspect these events to check the environmental changes regarding test objectives. The testers can also use the addi-tional parts of the events to observe a specific type of event.
To realize this approach, we developed an extension, named "Traced Test Extension (TTE)," to popular testing frameworks for .net Framework. TTE is installed as an ex-tension to major testing frameworks and allow testers to capture and inspect ETW events.
1.3 Related Work
ETW is heavily used primarily in performance monitoring and profiling. Currently, there are a number of tools in the market that use ETW for profiling applications and system. ETW gives the tools an ability to understand performance bottlenecks or issues. These tools simply collect and analyze the events provided.
ETW usage in software development and testing is primarily done in Microsoft Vis-ual Studio Integrated Development Environment (IDE). VisVis-ual Studio is the primer IDE for .net Framework and Windows-oriented software development. Visual Studio has a profiling feature from the very early version, to record and visualize tracing the software development and tests. This feature uses the ETW subsystem primarily to col-lect the events provided by the source or test code. It colcol-lects the event and correlates them with method calls [5].
In all these tools, the effect of the program on the runtime environment is analyzed through profiling. As a general principle of these tools, the events provided by ETW are collected first, then the events refined and visualized to provide the user with an ability to understand the changes in the runtime environment. In general, they can be used in software testing as an inspection tool. Profiling a test could provide some ben-efits to the tester, who tries to understand the problem with the code. Finding perfor-mance problems or issues could also be useful.
However, they are general-purpose inspection tools and not specialized for software testing. The tester faces several problems when she uses these tools for inspecting the runtime environment.
The first issue is that they cannot be used in test automation easily. These tools al-ways need a manual effort to review and understand the problem. Therefore, they can-not be used in automated testing scenarios. The automation of software testing has be-come a necessity, especially in agile software methodologies and test-driven develop-ment (TDD). These principles are heavily based on automated testing.
The examination of the profiling output is another issue. The review and the outputs of the review are heavily based on the tester's experience. The issues cannot be easily noticed by the tester in some circumstances. Therefore, the results of the test could be different from tester to tester.
Another issue is the output size of the profiler. In the ETW system, there could be thousands of event providers that create events in real-time. In a typical runtime envi-ronment, there could be tens of thousands of events generated in a short amount of time. A considerable portion of these events is unrelated to the SUT. However, the profiler records every event provided by the events sources in the profiling sessions. The output of the session can reach massive sizes in a long profiling session of a test. The visuali-zation and analysis of that significant size of the output take much more system/human resources and time.
In this study, we provide a new approach to handle those problems for ETW usage in software testing. We developed an extension, which works with the major testing frameworks for .net Framework, named "Traced Test Extension."
2
Traced Test Extension Library (TTE)
In this study, we present Traced Test Extension Library (TTE) to enable the test code to examine and assert on the effect of SUT on the system resources. Traced Test Ex-tension Library is an exEx-tension library for the major testing frameworks in .net Frame-work ecosystem. TTE is developed as open-source under GNU GPL v3 license that allows other entities to use, modify, and distribute the source code [6].
The source code is available at GitHub1. The compiled library is readily available as a NuGet package2. TTE is developed to target both .net Framework v4.5 and .net Stand-ard v2.0. This selection provides the testers to use in a variety of .net Framework and other subsidiaries. The library could be used with .net Framework v4.5 to v4.8, .net Core v2.0, Mono v5.4, Xamarin, Unity and Universal Windows Platform (UWP).
TTE works with the major testing frameworks, and extend their capability to listen to the events produced by the operating system's event sources during testing and pro-vides assertion for the tester to check the environmental changes regarding test objec-tives.
The extension can check the aggregate value of the specific properties of events thrown by the operating system, such as unpredicted memory allocation or/and accesses to file, registry, or network. The tester also could implement custom assertion rules by using provided interfaces in TTE. There are also sample tests provided with the source code.
Principle of TTE. TTE is designed to isolate the testing method from the
environ-ment as well as extension's procedures. There are numerous events created in the runtime environment, and the tester only needs to collect a tiny portion of them. With the help of this isolation, the tester could collect and analyze the events only produced by the test code and its related components without tackling the unrelated events pro-duced by the other processes.
1 https://github.com/alatas/TracedTestExtension 2 https://www.nuget.org/packages/TracedTestExtension/
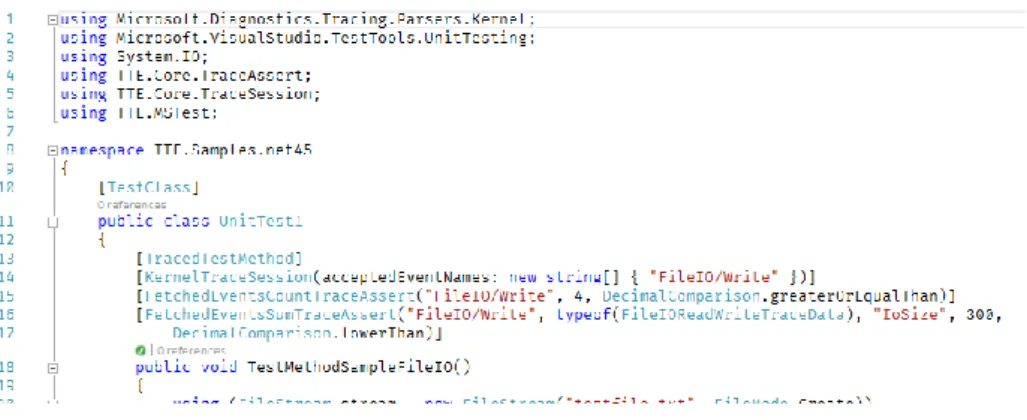
Fig. 3. An example test definition in TTE
To provide this isolation, TTE statements are written as metadata (called attribute in .net ecosystem) to test methods (refer Figure 3, line 13 – 16). The tester only needs to define these metadata annotations to use TTE. When the test driver runs the test code, TTE takes control of the execution and initiates the necessary ETW components to start the trace sessions defined in the metadata annotations of the test method. After the ex-ecution, TTE consolidates the collected events and assert the outputs with the defined assertions in the metadata annotations of the test method.
This approach provides us a clean syntax and full isolation that do not mix TTE definitions with the test codes. Otherwise, procedures of TTE might also create events which could mingle with the events caused by the actual test, causing the tester to drive unreliable results about the test.
There are three kinds of metadata annotation definition in TTE: Test method defini-tion, Trace session definitions and Test assertion definitions.
Test method definition is a single metadata annotation to test methods. It marks the test
method to be traced with the extension. The annotation we provide for test method definition is “[TracedTestMethod].” This annotation replaces the standard test method annotation (e.g., "[TestMethod]" for MSTest2) of the current test framework. The ex-tension only traces the methods annotated with this particular annotation (refer. Figure 3 line 13). If a method is not annotated as [TracedTestMethod], then the other annota-tions of TTE are not evaluated by the extension.
Test session definitions are a set of specific tracing session definitions that points the
individual tracing sessions the extension should create. Every tracing session has a spe-cial event parser which parses the events produced by the source. There are different types of event parser options available in ETW. Each one of them is specialized to one specific purpose of events to be collected. For example, "KernelTraceSession" includes "KernelTraceEventParser," which collects and parses the kernel-related events like file IO, memory allocation (refer. Figure 3 line 14).
Trace sessions might have a set of options which is used to filter the fetched events. The tester can filter out one of the event providers, or can only accept a set of type of events. This filtering mechanism shrinks the extension's memory footprint and speeds up the assertion process. These options can also be used to collect the events that the tester needs to collect, created outside of the testing thread. TTE has two trace session
currently, users could extend the base and create their trace sessions. In this study, we propose “KernelTraceSession” and “CLRTraceSession” annotations, which will be de-tailed later, one for each tracing session type. Users can also add their own annotations when they extend the base “TraceSession” class in the extension package.
Trace assert definition is a set of specialized assertion description which is used to
determine the outcome of the test. The assertion procedure runs over the collected events, then decides the result of the test. There are two assertion definitions available in TTE, "FetchedEventsCountTraceAssert" and "FetchedEventsSumTraceAssert" (re-fer. Figure 3 lines 15, 16). Testers could extend the base class and create their custom trace assert definitions.
Predefined Trace Sessions. Currently, there are two trace sessions annotation
avail-able in TTE, "KernelTraceSession" and "CLRTraceSession." Moreover, there is also a special kind of trace session annotation, which is added by TTE to all tests, "Thread-StopKernelTraceSession."
Predefined Trace Assertions. Currently, there are two defined assertion option
available in TTE which are "FetchedEventsCountTraceAssert" and "FetchedEventsSumTraceAssert". These two options could be extended through the tester's needs. The tester can inherit the base trace assertion class and write its trace assertion.
Custom Trace Assertions. When the assertion methods provided in TTE is not
en-tirely suitable to test requirements, testers can implement their custom trace assert at-tribute. There is an abstract class defined in TTE named "TraceAssertAttribute" which is the base class of all trace assert attributes in TTE. There is a method in the base class named "Assert" that is used to assert the collected events. When this method is overrid-den, TTE provides a list of "TraceEvent" to this method after the main test method stopped.
2.1 Limitations of ETW and TTE
TTE is tightly bonded with ETW subsystem. Therefore, the limitations of ETW inher-ently affects TTE. Some of these limitations do not affect the daily testing routines, but some of them need to be considered before starting to use TTE.
Minor Limitations. Event Tracing supports a maximum of 64 event tracing sessions
executing simultaneously in Windows Vista and succeeding Windows Operating Sys-tems.
TTE uses ETW in real-time mode. TTE starts with 128 MB of buffer size for each tracing session. If the test system is not fast enough to handle the flowing events, the events are not captured accurately after that buffer is filled.
Major Limitations. The lack of platform support is an essential major limitation of
TTE. The ETW system is currently supported only by Windows operating systems. Therefore, the TTE cannot be used in Mac OS or Linux even if the .net platform is supported on these operating systems via .net Standard targeting.
The requirement of administrative permission is another major limitation. Since ad-ministrative permission is required to create a tracing session and consume events, TTE needs to be executed by a user with administrative permission.
3
A Case Study with TTE
In this section, we provide a case study to see the feasibility and efficacy of the approach in a real-world example. The details about the case are defined first, then the problem and the solution are detailed.
3.1 Case Study Description
For the case study, we selected a long-running system which previously had an issue that can be inspected with TTE. The system is one of the busy websites which gets 80 million page views annually. The system was developed almost five years ago with .net framework v4.5.
In a technical perspective, the system is a web application which is developed in layered architecture style. The size of the system is ~80KLOC. The system has different interfaces provided to different stakeholders, such as dedicated physical devices, or dif-ferent web services. All of these interfaces are connected to the same backend applica-tion for providing services.
Regarding the software testing point of view, the system has strict testing require-ments for the critical components. Also, there are more than 200 integration testing methods to test the interactions between components and other systems.
3.2 Problem Description
After the deployment, an anomaly noticed about the system's memory allocation during a server inspection. The system was usually starting with memory allocation of less than 1 GB, which was quite reasonable. However, the memory usage of the application increased to 8 GB in a couple of minutes. This allocation was negatively affecting the whole system.
After a while, we found a couple of code that causes the high memory usage. We refactored those pieces, but this refactoring did not solve the main problem. There was an apparent memory leak situation that causes the problem. We focused on the “un-managed codes,” which is the most likely cause of the memory leak problems. The code, which is developed outside .net Framework, is known as unmanaged code. The unmanaged code includes also an executable program that runs by itself. The managed code does not need to manage their resource utilization and disposal. These are coordi-nated by the CLR[7]. For example, Garbage Collector (GC) checks the allocated re-sources and disposes them. Unlike the managed code, the unmanaged code needs to manage their own resource utilization and disposal. Therefore, the unmanaged codes are the possible root cause of the memory leak problems.
After more than a week, we found the root cause of the memory leak that leads to a massive amount of memory allocation. A third-party tool developed by Microsoft causes the memory leak in a specific condition that occurred in our case. This third-party tool, which generates a file which is one of the primary outputs of the system, runs alongside the managed code in a single application domain. Therefore, the memory allocation of the tool was seen as the allocation of the whole application.
The system had already passed the unit and integration tests while we were dealing with the problem. The tests did not notice anything unexpected with the system re-sources because they did not inspect the runtime environment for an absolute impact caused by the code.
3.3 Application of TTE
After TTE is developed, we revisit the issue discussed above. We applied TTE on this software to find out the effectiveness and feasibility of TTE. First, we converted the "TestMethod" annotations of the MSTest testing framework to "TracedTestMethod" (refer Figure 4, line 33).
Fig. 4. The revised metadata of the test method
Then, we added "KernelTraceSession" annotations to collect kernel events. The event filter added to the annotation is "VirtualMem/Alloc" which filters the virtual memory allocation events. TTE creates a kernel trace session to collect the memory allocation events with this annotation (refer Figure 4, line 34).
Also, we added "FetchedEventsSumTraceAssert" annotation, which is used to vali-date the sum of a field. The annotation defined that the total value of the "Length" field of all "VirtualAllocTraceData" events should be no more than 20 MB (refer Figure 4, line 35, 36). We gathered this size measurement after the execution of the tool in a typical condition.
As a result, we defined the trace session and assertion characteristics that we need in this specific testing circumstances. Then, we run the tests as before.
3.4 Results
Before the modification, the test code verified only the monitored outputs of the test, which is a valid file with some specific properties. It could not notice the problems caused by the third-party tool who creates the output file.
After the first execution of the modified test, an assertion exception was thrown by TTE, and the test failed due to this exception. The test can quickly realize the impacts on the system resources alongside the expected output file and flagged the faulty code in a couple of seconds.
In the beginning, if we had a tool like TTE, we could easily be noticed the issues caused by the test code or third-party tools in this case. We only needed to write the expected memory allocation definitions to related test methods as annotations.
When the issue first arose, we spent more than a week to find the root cause and fix it. If we had used TTE before the issue, we would have annotated the test methods
exercising the resource critic features of the software, and we probably find the root cause in less than a week before the deployment.
4
Discussion
4.1 Findings
The case study and the other sample tests initiated with the TTE showed promising results in the inspection of the impacts on system resources in test codes. The problem with the case study was solved without any further inspection needed. We only needed to make a couple of additions to the present integration tests. The tester needed only to define the expected changes from the runtime environment. The rest was executed by the TTE. The root cause of the anomaly was revealed in a short period.
Moreover, ETW provides TTE a broader approach to inspect almost any changes in the runtime. With the help of the custom additions to TTE, the tester can track all the event providers needed and can assert the outputs easily. TTE also urge the testers to take the impacts of SUT on system resources into consideration.
However, shortcomings were also found during the study. The leading cause of these findings is ETW system, which has some drawbacks. First, the initialization and the disposal operations of the trace sessions in ETW takes a considerable time and system resources. The tests would be affected negatively by this allocation. The concurrency model of the TTE is based to minimize these adverse effects, but the overhead caused by ETW could be noticed by the tester directly. The tester might need to select some of the test cases to trace with TTE to minimize the adverse effects.
Another drawback of the ETW is the missing events. The delivery of every event provided cannot be assured by ETW. There may be some missing events that cause misjudgment about the result of tests. The missing event ratio is heavily related to sys-tem performance. If the tests are running on a syssys-tem that has not enough memory, there would be more missing events.
4.2 Future work
The most critical work needed to be done in the future is supporting other popular test-ing frameworks like xUnit and NUnit. This expansion is supported by TTE, and these testing frameworks implicitly.
Another essential future expansion of TTE is adding other tracing session options which are available in ETW. With this expansion, the capability of the TTE will im-prove significantly. TTE will have the capacity to trace the webserver events, TCP/IP events, or application server events.
The inter-computer tracing is another possible future expansion of TTE. The capa-bility of TTE will be expanded via collecting events from the computer other than the test is running. This feature may be handy for the tester when integration and system tests. These tests may cause environmental changes in other systems. These changes will be able to track with this expansion.
In connection with this expansion, the execution of the trace sessions can be departed from the extension to speed up the initialization. A separate tracker application will be responsible to collect the events. After the test, the tracker application provides the col-lected events to the extension. This approach may increase the performance of the ini-tialization procedures of TTE.
5
Conclusion
Testing is the evaluation of the conformance of software to its intended functional/non-functional requirements. Testing is usually considered as monitoring expected outputs from a software-under-test (SUT) which gets the intended inputs from the tester. How-ever, to ensure the correctness of the test results, all participants who are a part of the tests, not only the SUT, should be monitored and evaluated. A broader approach is needed to observe and inspect the runtime environment during testing. For capturing all the impacts on the runtime environment, the events created by the operating system and applications should be traced in all sub-levels from SUT to kernel-level. The re-sulting output of our study, "Traced Test Extension (TTE)," uses "Event-Tracing for Windows" (ETW) subsystem to give the tester an ability to inspect the runtime envi-ronmental changes during testing with ease. A feature of the Microsoft Windows oper-ating system, ETW can trace all the events from user-level to kernel-level. In this spect, TTE alongside ETW can collect and assert almost all impacts on system re-sources with defined notations on supported testing frameworks. With the planned fu-ture expansions, TTE may become a unique tool to the testers to use not only for in-specting the environmental changes, but also for using as a benchmark tools, or system inspection tool during system integrations.
References
1. C. Kaner, "The Ongoing Revolution in Software Testing," in Software Test & Performance Conference, 2004.
2. A. Mack and I. Rock, Inattentional Blindness, MIT Press, 1998.
3. G. J. B. T. T. T. M. &. S. C. Myers, The art of software testing (Vol. 2)., Chichester: John Wiley & Sons., 2004.
4. Microsoft, "About Event Tracing," 31 5 2018. [Online]. Available: https://docs.mi-crosoft.com/en-us/windows/desktop/etw/about-event-tracing. [Accessed 10 5 2019]. 5. T. Arnold, D. Hopton, A. Leonard and M. Frost, Professional Software Testing with Visual
Studio 2005 Team System, Wiley, 2007.
6. Free Software Foundation, "GNU General Public Licence," 29 6 2007. [Online]. Available: https://www.gnu.org/licenses/gpl-3.0.txt. [Accessed 13 5 2019].
7. Microsoft, "Common Language Runtime (CLR) overview," 2 4 2019. [Online]. Available: https://docs.microsoft.com/en-us/dotnet/standard/clr. [Accessed 14 5 2019].
![Fig. 1. Inputs and outputs of a SUT [1]](https://thumb-eu.123doks.com/thumbv2/9libnet/3811425.32915/3.892.279.618.216.432/fig-inputs-outputs-sut.webp)
![Fig. 2. Architectural model of the ETW [4]](https://thumb-eu.123doks.com/thumbv2/9libnet/3811425.32915/4.892.303.590.728.914/fig-architectural-model-etw.webp)