IEEE TRANSACTIONS ON ULTRASONICS, FERROELECTRICS, AND FREQUENCY CONTROL, VOL. 39, NO. 6, NOVEMBER 1992 66 I
A Lamb Wave
Lens for Acoustic Microscopy
Abdullah Atalar,
Senior Member, IEEE,Hayrettin Koymen,
Senior Member, IEEE,and
F. Levent Degertekin
Abstract-In a conventional scanning acoustic microscope the excited leaky modes contributes significantly to the high contrast obtained in the images. However, all such modes exist simultane- ously, and the interpretation of the images is not straightforward, especially in layered media. A new lens geometry is proposed that can be used with acoustic microscopes to image layered solid structures. This new lens can focus the acoustic waves in only one of the Lamb wave modes of the layered solid with a high efficiency. 1 - ( Z ) curves obtained from this lens are more sensitive to material properties compared to that obtained from conventional lens. Measuring the return signal as a function of frequency results in another characteristic curve, l * ( f). The Lamb wave lens and the associated characterization methods for the layered structures are described. The results presented show that the Lamb wave lens is at least an order of magnitude more sensitive than the conventional lens and can differentiate between a good bond and a disbond in a layered structure easily.
I. INTRODUCTION
A
COUSTIC MICROSCOPE is a powerful instrument forthe quantitative characterization of materials [l]. In par- ticular, important structural parameters like film adhesion [ 2 ] ,
elastic constants and residual stresses [3] on layered solids can be measured. Subsurface images of such structures can also be obtained using the excited leaky layer waves [4]. Leaky layer
waves such as leaky-Rayleigh waves or generalized Lamb
waves can be excited in a planar layered structure immersed
in liquid by bulk waves incident at the surface at some critical angles
[ 5 ] .
The critical angles are determined mainly by layer thicknesses, elastic properties of the layer/substrate materials and the frequency of operation. When a scanning acoustic microscope is used to image a layered solid structure, almost all possible acoustic wave modes are excited in the structure, because the acoustic microscope lens creates all incidence angles at the object interface. In this case, the images are cluttered by the presence of many simultaneousmodes. Some of these excited modes are bulk waves, and
some are leaky modes that eventually return to the liquid medium. The efficiency of excitation is rather low, because an appreciable part of input power is wasted at angles where there is no subsurface excitation. An interference of specularly reflected rays with leaky modes gives rise to the well-known
V ( 2 ) effect that is responsible for the high contrast in the acoustic images. When used with a layered structure, the
presence of many modes makes the interpretation of
V ( Z )
rather difficult. From such images one hopes to detect flaws Manuscript received April 15, 1992; revised and accepted July 14, 1992. This work was supported by the Turkish Scientific and Technical Research Council, TUB~TAK.
The authors are with the Department of Electrical and Electronics Engi- neering, Bilkent University, Ankara, Turkey 06533.
IEEE Log Number 9203243.
like delaminations, disbonds, layers under stress, changes in elastic parameters, etc. Although there exists methods (61 of recovering elastic parameters of the material under test from the received signal, the results of these computations are not very accurate and most of the time the inversion problem is ill-conditioned.
We propose a different lens design that produces images
easy to interpret. The new Lamb wave lens resembles a
conventional acoustic microscope lens except that it employs a conical focusing surface rather than a spherical one. It can excite subsurface acoustic waves with a high efficiency. As the critical angle of a layered material depends on frequency [7], the Lamb wave lens can selectively excite the leaky modes by matching the fixed incidence angle with the corresponding critical angle at a particular frequency. V ( 2 ) obtained with this new lens, is formed by interference of a single leaky mode and the specular reflection providing a direct and very sensitive measurement technique for the leaky wave velocity of the object. Recording the received signal amplitude,
V ,
as a function of varying frequency,f,
one obtains a uniqueV(
f )
curve that is highly dependent on elastic parameters of the layer, of the substrate and the quality of the bonding. This provides a characterization method for layered structures. The
V ( f ) method was proposed earlier [8] to be used with con- ventional lens. That combination, however, was not suitable for characterizing layered structures. V ( f ) technique has some advantages over the
V ( Z )
method: A fast frequency scan is sufficient to get V(f) while a slow mechanical scanning isneeded for V ( Z ) . Moreover, the interpretation of V (
f)
is easier than that ofV ( Z ) .
In this paper, we first give a theoretical analysis of the Lamb wave lens based on angular spectrum approach and ray acoustics. We find an expression that relates the signal output to the reflection coefficient of the object, and to the geometrical parameters of the lens. To show the subsurface characterization potential of the system, layers with perfect bonding, disbond and delamination are investigated. We find that the new lens differentiates between these interfaces with a high sensitivity. For experimental confirmation, we use a Lamb wave lens and present measured V(Z) and V ( f ) curves for layered materials along with calculated results.
11. EXCITATION OF LEAKY MODES
A layered solid immersed in liquid supports leaky modes known as Rayleigh-like (LR) waves [9] and generalized Lamb waves
[lo].
The LR wave is like a Rayleigh wave and it is confined to the surface. This wave is dispersive, and the dispersion is determined by the wavelength and the thicknessof the layer(s). The generalized Lamb wave modes are like 0885-3010/92$03.00 0 1992 IEEE
662 IEEE TRANSACTIONS ON ULTRASONICS, FERROELECTRICS, AND FREQUENCY CONTROL, VOL. 39, NO. 6, NOVEMBER 1992 40
-
E
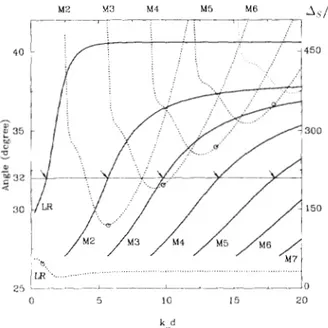
35 M '0 3 0Fig. 1. Excitation angle from liquid side (solid) and Schoch displacement of various modes in wavelength units (dotted) as a function of k t , ( / for a copper layer on steel.
Lamb wave modes in a plate and they are also dispersive. When the layered solid is immersed in liquid, all these modes become leaky, as their energy is radiated into the liquid
medium. In this case, it is also possible to excite these modes by a bulk wave insonification in the liquid medium [ 7 ] . Corresponding to each mode there exists a critical angle of
incidence (111. Since the modes are dispersive, the critical angles depend on the frequency. The dispersion curves can be obtained by examining the reflection coefficient at the liquid- layered solid boundary. At the critical angles the reflection coefficient has phase transitions.
Here, we consider solids containing only one layer. We cal- culated the dispersion characteristics for a number of structures using the reflection coefficient. Fig. 1 shows the dispersion curves of leaky-Rayleigh wave and the Lamb wave modes
for a copper layer on a steel substrate. The horizontal axis is the wavenumber-thickness product, kt,9d. Here, is the shear wavenumber of the substrate and d is the thickness of the layer. As opposed to the common convention, the vertical axis is the critical angle of incidence. For small k,,d values only the LR
mode exists. For kt,sd =
0,
the critical angle, 8, is equal to the Rayleigh critical angle of the substrate. As k+,d increases, the critical angle changes and approaches to the Rayleigh critical angle of the layer material. The first Lamb wave mode (M2) is excited only when kt,d is greater than a threshold value. For greater kt,$ values, the critical angle varies toward the shear critical angle of the layer material. Higher order Lamb wave modes (M3, M4, etc.) appear at even greater values of &d. At the cut-off point, the critical angle is equal to the shear critical angle of the substrate material.A wedge transducer [l21 can be used to excite these modes efficiently from the liquid side. An efficiency measure of
such a transducer for a particular mode can be deduced from
the variation of the reflection coefficient phase at the critical angle. In particular, the slope of the phase variation is an
important parameter [13]. This slope is proportional to the Schoch displacement, A s . The optimum detection efficiency
between two equal wedges is about 66%, when the wedge
width, W, is [ 141 W = 0.628
A s
cos 8 , where 8 is the critical angle. This efficiency figure ignores the angular spread of the beam due to finite aperture, and it will be lower when that effect is included. In Fig. 1 we plot As/X with respect tokt,d for the same solid structure where X is the wavelength
in the liquid. For LR mode, & / X is the lowest, while the
same value for the Lamb wave modes exhibit a minimum
for kt,d values very close to their respective cut-off values. For a practical wedge width, very large As/A values must be avoided. Therefore, for efficient Lamb wave excitation, the minimum points of these curves must be targeted. The kt,d and & / X combinations of a wedge angle resulting an incidence angle of 32" is also depicted in Fig. 1. It is interesting that the
kt,.+d value at which each mode is excited, is also quite close to the minimum As/A value for that particular mode. Hence it is possible to choose a wedge angle that will excite most of the lower modes quite efficiently.
111. LAMB WAVE LENS
The foregoing discussion outlines the conditions for effi- ciently coupling the Lamb wave modes in a layered structure by a wedge transducer. A wedge transducer is not suitable to use in an imaging system due to its poor resolution. A method of focusing Lamb waves was described earlier [14]. That system utilized a cylindrical reflecting surface and a
wedge transducer, However, its resolution was not very good because of the limited convergence angle. Here, we describe a new configuration with a better resolution. The basic idea
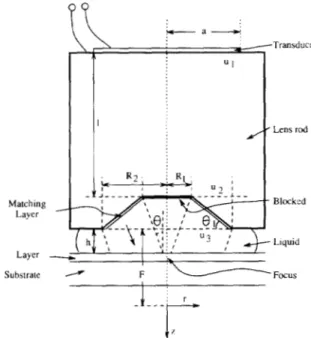
is to use a full conical wave rather than a section of it. The creation of a conical wave can be achieved either by a conical transducer [l51 or by refraction from a suitable conical surface. The geometry of the proposed Lamb wave lens is illustrated in Fig. 2. A conical recess replaces the
spherical cavity of the conventional lens. The acoustic waves produced by the transducer will first hit the conical refracting surface before they reach the object surface. An antireflection layer exists on the conical surface to reduce mismatch loss.
It can be easily proved that all the refracted rays from the conical surface are incident at the object surface at the same angle. If the inclination of generated conic waves is chosen
to be a critical angle for a mode of Lamb waves, a large fraction of the energy will be converted to a leaky Lamb
wave mode. The excited evanescent Lamb waves converge
and focus at the intersection of the cone axis with the object surface. The focused waves then diverge and leak back into the liquid medium. Upon refraction from the conical surface. they are detected by the transducer. If an inhomogeneity is
present at the focus point, the received electrical signal will be disturbed and will diminish in amplitude. Such a lens will have an axial resolution equal to the thickness of the layer, since the Lamb wave modes exist predominantly in the layer. Since the f-number of the lens is very small and no aberrations are involved, it is possible to obtain lateral resolutions better than a wavelength.
ATALAR el al.: A LAMB WAVE LENS FOR ACOUSTIC MICROSCOPY 663
Q 9
Matching Layer Layer Substrate -Transducer I fl Lens r o dI
Fig. 2. Geometry of the Lamb \cave lens.
If the distance,
h ,
between the object surface and the lens is close toF ,
dominantly the specularly reflected rays are received by the transducer and a large signal amplitude will be obtained. As h is reduced the signal due to specular reflection will get smaller. For / L<
( R I /
t,anO - (R2 - R I ) tan81) no specular rays will be received. In this range, only leaky waves will contribute. Obviously one obtains a signal at the transducer terminal that is entirely due to leaky waves, if the central part is blocked. The lens performance and hence the received signal is more sensitive to material and interface properties, however, when the central part is not blocked and leaky waves are allowed to interfere with the specular reflection passing through this part.One apparent problem of the lens geometry is that the incidence angle of rays at the object surface is fixed and this angle may not coincide with a critical angle for Lamb waves for another layer thickness. This problem can be overcome easily by adjusting the excitation frequency. Since the Lamb wave modes are dispersive, the critical angle of a Lamb wave mode can be made equal to the fixed angle of the Lamb wave lens at the proper frequency. The experimental determination of frequency is very easy: one needs to tune the frequency until the maximum signal is received.
Since the bandwidth of most transducers are not very wide, for some samples it may be impossible to hit a critical angle within the tuning range. Therefore, one needs a series of
Lamb wave lenses with different cone angles to be able to
cover all possible samples. The design of the Lamb wave lens involves the following considerations. The cone angle
must be decided using the dispersion curves for the layered material or materials of interest. The transducer size and the rod length must be chosen to minimize the diffraction
loss and the interference from spurious pulses. For good efficiency the lens aperture must be of suitable size. The trans- ducer bandwidth must be wide enough to allow a frequency
Iv.
RESPONSE OF THE LAMB WAVE LENS The amplitude of the received signal can be found by an application of the angular spectrum technique. For simplicity we assume a circularly symmetric geometry. Consider the geometry shown in Fig. 2. We assume a circular transducer of radius a placed a distance l away from the conical refracting surface. A planar object surface is placed a distance h away from the refracting surface as shown. We write the scalar potential, U:, at the plane of the transducer asu:(:c, g) = A circ[(x2
+
y2)l/'/a] whereThe angular spectrum, U:, at the same plane is given by a jinc function:
where -11 is the Bessel function of the first kind. The spectrum,
U:,
at c" = I is written asu$(/c,.
k , ) = 4 a 2 ~ jinc[(n/n)(k:+
k y ) 2 1/2 ]exp(jk,l). ( 3 )The scalar potential,
'U:,
at the plane of the conical lens can be found by an inverse Fourier transformation..;(.c. y) = F - l { L q ( k , . ky)}. (4)
Due to the limited aperture of the conical surface, only the part
of the field distribution for which R1
5
(L?+
g 2 ) l l 25
R2is significant. At this point we use the ray theory to find the field at the surface of the conical refractor surface. We keep the amplitude of the field fixed, but change its phase according to the path length for each ray. Then, we use the ray theory again to take care of refraction effect through the Snell's Law. Referring to Fig. 3, the field at the plane 3 , ,U:,
is approximately ( T ' / T ) ' / ~ A R U ; ( T ' ) t.xp(j(kld1
+
k z d 2 ) }.,'(I.)
=L
R ,<
T'<
R2 (51
elsewhere where -4R = (1+
tan 81 tan(Q1 - 0 2 ) ) 1/2 (6)d l = (r'-R1)tanQ1 and d2 = (R2-r')tarl01/cos(Hl-H*).
where ICl and
kz
are the wavenumbers in the lens rod and in the liquid medium, respectively. Notice that, the diffraction in the short distance between the planes 2 and 3 is neglected. At this point, the geometrical theory of diffraction could be(9)
664 IEEE TRANSACTIONS ON ULTRASONICS, FERROELECTRICS, AND FREQUENCY CONTROL, VOL. 39, NO. 6, NOVEMBER 1992 < r' : + Solid L .
Fig. 3. Geometry for the ray theory.
voltage is obtained by integrating the field. At plane 3 we can transform into the angular spectrum domain to take care of the propagation in z direction and the reflection process at the object interface. The reflected angular spectrum at the same plane, U:, is given by
U ; ( k x , k y ) =
U,f(kx:
k , ) e x p { j 2 k : h } R ( k x / k 2 , k y / k 2 )(10)
where
U , f ( k , ~ k , ) =
F{u;(z>y)}
and kk = ( k ; - k: - k;)'I2.The exponential factor above takes care of a total propagation distance of 2h and the reflection process at the surface of the layered structure is included through a multiplication by the reflection coefficient, R ( k , . / k 2 ) . The voltage output of the transducer due to reflected field can be found from
(11)
+m +m
V =
K
1,
l,
k ; U , f ( - - k x , -ky)br,j-(kz,k y )
dk, dk,.Since the problem has circular symmetry we can make the substitution
(1 2 )
where k, is radial component of the wave number and
K
is aconstant. Then, we write the output voltage, V, as a function of
excitation frequency,
j ,
and the position of object with respectto geometrical focal plane,
2
= h - F , as+ m
V ( f .
Z )
= 2rK1
kTk:U,f(k,)l?',-(k,.) dk,. (14) Here, the V(f.2)
is expressed in terms of lens geometry, the reflection coefficient of the object material, operationfrequency and object separation. The evaluation of V at a
single point involves two Fourier transformations and an
integration operation. Note that, the expression above does not include the frequency response of the transducer.
The result obtained applies when the central part of the lens
is blocked. If the central part is not blocked, then there will be an additional term, due to specular reflection.
0 . 6
,-.
0.4 2- 0.2 C e n t e r blocked C e n t e r not b l o c k e d 0.0L
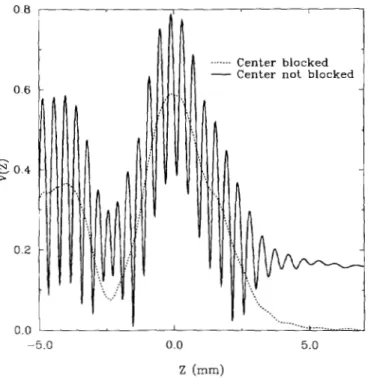
1 I ..._._ ... )... .____. -5.0 0.0 5.0Fig. 4. Lamb wave lens \-(Z) curves (center blocked and unblocked) for 0.6-mm copper on steel (f = 9.G MHz}. The lens is made of aluminum, with
a = S.5 mm, I = 5.9 cm. R1 = 3.1 mm, R2 = 5.95 mm and H 1 = 45.5".
V. THE
V(2)
CURVESV ( Z )
measurement resulting with a center blocked Lamb wave lens gives an interference free curve (dotted curve in Fig. 4). The peak at2
= 0 is due to specularly reflected rays. The second peak around2
= -4 mm is created by the leaky waves. The vertical axis of the graph is normalized so thatk'(0) = 1 for a perfect reflector. The relative magnitude of
the second peak indicates that the overall detection efficiency
for leaky waves is about 14%. If the energy lost in the blocked center is ignored, the efficiency rises to 27%. This figure is less than what can be attained with an optimal Lamb wave lens geometry.
If the waves incident from the central part of the Lamb wave lens is allowed to overlap the leaky waves, an interference mechanism similar to the conventional lens results. For this purpose the center of the lens should not be blocked, in which case a
V(2)
curve with a good number of fringes iseasily obtained. In Fig. 5, calculated V ( Z ) curve for a layered structure composed of 0.6-mm copper on steel substrate is depicted together with measurements. Here, the frequency of operation is 7.8 MHz and there is a disbond at the interface. For large positive Z values, no interference is visible. There, the only contribution is from the normal specular component. At points near 2 = 0 the interference results from the superposition of normal specular component and the oblique specular reflection. The period of the fringes is determined by the cone angle of the Lamb wave lens, and it carries no
or little information about the object. For more negative Z
values
(2
< -2.5
)mm, however, the interference is between normal specularly reflected rays and the leaky waves. In this case, the periodicity is determined by the leaky wave velocity of the particular mode. The agreement of measurements with665
ATALAR ef al.: A LAMB WAVE LENS FOR ACOUSTIC MICROSCOPY
o.8
1
0.6 h 0.4 > 0.2 0.0'
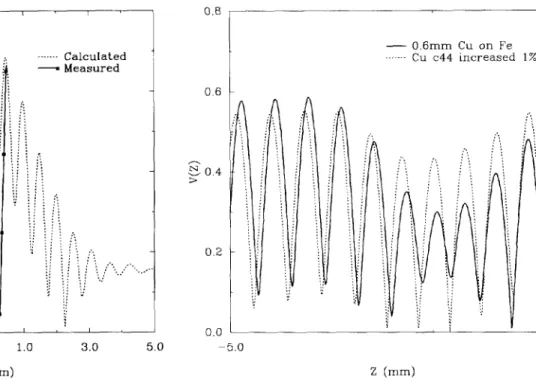
I I I 1 -5.0 -3.0 -1.0 1.0 3.0 5.0 Z (mm)Fig. 5. Measured and calculated Lamb wave lens 1 7 ( Z ) curve for 0.6-mm copper layer on steel with disbond (f = 7.8 MHz).
calculated V ( 2 ) is remarkably good. The discrepancy in amplitude is due to the simplifying assumption in calculations that the normal specular component is proportional to the relative area at the center. The periodicity in
V ( 2 )
curves isthe principal property that constitutes sensitivity. Fig. 6 depicts the V ( 2 ) variation for negative
2
values for a layered material when the q 4 of the layer is perturbed by 1%. Clearly, 0.5%perturbation in the shear wave velocity is easily detectable. With 40 dB signal to noise ratio and a perfect mechanical scanning system, it is possible to detect a velocity perturbation of 0.0075% in the layer material. With such a perturbation, the maximum difference between the two V ( 2 ) curves is U100 (corresponding to 40 dB) of the peak value. Under the same assumptions a conventional lens with an envelope detector can only detect a 0.12% velocity perturbation. Obviously, it is possible to obtain better sensitivity [l61 with a higher signal-to-noise ratio or with signal processing techniques.
VI. V ( f ) CURVES
As the frequency is scanned while 2 is kept constant, a characteristic V ( f ) curve is traced where the peaks signify the existence of modes. The V ( f ) curve is highly dependent on the phase transitions of the reflection coefficient. Since, any perturbation of elastic or physical parameters such as the thickness, density or elastic constants of the layer causes a shift in the position of the phase transitions, a shift in the positions
of V ( f ) peaks is also expected.
The material property discrimination ability of the Lamb wave lens with a blocked center was previously investigated by means of simulation [17]. It was shown that a 5% change in c44 of the layer material causes nearly 5% shift in the peak
positions. Similarly, a reduction in layer density, p , causes a shift in the same direction. Corresponding sensitivity figure
0.8 0 . 6
-
9
0.4 0.2 0.0l
-
0.6mm Cu on Fe . . . Cu c44 increased 1%J
5.0Fig. 6. Lamb wave lens \ ? ( Z ) curves for copper on steel (solid) and for copper layer c1.l perturbed by 1% (dashed) ( f = 9.6 MHz).
for the layer density is slightly higher. The layer c11 and
substrate parameters are found to have negligible effect. The shear velocity of the layer material has the greatest influence.
The sensitivity of
V ( j )
curve with respect to material properties can be significantly improved by allowing the specularly reflecting signal from the central part to interfere with the leaky signal. This V ( f ) is depicted in Fig. 7 for 0.6-mm copper layer on steel sample. One can observe a fringe
pattern imposed on the envelope whose morphology is the
same as V ( f ) obtained in the center blocked case. This fringe pattern is very sensitive to the elastic parameters of the layers and the bond quality at the interfaces.
Sensitivity of V ( f ) to material properties and the type of interface is tested on two test phantoms using a lens
with unblocked central part. The phantoms are made of
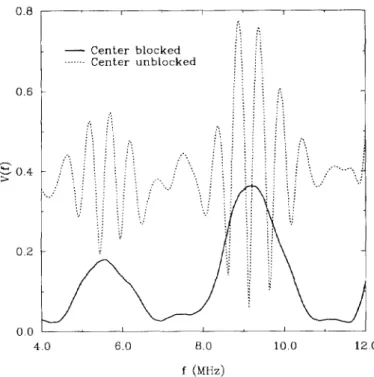
copper layers on steel obtained by electroplating. One of the phantoms contained a region of disbond and the other contained a region of delamination, while good adhesion is maintained elsewhere on the samples. In order to have a strong adhesion to substrate, steel surface must be treated by copper cyanide prior to plating in copper sulphate solution. In order to induce a poor bond, a region is masked during copper cyanide solution. Then, the mask is removed and plating is continued in copper sulphate solution. Both a disbond and a delamination are obtained using this method. In Fig. 8, V ( f )
for good bond and delamination is compared for a copper layer of 0.5 mm, both numerically and experimentally. Note that precise measurement of thickness of the layer is also possible through matching the fringes. Fringes are particularly
pronounced for good bond at frequencies around 6.5 MHz,
whereas for delamination that frequency is 8.5 MHz. In Fig.
9, good bond is compared to disbond. V ( f ) curve very clearly differentiates between the two bonds. The agreement
666 IEEE TRANSACTIONS ON ULTRASONICS, FERROELECTRICS, AND FREQUENCY CONTROL, VOL. 39, NO. 6, NOVEMBER 1992 0 . 6 h ?Z > 0.4 0.2 0 0 U-I I I 4.0 6.0 8.0 10.0 12 0 f (MHz)
Fig. 7. Calculated \ . ( f ) curves for 0.6-mm copper layer on steel in case of good bond using lenses with blocked and unblocked central part.
1- ---
-.--T--l
Good b o n d Delamination 4.0 6.0 8.0 10.0 12 0 f (MHz)Fig. 8. Calculated and measured l . ( f ) curves for 0.5-mm copper layer on steel with good bond and delamination using a lens with unblocked central part.
of experimental results with simulation is particularly good where the interference induced fringe amplitude is high. Most probably, lack of parallelism between the lens aperture and the sample surface is responsible for the slight mismatch in case of good bond in Fig. 9. In calculations, the disbond is simulated by a slippery boundary condition at the layer-
substrate interface, whereas a thin layer of air is assumed to exist between the layer and substrate in case of delamination.
0 6 0.4 > 0 2 - - Good bond .. . . Disbond f (MHz)
Fig. 9. Calculated and measured l - ( f ) curves for 0.6-mm copper layer on steel with good bond and disbond using a lens with unblocked central part.
All the presented curves are obtained by normalizing the transducer output by the amplitude of the normal reflection signal from the central part. Since the normalization is done both on measured and calculated data, the frequency response of the transducer is eliminated.
Inversion of I,’(Z) [6] of the conventional acoustic micro- scope results in the reflection coefficient that in turn gives information about the critical angles. To be able to perform the V(Zj inversion operation, the phase of the received signal is necessary, but it is difficult to obtain. On the other hand, the critical angle information is available from the V ( f ) curves directly without a need for inversion. The V ( f ) curves result in peaks at positions corresponding to different Lamb wave modes. The positions of the peaks are most affected by the nature of the bond (good-bond/disbond/delamination) and by the shear elastic constant and density of the layer. It can be shown via simulation of L’(f) curves at 40 dB signal to noise ratio, it is possible to detect 0.01% perturbation in shear wave velocity of the layer material.
VII. CONCLUSION
The Lamb wave lens can complement the conventional
lens in acoustic microscopes for some applications due to its inherent ability to focus waves in a subsurface layer with a high efficiency. The new lens is suited to image layered structures with little lateral variation. To use such a lens, the acoustic microscope must have the ability to vary its operation frequency. The frequency must be tuned to excite a suitable Lamb wave mode. This new lens does not have a critical focal plane as the spherical lenses have. The only requirement is to keep the distance to the object below a certain limit. However, the parallelism of the lens aperture and the object surface is critically important.
V(2)
characterization using this lens is more sensitive to that achievable by spherical lenses. Typically, the improve- ment in sensitivity is more than an order of magnitude. In thisATALAR er al.: A LAMB WAVE LENS FOR ACOUSTIC MICROSCOPY 667
paper, a new and very sensitive material property and interface measurement method for layered materials is also proposed. The method involves producing a V ( f ) curve using Lamb
wave lens for the material under investigation, which provides the dispersion characteristics of the supported modes. This measurement is simple and fast, requiring only a frequency scan.
The Lamb wave lens is completely compatible with the ex- isting manufacturing technology of the conventional acoustic lenses. Because of the simplicity of manufacturing a conical surface, it is plausible to build Lamb wave lenses with very
[IS] S. Aytcr, “Focusing surface waves using conical transducers,” in Proc. IEEE Lrliruson. S~wfp.. 1987, pp. 301-304.
[ I h ] J . Kushibiki. H. Takahashi, T. Kobayashi. and N. Chubachi. “Quantita- tive evaluation of elastic properties of LiTaO.< crystals by line-focus- beam acoustic microscopy.” Appl. Ptrys. L x t t . , vol. 58, pp. 893-895, 1991.
1171 A. Atalar, H. Kbymen, and L. Degertekin, “Characterization of layered materials by the Lamb wave lens,” in Proc. /€E€ Lrliru.son. Sytnu., 1990, [I81 C-H. Chou and B. T Khuri-Yakub, “Acoustic microscopy with shear
pp. 359-362.
wave transducers,’’ in Proc. f E E E t i l m u o t l . .Yymp., 1987, pp. 813-816.
small diameters. For such small lenses the path that must be
traveled in the highly lossy liquid medium is quite small, .4bdullah Atalar (M388-SM’90) was born in Gaziantep, Turkey, in 1954. He received the B.S.
enabling the focusing system to work at very high frequencies, degree from Middle East Technical University,
possibly at frequencies not achievable with the conventional Ankara, Turkey. i n 1974, and the M S . and Ph.D.
acoustic microscope lens. degrees from Stanford University, Stanford. CA. in 1976 and 1978. respectively, all in electrical
The described lens geometry is not sensitive to the engineering. His the\is work concerned reflection
anisotropy of the object. A version of this lens sensitive to acoustic microscopy.
anisotropy can be constructed by making a straight groove From 1978 to 1980, he was a Postdoctoral
instead of a conical recess. The cross section of the groove
Fellow and later an Engineering Research Associate at Stanford University, continuing his work on must be identical to that shown i n Fig. 2. In this case, t h e leaky acoustic microscopy. For eight months he was with HCWlett Packard waves will propagate in only one direction in the anisotropic Laboratories, Palo Alto, CA. where From to 198h, he was on the he engaged in faculty of the Middle photoacoustics research. East Technical
obiect. The J~ relation of this lens to the conical Beornetrv ” Univer\itv as an Assistant Professor. While o n leave from 1982 to 1983.
is analogous to the relation of the line-focus-bearn acoustic he worked at Ernst Leitz Wetzlar, Germany, where he was involved i n the development of the commercial acouytic microscope. In 1986, he joined microscope lens to the spherical lens. Also utilization of a Bilkenl as t h e Chairman of the Deoartment of Electrical and
shear wave transducer in a lens with present geometry may Electronic\ Engineering and founded the Department, where he is currently increase sensitivity to anisotropy, as suggested with a spherical a Professor. His current research intermts include acoustic imaging, linear lens [18]. acoustic\. and computer-aided awarded the 13. Tugas Foundation Award design in electrical engineering. of TUBiTAK, Turkey, for He was his
contribtltions to acoustic microscopy. REFERENCES
P. A. Reinholdtwn. C-H. Chou, and B. T. Khuri-Yakuh. ”Quantitative acoustic microscopy using amplitude and phase imaging,” i n Proc. ILEFI
Lrltrusou. Synzp.. 1987, pp. 807-8 1 I .
B. Derby, G. A. D. Briggs, and E. R. Wallach, “Non-destructive testing and acoustic microscopy of diffusion bond\.” .L Alotrr. Sei., \ d . 18, 1983.
S. W. Meeks, D. Peter, D. Home, K. Young, and V . Nnvotny, “Residual stress mapping with a scanning phase-meawring acoustic microwqx.“ in Proc. l E E E L‘liruson. Syrnp., 1989. pp. XOY-XI:!
G. C. Smith and M. G. Gee. “Observation of a sub-surface defect in sapphire by Rayleigh wave reflection in the \canning acoustic microscope,” J , Murer. Sei. [,err., vol. 5 , pp. 1133-1 134, lY86. G . W . Farnell and C. K. Jen, “Excitation o f acoustic beams in layered substrates,” Rev. Phy.,. Appl., vol. 20, pp. 305-310, 19x5.
K. K. Liang, G. S. Kino, and B. T. Khuri-Yakub. ”Material character- ization by inversion of l .( Z).” l E E E T r a m .Sonic\ Ultrcrson.. vol. 32, pp. 213-224, 1985.
D. B, Bogy and S. M. Gracewski. “Reflection coefficient for plane uaves 50, pp. 405414, 1983
in a fluid incident on a layered elastic half-space,” J . Appl. Mech.. vol. P. B. Nagy and L. Adler “Acoustic material signature from frequency analysis,” J . ilppl. Phys., vol. 67, pp. 3 8 7 6 3 8 7 8 . 1990.
D. E. Chimenti, A. H. Nayfeh, and D. L. Butler, “Leaky Rayleigh wave5 on a layered halfspace.”.!. Appl. Pltys., vol. 53, pp. 170-176, 1982.
D. E. Chimenti and A. H. Nayfeh. “Leaky Lamb waves in fibrous composite laminates,”.!. Appl. Phys.. vol. 58, pp, 45314538. 1985. T. Kundu, “On the nonspecular reflection of bounded acoustic beams,”
J . Acoust. Soc. Am., vol. 83, pp. 18-24, 1988.
H. L. Bertoni and T. Tamir, “Characteristics of wedge transducers for acoustic surface waves,” IEEE Trcrrrs Sorric.s Ufrrason.. vol. 22. PD.
4 1 5 4 2 0 , 1975.
A. H. Navfeh and D. E. Chimenti. ‘.Reflection of finite acoustic beams
1.
from loaded and stiffened half-spaces,”J. Acousr. Soc. Am., vol. 75, pp. 1360-1368, 1984.
A. Atalar and H. Kiiymen, “Use of a conical asicon as a surface acoustic wave focusing device,” IEEE Trunr. tiltruson.. Ferrock., Freq. Corltr.,
vol. 34, pp. 53-63, 1987.
Hayrettin Koymen (S’74-M’76-M’87-SM’Yl)
was born in Ankara, Turkey. on June 7 , 1052. He received the R.%. and M.Sc. degree\ from Middle Ea\t Technical Univer\ity, Ankara. Turkey, in 1973 and 1976, respectively. and the Ph.D. degree from the University of Birmingham, Birmingham. England. in 1979, all in electrical engineering.
He became a faculty member of the Middle East ’ ~ Technical University in 1979. Until 1982 his work
involved underwater acoustics and oceanographic instrumentation: since 1982, his work involved physiological signal acquisition and processing, medical ultrasonics a n d ultrasonic nondestructive evaluation. In 1990, he joined the f ~ u l t y of Bilkent University, Ankara, where he is n o w a Professor i n the Department of Electrical and Electronics Engineering. Hi.; current research intere\ts are per.;onal computer-based hiomedical signal acquisition and procesing. medical imaging, finite amplitude effects i n medical ultrasonics, and acoustic microscopy using leaky waves in layered media.
i .
F. Levent Degertekin was born in Diyarhaklr,
Turkey, in 1968. He received the B.S. de- gree from the Middle East Technical University, Ankara. Turkey, and the M S . degree from Bilkent University. Ankara, Turkey, in 1989 and 1991, respectively, both in electrical engineering. He is currently working toward the Ph.D. degree i n electrical and electronics engineering at Bilkent University. Nhere he has been a research assistant since 1989. His present research interests include acoustical imaging and nondestructive evaluation of layered materials