integrative analysis of complex cancer genomics
and clinical Profiles Using the cBioPortal
Jianjiong gao,1 Bülent arman aksoy,1 Ugur Dogrusoz,2 gideon Dresdner,1 Benjamin gross,1 S. Onur Sumer,1 Yichao Sun,1 anders Jacobsen,1 Rileen Sinha,1 erik larsson,3 ethan cerami,1,4 chris Sander,1 nikolaus Schultz1
correspondence should be addressed to [email protected]; user support is available at [email protected]
1computational Biology center, Memorial Sloan-Kettering cancer center, new York, nY 10065, USa. 2computer engineering Department, Bilkent University, 06800 ankara, Turkey. 3institute of Biomedicine, Department of Medical Biochemistry and cell Biology, University of gothenburg, S-405 30 gothenburg, Sweden. 4Blueprint Medicines, cambridge, Ma 02142, USa.
inTRODUcTiOn
eQUiPMenT
inSTRUcTiOnS
Querying individual cancer Studies
Viewing and interpreting the Results
Performing cross-cancer Queries
Viewing cancer Study Summary Data
Viewing genomic alterations in a Single Tumor: Patient View
Programmatic access
nOTeS anD ReMaRKS
complementary Data Sources and analysis Options
Future Directions
on September 28, 2017
http://stke.sciencemag.org/
inTRODUcTiOn
Large-scale cancer genomics projects, such as The Cancer Genome Atlas (TCGA) and the International Cancer Genome Consortium (ICGC) (1), are generating an overwhelming amount of cancer genomics data from multiple different technical platforms, making it increasingly challenging to perform data integration, exploration, and analytics, especially for scientists without a computational back-ground. The cBioPortal for Cancer Genomics (http://cbioportal.org) (2) was specifically designed to lower the barriers of access to the complex data sets and thereby accelerate the translation of genomic data into new biological insights, therapies, and clinical trials. The portal facilitates the exploration of multidimensional cancer genomics data by allowing visualization and analysis across genes, sam-ples, and data types. Users can visualize patterns of gene alterations across samples in a cancer study, compare gene alteration frequencies across multiple cancer studies, or summarize all relevant genomic alterations in an individual tumor sample. The portal also supports biological pathway exploration, survival analysis, analysis of mutual exclusivity between genomic alterations, selective data download, programmatic access, and publication-quality summary visualization.
Genomic data types integrated by cBioPortal include somatic mutations, DNA copy-number alterations (CNAs), mRNA and microRNA (miRNA) expression, DNA methylation, protein abundance, and phosphoprotein abundance. Currently, the portal contains data sets from 10 published cancer studies (3–10), including the Cancer Cell Line Encyclopedia (CCLE) (10), and more than 20 studies that are currently in the TCGA pipeline (table S1). For each tumor sample, data may be available from multiple genomic analysis platforms. The portal’s simplifying concept is to integrate multiple data types at the gene level and then query for the presence of specific biological events in each sample (for example, genetic mutation, gene homozygous deletion, gene amplification, increased or decreased mRNA or miRNA expression, and increased or decreased protein abundance). This allows users to query genetic alterations per gene and sample and test hypotheses regarding recurrence and genomic context of gene alteration events in specific cancers.
eQUiPMenT
A personal computer or computing device with an Internet browser with Javascript enabled
Note: We support and test the following browsers: Google Chrome, Firefox 3.0 and above, Safari, and Internet Explorer 9.0 and above.
Adobe Flash player
Note: This browser plug-in is required for visualizing networks on the network analysis tab. It can be downloaded from http://get. adobe.com/flashplayer/. This requirement is to be removed by mid-2013.
Java Runtime Environment
Note: This application is needed for launching the Integrative Genomics Viewer (IGV). It can be downloaded from http://www.java. com/getjava/.
Adobe PDF Reader
Note: This is necessary for viewing the Pathology Reports and for viewing many of the downloadable files. It can be downloaded from http://get.adobe.com/reader/.
Vector graphic editor
Note: This is necessary for visualizing and editing the SVG file of OncoPrints downloaded from the cBioPortal. Examples of software supporting SVG are Adobe Illustrator (http://www.adobe.com/products/illustrator.html) and Inkscape (http://inkscape.org/).
The cBioPortal for cancer genomics (http://cbioportal.org) provides a Web resource for exploring, visualizing, and ana-lyzing multidimensional cancer genomics data. The portal reduces molecular profiling data from cancer tissues and cell lines into readily understandable genetic, epigenetic, gene expression, and proteomic events. The query interface combined with customized data storage enables researchers to interactively explore genetic alterations across samples, genes, and pathways and, when available in the underlying data, to link these to clinical outcomes. The portal provides graphical summaries of gene-level data from multiple platforms, network visualization and analysis, survival analysis, patient-centric queries, and software programmatic access. The intuitive Web interface of the portal makes complex can-cer genomics profiles accessible to researchers and clinicians without requiring bioinformatics expertise, thus facilitat-ing biological discoveries. Here, we provide a practical guide to the analysis and visualization features of the cBioPortal for cancer genomics.
on September 28, 2017
http://stke.sciencemag.org/
inSTRUcTiOnS
The genomic data sets in the cBioPortal for Cancer Genomics (http://cbioportal.org) can be queried or downloaded by using an interactive Web interface or can be accessed programmatically. Users have the option of querying a single cancer study or querying across cancer studies. They can also view relevant genomic alterations in individual cancer samples.
Querying individual cancer Studies
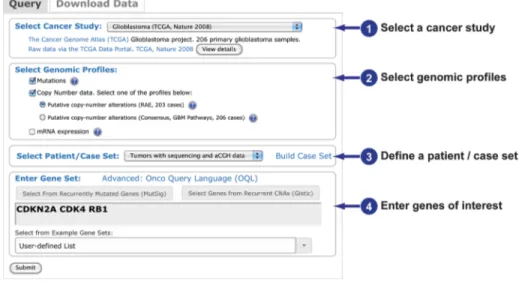
In a single-cancer query, users can explore and visualize genomic alterations in a selected set of genes, including the relationship between altera-tions in these genes across all selected samples and the relaaltera-tionship between different data types for the same gene. There are four steps to perform-ing a query of a sperform-ingle-cancer study (Fig. 1). The general process is described along with the specific query used to generate the results shown. Users can select from one of more than 25 cancer studies. When selecting genomic profiles, mutations and CNAs are specified by default. When available, relative mRNA or miRNA expression or relative protein and phosphoprotein abundance data can also be selected. Protein and phos-phoprotein data are based on reverse phase protein array (RPPA) experiments. For mRNA or miRNA data and protein and phosphos-phoprotein data,
z scores are precomputed from the expression values, and users can specify the threshold or use the default setting (2 SDs from the mean). The z
scores for mRNA expression are determined for each sample by comparing a gene’s mRNA expression to the distribution in a reference popula-tion that represents typical expression for the gene. If expression data are available for normal adjacent tissues, those data are used as the reference population; otherwise, expression values of all tumors that are diploid for the gene in question in the cancer study are used. The z scores for miRNA expression or protein abundance are determined for each sample by comparing with all samples with miRNA or protein data, respectively. When defining case sets for analysis, the default option is set to match the selected genomic profiles. For example, cases with sequencing data will be selected if querying for mutations only. However, the user can change this selection by choosing from the drop-down list of case sets defined by the available data (for example, tumors with mutations, CNA data, gene expression, or RPPA data) or by known tumor subtypes. Users may also input specific cases of interest by selecting “User-Defined Case List” or build a customized case set based on clinical attributes in the “Build Case Set” dialog.
When entering gene sets for analysis, users can manually enter HUGO gene symbols, Entrez Gene identifiers, and gene aliases or select from predefined gene sets or pathways of interest. If lists of recurrently altered genes are available for a given cancer study—for example, recurrently mutated genes from MutSig or genes with recurrent CNAs from GISTIC (11)—then users can also select genes from these lists and either build the gene set by using these lists or add to the set of manually entered genes by selecting from these lists.
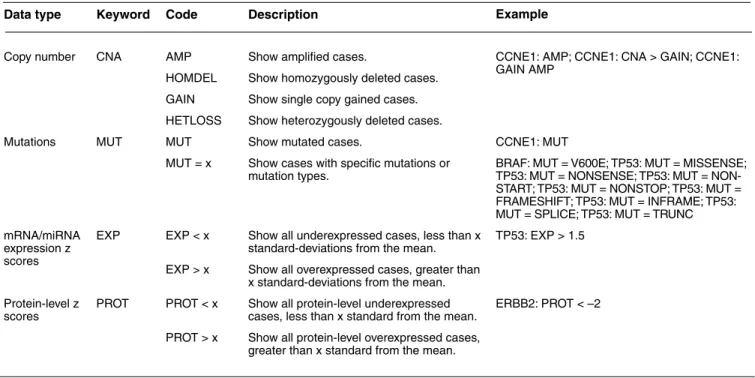
The Onco Query Language (OQL) can be used to refine the query (Table 1). OQL can be used in single- and cross-cancer queries. Once OQL is used in the initial query, this refinement is reflected in results, such as the OncoPrint. Users can define alterations for four data types: CNAs, mutations, mRNA or miRNA expression changes, and protein or phosphoprotein abundance changes (Table 1). CNA and mutation events have discrete settings, whereas mRNA, miRNA, and protein abundance events have continuous settings. Expression values are converted to z scores to facilitate comparison and the definition of alteration thresholds.
Table 1. OQl data types and functionality.
Data type Keyword code Description example
Copy number CNA AMP Show amplified cases. CCNE1: AMP; CCNE1: CNA > GAIN; CCNE1:
GAIN AMP HOMDEL Show homozygously deleted cases.
GAIN Show single copy gained cases. HETLOSS Show heterozygously deleted cases.
Mutations MUT MUT Show mutated cases. CCNE1: MUT
MUT = x Show cases with specific mutations or
mutation types. BRAF: MUT = V600E; TP53: MUT = MISSENSE; TP53: MUT = NONSENSE; TP53: MUT = NON-START; TP53: MUT = NONSTOP; TP53: MUT = FRAMESHIFT; TP53: MUT = INFRAME; TP53: MUT = SPLICE; TP53: MUT = TRUNC mRNA/miRNA expression z scores
EXP EXP < x Show all underexpressed cases, less than x
standard-deviations from the mean. TP53: EXP > 1.5 EXP > x Show all overexpressed cases, greater than
x standard-deviations from the mean. Protein-level z
scores PROT PROT < x Show all protein-level underexpressed cases, less than x standard from the mean. ERBB2: PROT < –2 PROT > x Show all protein-level overexpressed cases,
greater than x standard from the mean.
on September 28, 2017
http://stke.sciencemag.org/
1. General: Select a cancer study from the drop-down menu. Specific example: Select “Gliobastoma (TCGA, Nature 2008).” 2. General: Select the genomic profiles.
Specific example: Use the default setting with “Mutations” checked and “Copy Number data” checked and “Putative copy-number alterations (RAE, 203 cases)” selected.
Note: Mutations and copy-number alterations are selected by default. Other options are presented when the data are available. For mRNA or miRNA data and protein and phosphoprotein data, the default z score threshold can be optionally modified to a user-defined positive value. When both microarray and RNA-Seq data are available, the RNA-Seq data set is preferred.
3. General: Select a patient/case set from the drop-down menu or using the options presented in “Build Case Set.” Specific example: Select “Tumors with sequence and aCGH data” from the drop-down menu.
Note: To enter a user-defined case list, this option must be selected from the drop-down menu; then, enter the case ID separated by a space in the box that appears.
4. General: Enter genes of interest manually or by selecting from predefined lists.
Specific example: Enter “CDKN2A CDK4 RB1” with spaces separating the genes and without any punctuation.
Note: Queries may be refined using Onco Query Language (OQL) (Table 1).
5. General: Select the “Download Data” tab and select the desired data option to obtain a copy of the data in text format.
Specific example: Perform the following query from the Download Data tab: “CDKN2A CDK4 RB1” Select “Gliobastoma (TCGA, Nature 2008),” “Mutations,” and “CDKN2A CDK4 RB1,” and press submit. Copy and paste the displayed data into a spreadsheet or choose “Save as” from the File menu in the browser.
Note: Only data from one genomic profile can be selected for each download query. Viewing and interpreting the Results
On the basis of the query criteria, the portal classifies each gene in each sample as altered or not altered, and this classification is used for all analysis and visualizations in the portal, each of which is represented on a separate tab. We describe the results shown in each tab below, using example queries. The query parameters representing the first four steps outlined in the previous section are shown on the figure associated with each example.
Fig. 1. Performing a query of a single cancer study. The four steps to query genomic data in the cBioPortal for Cancer Genomics for a single cancer study. The query page is accessed from the site’s home page. All queries must include at least one gene. The query shown is the one used to generate the results shown in Figs. 2 and 3. on September 28, 2017 http://stke.sciencemag.org/ Downloaded from
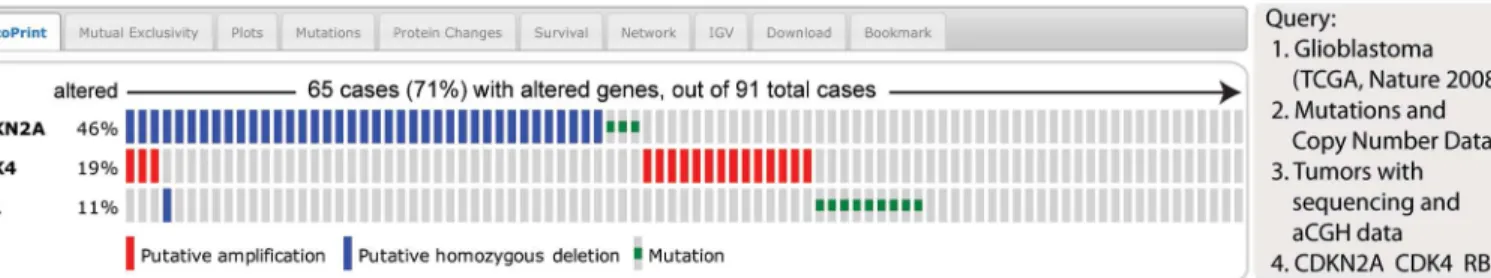
Results Tab 1: OncoPrint
An OncoPrint is a concise and compact graphical summary of genomic alterations in multiple genes across a set of tumor samples. Rows represent genes, and columns represent samples. Glyphs and color coding are used to summarize distinct genomic alterations including mutations, CNAs (amplifications and homozygous deletions), and changes in gene expression or protein abundance. Additional details are available by mousing over the event indicated on the gene and include the case ID (each case represents a patient sample or cell line), linked to the patient view page. For mutation events, this also displays amino acid changes. By default, cases are sorted according to alterations. Users can also restore original case orders (alphabetical order by case ID for a predefined case lists, or the same order for a customized case list). Users also have the option to remove unaltered cases from the visualization. By visualizing gene alterations across a set of cases, OncoPrints help identify trends such as mutual exclusivity or co-occurrence between genes within a gene set.
In addition to the OncoPrint, this results tab also includes information about the genes queried that is available in the Sanger Cancer Gene Census and links to the Gene database in NCBI.
We use the OncoPrint from a query for alterations in the retinoblastoma (RB) pathway genes CDKN2A (encoding the cyclin-dependent ki-nase inhibitor p16), CDK4 (encoding cyclin-dependent kiki-nase 4), and RB1 in glioblastoma multiforme (GBM) as an example (Fig. 2). From the OncoPrint, 65 cases (71%) have an alteration in at least one of the three genes, with the frequency of alteration in each of the three selected genes shown. For CDKN2A, most of the alterations are homozygous deletions, and there are a few mutations. The alterations in CDK4 are amplifications. Events associated with RB1 included a deletion and several mutations (3). The alterations in these three genes are distributed in a nearly mutually exclusive way across samples, which can be statistically analyzed and visualized with the Mutual Exclusivity tab.
1. Perform the query as specified in Fig. 2. Once the “submit” button is pressed, the OncoPrint result is displayed automatically. 2. Use the horizontal scroll bar if the genes do not fit the window.
3. To make an OncoPrint more compact, there are three options available from the “Customize” button: (i) scale the OncoPrint by using the “Zoom” bar; (ii) remove cases without an alteration by selecting “Remove Unaltered Cases”; and (iii) select “Remove Whitespace” to eliminate the gaps between samples.
4. To restore the original case order (alphabetically by case ID or as defined by the user in the original query), select “Restore Case Order” in the “Customize” options.
5. To export the OncoPrint, choose to download the OncoPrint as an XML file in scalable vector graphic (SVG) format by pressing the SVG button.
6. To obtain additional information, mouse over the indicated alteration on the gene. 7. To modify or start a query, choose “Modify Query” above the tabs for the results.
Results Tab 2: Mutual Exclusivity
Biological processes or pathways in cancer are often deregulated through different genes or by multiple different mechanisms. The concept of mutual exclusivity can be exploited to identify previously unknown mechanisms that contribute to oncogenesis and cancer progression (12). In mutual exclusivity, events in genes associated with a specific cancer tend to be mutually exclusive across a set of tumors—that is, each tumor is likely to have only one of the genetic events. The opposite situation (co-occurrence) is when genetic al-terations occur in multiple genes in the same cancer sample. The portal computes a set of simple statistics to identify patterns of mutual exclusivity or co-occurrence. For each pair of query genes (G1 and G2), the portal calculates an odds ratio (OR) (Eq. 1) that indicates the likelihood that the events in the two genes are mutually exclusive or co-occurrent across the selected cases:
Fig. 2. The OncoPrint tab. The example shows a visual summary of the different mechanisms of RB pathway alteration across a set of glioblastoma samples based on a query of the three genes CDKN2A, CDK4, and RB1. The OncoPrint tab summarizes genomic altera-tions in all queried genes across a sample set. Each row represents a gene, and each column represents a tumor sample. Red bars indicate gene amplifications, blue bars are homozygous deletions, and green squares are nonsynonymous mutations. on September 28, 2017 http://stke.sciencemag.org/ Downloaded from
OR = (A * D) / (B * C) (1) Where A = number of cases altered in both genes; B = number of cases altered in G1 but not G2; C = number of cases altered in G2 but not G1; and D = number of cases altered in neither genes.
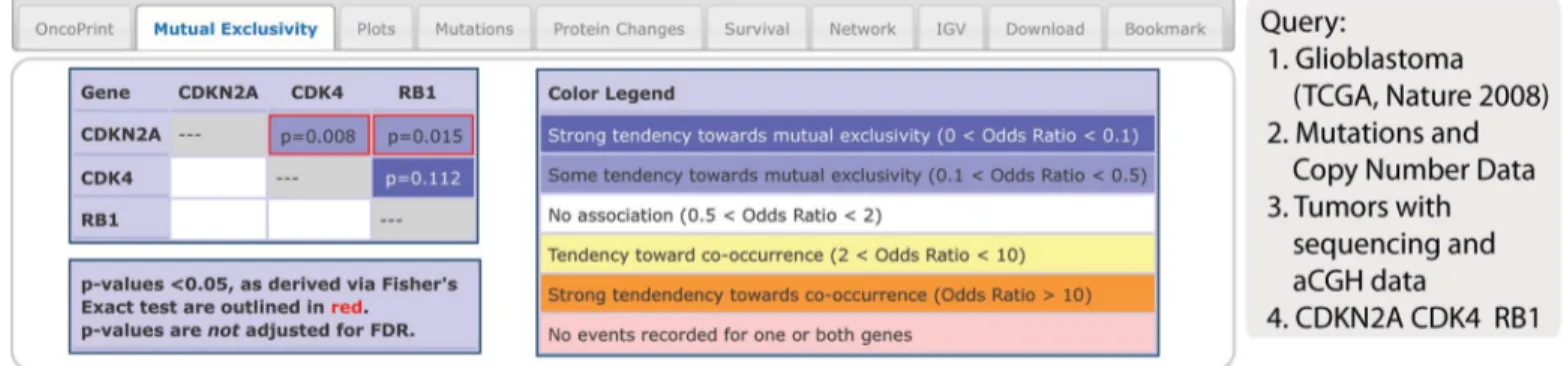
It then assigns each pair to one of five categories that are indicative of a tendency toward mutual exclusivity, of a tendency toward co-occurrence, or of no association. A legend is provided with the analysis. To determine whether the identified relationship is significant for each gene pair, the portal performs a Fisher’s exact test.
Using the same query used for describing OncoPrints, the mutual exclusivity analysis shows that events in the three selected genes tended to occur in a mutually exclusive way, but the pattern was only statistically significant for CDKN2A and CDK4, and for CDKN2A and RB1, but not for CDK4 and RB1, which may be due to the small sample size (Fig. 3). This fits with what is known about RB signaling in GBM, which can be deactivated by inactivation of RB1 itself (through mutation or deletion), by activation of CDK4 (a CDK that inhibits RB1 activity) through amplification, or by inactivation of the CDK inhibitor p16, which is encoded by CDKN2A, through deletion or mutation. Thus, a single alteration in one of these genes is sufficient to deactivate the pathway, and this is what the mutual exclusivity analysis showed.
1. Perform the query as specified in Fig. 3. Once the “submit” button is pressed, the OncoPrint result is displayed automatically. 2. Select the Mutual Exclusivity tab.
Note: This tab will only show if more than one gene is selected in the query.
Results Tab 3: Correlation Plots
The cBioPortal offers several different ways of visualizing discrete genetic events (CNAs or mutations) and continuous events, such as data regarding mRNA or protein abundance, or DNA methylation.
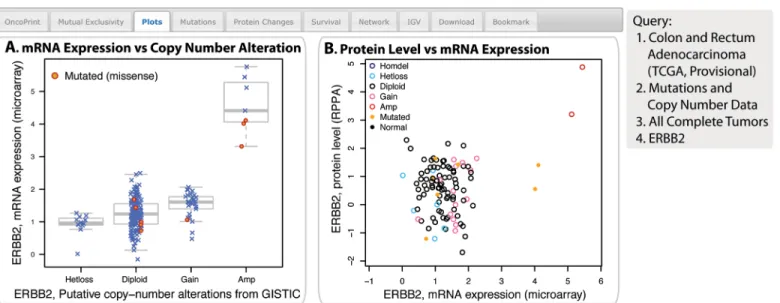
For each gene specified in the query, the portal can generate various plots, depending on the data available. The mRNA versus copy-number option displays a box-and-whisker plot to show mRNA expression from user-selected data sources of a gene plotted in relation to its copy-number status in each sample. Copy-number status can be homozygously deleted, heterozygously deleted, diploid, gained (meaning an amplification event with relatively few copies), or amplified (meaning an amplification event with many copies). The mRNA-versus-DNA methylation option displays a scatter plot of mRNA expression compared with DNA methylation data of a gene across all selected samples. A methylation beta-value is an estimate for the methylation level of a CpG locus using the ratio of intensities between methylated and unmethylated alleles. The RPPA protein level versus mRNA option displays a scatter plot of protein abundance compared with mRNA abundance for a gene across all selected samples. Genes and data types are selected by using drop-down menus, and only those options for which data are available are provided in the menus. All plots can be exported as PDF documents for use in publications.
The example query to illustrate this type of analysis is a query of ERBB2 (a known proto-oncogene encoding an epidermal growth factor receptor) in colon and rectum adenocarcinoma. ERBB2 is amplified in a subset of colorectal cancer samples (8). The cBioPortal results show that ERBB2 mRNA is increased in the samples in which ERBB2 is amplified (Fig. 4A) and that the tumors with the highest amount of ERBB2 mRNA had the highest amount of ERBB2 protein (Fig. 4B).
Fig. 3. The Mutual exclusivity tab. The example shows that genes that alter RB signaling in glioblastoma have a tendency toward mutual exclusivity. This tab provides summary statistics on mutual exclusiv-ity and co-occurrence of genomic alterations in each pair of query genes. In this example, all three pairs have a tendency toward mutual exclusivity. Although the CDK4-RB1 pair has the strongest tendency toward mutual exclusivity (dark blue background), the relationship is not statistically significant (P = 0.11). The mutual exclusivity is signifi-cant for the other two gene pairs (P < 0.05, red outline). The P values are determined by a Fisher’s exact test with the null hypothesis that the frequency of occurrence of a pair of alterations in two genes is proportional to their uncorrelated occurrence in each gene. on September 28, 2017 http://stke.sciencemag.org/ Downloaded from
1. Perform the query shown in Fig. 4. Once the “submit” button is pressed, the OncoPrint result is displayed automatically. 2. Select the Plots tab.
3. Select “mRNA expression (microarray)” from the first Data Types menu.
4. Select “Putative copy-number alternations from GISTIC” from the second Data Types menu. 5. Select “mRNA v. Copy Number” from the Plot Type menu.
6. Press the arrow button to generate the graph shown in Fig. 4A. 7. To export as a PDF, click the PDF link at the top near the graph title. 8. Select “RPPA protein level v. mRNA” from the Plot Type menu. 9. Press the arrow button to generate the graph shown in Fig. 4B.
Note: If a combination that cannot be plotted is selected, an error message is displayed.
Results Tab 4: Mutations
The Mutations tab provides details as both a graphical summary and a customizable table about all nonsynonymous mutations identified in each query gene. The graphical summary shows the position and frequency of all mutations in the context of Pfam protein domains (13) encoded by the canonical gene isoform. All DNA mutations are standardized to the canonical RefSeq isoform (using Oncotator, http://www.broadinstitute.org/oncotator/). When a DNA mutation only affects noncanonical isoforms, the mutations are not included in the graphical summary. Future versions of the portal will provide this information in a separate table.
Below the graphical summary is a table of all nonsynonymous mutations. This table, which can be sorted and filtered, provides the following information if the data are available: case ID for each sample (hyperlinked to the patient view page of the specific sample containing the muta-tion); amino acid change; type of mutations (missense, nonsense, splice site, frameshift insertion or deletion, in-frame insertion or deletion, nonstop, nonstart); number of mutations at this position in COSMIC (Catalogue Of Somatic Mutations In Cancer) (14); predicted functional impact of missense mutations [with hyperlinks to Mutation Assessor (15) for the specified mutation and a multiple sequence alignment]; link to a 3D structure with the mutation highlighted (with hyperlinks to Mutation Assessor); mutation status (somatic or germline–germline muta-tions are currently only provided for BRCA1 and BRCA2 in some studies); validation status (valid or unknown); the sequencing center where the sample was sequenced and the mutation identified; variant allele frequency in the tumor; variant allele frequency in the matched normal sample; exact genomic position (chromosome, start, end, reference allele, variant allele); variant and reference allele counts (the number of variant and reference alleles found in the sequencing results of tumor and normal samples); and information about the affected isoform.
Fig. 4. The Plots tab. The example shows ERBB2 mRNA expres- sion is increased in samples with DNA amplification, and ERBB2 pro-tein abundance is higher in samples with increased mRNA. (a) A plot showing the relationship between ERBB2 mRNA abundance and CNA in the ERBB2 gene in tumors from the selected cancer study. The “x”s indicate individual tumors, and the circles indicate tumors with missense mutations. (B) A plot showing the relationship between the abudance of the ERBB2 protein and mRNA in samples from the selected cancer study. Homdel, homozygously deleted; Hetloss, het-erozygously deleted; Diploid, two alleles present; Gain, low-level gene amplification event; Amp, high-level gene amplification event; Mutated, nonsynonymous mutation; Normal, no mutation or CNA present. on September 28, 2017 http://stke.sciencemag.org/ Downloaded from
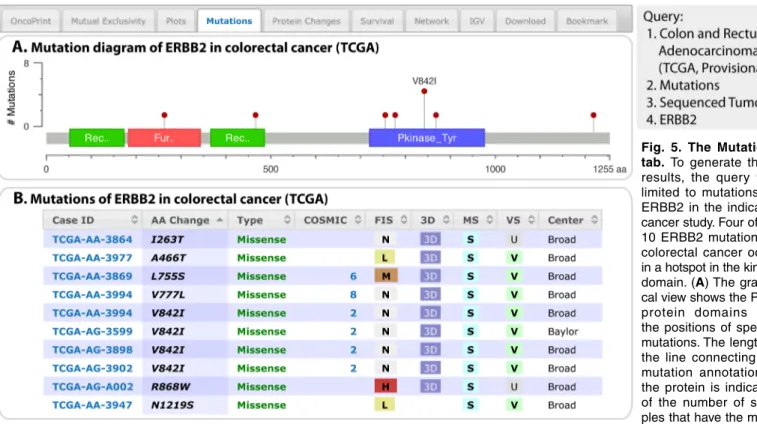
The last three are not shown by default but may be displayed. Users can perform a search for any text in the table with the search option. The example query to illustrate this type of analysis is a query of ERBB2 in colon and rectum adenocarcinoma using only sequenced tumors (Fig. 5). The graphical summary of the mutations associated with this query showed that there are 10 ERBB2 nonsynonymous mutations in colorectal cancer samples, and four of them are V842I in the kinase domain (Fig. 5), suggesting that this is a hotspot for protein activation. From the table, the kinase domain mutations at amino acids 755, 777, and 842 have been observed in several other cancer studies before (6, 8, and 2 COSMIC entries, respectively) (Fig. 5B).
1. Perform the query shown in Fig. 5. 2. Select the Mutations tab.
3. Mouse over the colored regions representing protein domains to view details about the domain and its starting and ending residues in the protein sequence.
4. Mouse over the circles above the protein sequence diagram to see the specific mutation. The height of the line connecting the circle to the protein is indicative of the frequency of the mutation. The most frequent mutation is labeled with its amino acid change.
5. Customize the data displayed in the table using the “Show/hide columns” menu. Select those to display. Deselect those to hide.
Note: The following columns are hidden by default: Exact genomic position (chromosome, start, end, reference, variant allele); variant and reference allele read counts in tumor and normal samples; and information about the affected isoform.
6. Use the up and down arrowheads to sort the data according to the column values.
7. Follow the hyperlinked Case ID to get details about the tumor sample containing the mutation. 8. Use the browser back button to return to the Mutations tab.
9. Mouse over the values in the COSMIC column to get details about the frequency and specific mutations at that residue. 10. Mouse over the values in the FIS column to follow hyperlinks to the Mutation Assessor or a Multiple Sequence Alignment. 11. Click the 3D link to view 3D protein structures with the mutated amino acid highlighted and return to the Mutations tab by using
the browser back button.
12. Enter “V842I” (without quotations) in the search box to display V842I mutations only.
Note: The search options in tables in the cBioPortal support free text search on the table content.
13. Delete the search text to return to the complete results.
Fig. 5. The Mutations tab. To generate these results, the query was limited to mutations for ERBB2 in the indicated cancer study. Four of the 10 ERBB2 mutations in colorectal cancer occur in a hotspot in the kinase domain. ( a) The graphi-cal view shows the Pfam protein domains and the positions of specific mutations. The length of the line connecting the mutation annotation to the protein is indicative of the number of sam- ples that have the muta-tion. The most recurrent mutations are labeled in the graphical view. (B) The tabular view pro- vides additional informa-tion about all mutations in each query gene. on September 28, 2017 http://stke.sciencemag.org/ Downloaded from
Results Tab 5: Protein Changes
Protein and phosphoprotein data are available from the Protein Changes tab. Currently, large-scale proteomics data from the RPPA (16) platform are available in the portal for 12 TCGA cancer studies (table S1). As already described, scatter plots of protein abundance versus mRNA expression for query genes can be generated if both data types are available (Fig. 4B, Plots tab).
For each query, the portal also performs differential analysis for all available RPPA protein data and identifies protein and phosphoprotein events that correlate with genomic alterations in the query genes. It is not necessary to select “RRPA proten/phosphoprotein level” from the query screen. If the data are available, then this analysis can be performed. For each available protein or phosphoprotein, cBioPortal performs a two-sided, two-sample Student’s t test to identify differences in protein abundance between tumor samples that have at least one event (alteration) in one of the query genes, and those that do not. The results are displayed as a list of proteins or phosphoproteins, ranked by their difference in abundance between altered and unaltered samples. The table includes the following information: the target protein recognized by the antibody; the residue phosphorylated or modified (for example, by cleavage); the average protein abundance
z scores in the tumors with alterations and those without (unaltered); the P value; and an option to plot the results, which are shown by
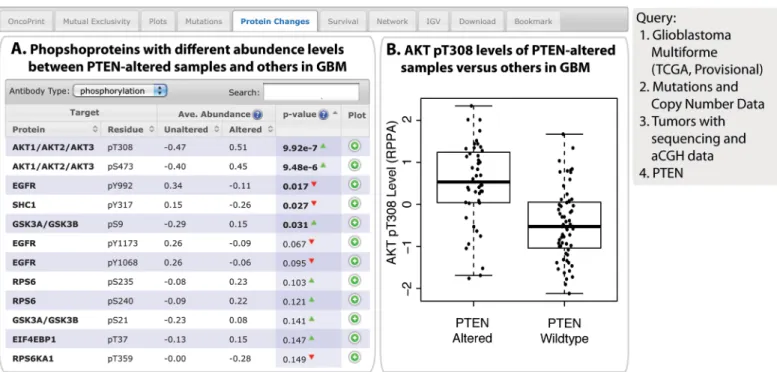
default. The RPPA ID and the absolute difference between the unaltered and altered samples’ average z scores are optional columns. For each protein or phosphoprotein, the z scores of the RRPA data between the unaltered and altered samples can be displayed as a box plot. A query of glioblastoma cancers for mutations and CNAs associated with the tumor suppressor and lipid phosphatase encoded by PTEN illustrate this analysis (Fig. 6). For example, PTEN loss (mutation or copy number deletion) in glioblastoma cancer is tightly correlated with increased phosphorylation of AKT (pT308 and pS473) (Fig. 6).
1. Perform the query shown in Fig. 6. 2. Select the Protein Changes tab.
3. Use the drop-down menu for “Antibody Type” to specify data collected using antibodies that detect the total protein or the phosphoprotein.
4. Customize the data displayed in the table using the “Show/hide columns” menu. Select those to display. Deselect those to hide. 5. Press the + symbol in the Plot column to display the boxplot comparing the z scores for abundance between the samples with
alterations and those without alterations in the queried gene (or genes).
6. Enter “ERBB” (without quotations) in the search box to display ERBB2 and ERBB3 phosphoprotein changes. 7. Delete search text to return to the complete results.
Fig. 6. The Protein changes tab. When available in the cancer study selected, results related to protein or phosphoprotein abundance are provided through this tab. In this example, glioblastoma (GBM) sam-ples with alterations in PTEN have increased phosphorylated AKT. ( a) Phosphoproteins with different amounts when comparing PTEN-altered samples and PTEN-wild-type samples. The list is sorted by P values from a two-sample t-test. (B) Boxplot representation of the relative amount of AKT pT308 in PTEN-altered and PTEN–wild-type samples. This plot is generated by clicking the icon in the Plot column of the tabulated data. on September 28, 2017 http://stke.sciencemag.org/ Downloaded from
Results Tab 6: Survival
If survival data are available, overall survival and disease-free survival differences are computed between tumor samples that have at least one al-teration in one of the query genes and tumor samples that do not. The results are displayed as Kaplan-Meier plots with P values from a logrank test. A query for BRCA1 and BRCA2 mutations in ovarian cancer is used to illustrate these results. The analysis showed a significantly better overall and disease-free survival of patients with either a BRCA1 or BRCA2 mutation (Fig. 7).
1. Perform the query shown in Fig. 7. 2. Select the Survival tab.
3. View the results for overall survival analysis and disease-free survival analysis.
4. Click the PDF link at the top near the title of each graph to download a PDF version of the plot.
Results Tab 7: Network
The Network tab provides interactive analysis and visualization of networks that are altered in cancer. The network consists of pathways and interactions from the Human Reference Protein Database (HPRD) (17), Reactome (18), National Cancer Insititue (NCI)–Nature (19), and the Memorial Sloan-Kettering Cancer Center (MSKCC) Cancer Cell Map (http://cancer.cellmap.org), as derived from the open source Pathway Commons Project (20). By default, the network that is automatically generated contains all neighbors of all query genes. If more than 50 neighbor genes exist in the network, they are ranked by genomic alteration frequency within the selected cancer study, and only the 50 neighbors with the highest alteration frequency in addition to the query genes are shown. This provides an effective means of managing network complexity and automatically highlights the genes most relevant to the cancer type in question. The full, nonpruned network can be downloaded in the SIF (simple integration file) and GraphML formats for visualization and analysis in Cytoscape (21). By default, the portal automatically color codes edges by interaction type and overlays multidimensional genomic data onto each node, highlighting the frequency of alteration by mutation, CNA, and mRNA up- or down-regulation. The data that are shown depend on the settings used in the query and the data that are available for the selected genomic profiles. Various options for filtering the network are available, and the network can be searched by gene symbol. Various options for altering the display of the network and the layout of the network are available. Legends explain-ing the network symbols are provided. Details about the alterations found in the genes and the interactions between the genes are viewed by clicking on the node or the edge, respectively. Interaction types are derived from the BioPAX to SIF inference rules (20). For example, “In Same Component” indicates that Genes A and B are involved in the same biological component, such as a complex. “State Change” indicates that Gene A causes a state change, such as a phosphorylation change, within Gene B. “Other” is used to indicate all other types of inter actions, including protein-protein interactions derived from HPRD. “Targeted by Drug” indicates a drug-target interaction.
The portal contains gene-centric drug-target information from the following resources: DrugBank (22), KEGG Drug (23), NCI Can-cer Drugs (http://www.canCan-cer.gov/canCan-certopics/druginfo/alphalist), and Rask-Andersen et al. (24). Drugs are hidden from the network
Fig. 7. The Survival tab. The example shows the overall survival (a) and the disease-free survival (B) of ovarian cancer patients with or without BRCA1 or BRCA2 mutations. The red curves in the Kaplan-Meier plots includes all tumors with a BRCA1 or BRCA2 germline or somatic mutation, the blue curves includes all samples without a BRCA1 or BRCA2 mutation. on September 28, 2017 http://stke.sciencemag.org/ Downloaded from
display by default but can be added to the network by using the Genes & Drugs menu. Users have the option of displaying U.S. Food and Drug Administration (FDA)–approved drugs, cancer drugs defined by NCI Cancer Drugs, or all drugs targeting the query genes
New networks can be generated by selecting genes in the current network and then submitting those genes as a new query.
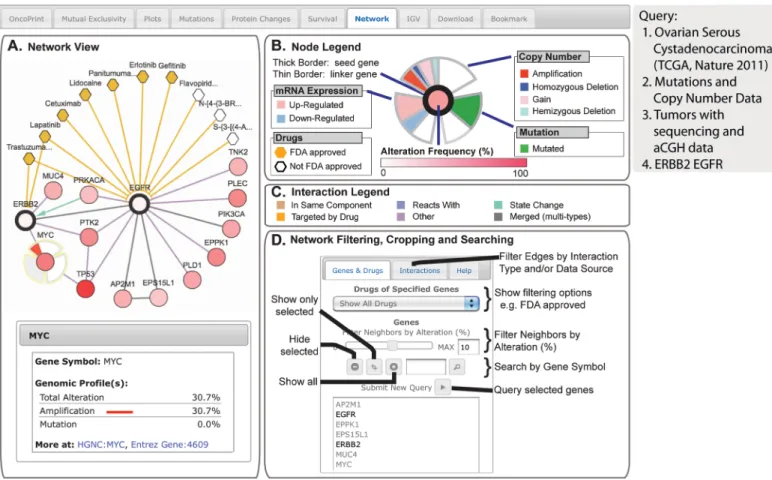
For example, to identify genomic alterations in epidermal growth factor receptor (EGFR) signaling networks in serous ovarian cancer, we used EGFR and ERBB2 as the query genes and explored the resulting network (Fig. 8). Using the color-coding as a guide, connected genes with alterations in this cancer are obvious. For the EFGR and ERBB2 network MYC, a known downstream effector of ERBB2 (25), is colored more intensely red because it is amplified in 30% of the TCGA ovarian cancer samples (Fig. 8).
By adding the drug data, gefitinib and erlotinib, which are tyrosine kinase inhibitors that target the catalytic domain of EGFR, and cetux-imab and trastuzumab, which are monoclonal antibodies that target the extracellular domain of EGFR and ERBB2, respectively, show with edges connecting them to their targets (Fig. 8A) (26, 27).
1. Perform the query shown in Fig. 8. 2. Select the Network tab.
3. Select “Show all Drugs” from the Genes & Drugs tab.
4. From the Layout button, select “Layout Properties” and set the maximum distance to 100 to shorten the length of the edges. 5. From the Layout button, select “Perform Layout.”
Fig. 8. The network tab. The example shows network analysis of EGFR networks in serous ovarian cancer. (a) Network view of the EGFR and ERBB2 neighborhood in serous ovarian cancer (TCGA data set) rendered with Cytoscape Web (34). The query genes, EGFR and ERBB2, are outlined with a thick border, and nearest neighbor genes are color-coded by their alteration frequency in ovarian can-cer. One can display drugs that target EGFR or ERBB2 (hexagons; orange indicates FDA-approved), as well as details about genomic alterations and links to external resources for any gene in the network (bottom left, example MYC). (B) The “Gene Legend” accessed from the “Legend” button. Mousing over any gene in the network or single- clicking the gene displays multidimensional genomic data (copy num-ber, mutation, and mRNA expression) onto all nodes in the network. (c) The “Interaction Legend” accessed from the “Legend” button. Double-clicking the edge displays additional details about the interac-tion between the two nodes. Edges can represent different interaction types (color-coded, such as “reacts with”). (D) Options for filtering, cropping, and searching the network are shown. on September 28, 2017 http://stke.sciencemag.org/ Downloaded from
6. To automatically perform layout changes after filtering the network, select “Auto layout on changes.” 7. Set the “Filter Neighbors by Alteration” to 10.
8. Rearrange nodes by single clicking and repositioning nodes for better layout. 9. Double click the MYC node to view genomic profile details.
10. From the View menu, select “Highlight neighbors,” then select “Remove highlights” to restore all nodes and edges. 11. View and filter interaction types and sources in the Interactions tab.
12. Double click the line connecting Flavopiridol to EGFR to view details.
13. Deselect “Merge Interactions” to show multiple edges of different interaction types between nodes.
14. From the View button, select “Always Show Profile Data” to visualize the alteration frequencies of different genomic profiles around each gene. Deselect to remove.
15. Use the options from the “Topology” button to hide or show only selected nodes or remove disconnected nodes from the network. 16. Select EGFR, ERBB2, and MYC from the Genes & Drugs tab and click the arrow button to submit a new query.
17. Use the browser back button to return to the previous result.
18. Download GraphML or SIF for further analysis in other tools such as Cytoscape.
Results Tabs 8-10: IGV, Download, Bookmark
The Download tab provides all genomic data and per-sample alteration events for download. Users can download tab-delimited text files with all data for the query genes or simply copy event information into an external spreadsheet application for further analysis. The tab-delimited text files are available in two formats: (i) a data matrix of genes (rows) versus samples (columns) and (ii) a transposed matrix of samples (rows) versus genes (columns).
Users can also visualize copy number details by choosing to launch a Web start version of the IGV (28). IGV will open the segmented copy-number data of the current cancer study and display the copy-number status of all query genes.
The Bookmark tab allows users to save or bookmark a specific query (the entire query can be stored in a URL) or share their results with collaborators by generating a short URL (using bit.ly).
1. Perform any query.
2. From the IGV tab, click the “Launch” button to load the data and start the viewer.
Note: The segmented copy-number data for all samples are visualized in IGV, regardless of which cases are selected for querying in the cBioPortal.
3. From the Download tab, to obtain the data in tab-delimited format, click the hyperlinks to view the file desired or open the URL in a new tab or window. Then “select all” to copy into a spreadsheet or select “File,” then “Save Page as” to save as a text file. 4. From the Download tab, to place the data into a spreadsheet or create a file manually, copy and paste the data in each text box
into the program of choice.
5. From the Bookmark tab, right-click (on a PC) the link shown and paste into a browser to create a personal bookmark or to store the link to the specified query.
6. From the Bookmark tab, press the “Shorten URL” button to create a shorter URL for the specified query using bit.ly.
Note: Clicking on the short link or the long version will reload the Bookmark tab page for the specified query. Performing cross-cancer Queries
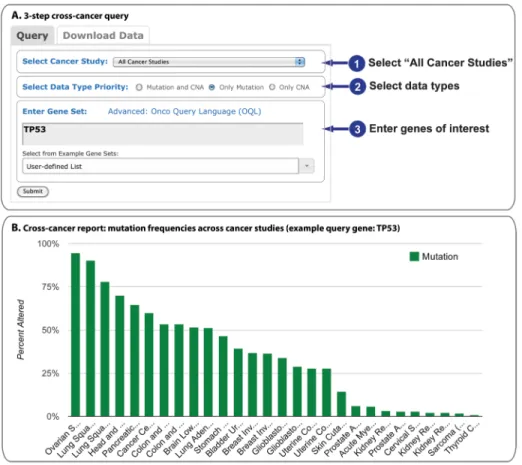
Cross-cancer queries allow users to assess alteration frequencies and mutation data for individual genes or combinations of genes across multiple different cancer types. Cross-cancer queries of mRNA expression or protein abundance data are not yet available. The portal will automatically limit the studies searched to match the query parameters so that only data with mutation information is included for a mutation-only query and only data with CNA information is included for a CNA-only query. The results are presented as a histogram: (i) one showing the frequency of the alterations in the cancers, which can be presented in descending order; or (ii) one showing the absolute number of samples with and without alterations in each cancer study, which can be presented in order of decreasing number of cases with alterations. If multiple genes are queried, then the histograms represent the combined alterations or alteration frequency in all of the selected genes. Details regarding the queried genes in the form of OncoPrints for each cancer study are also provided. This enables the results for each selected gene to be visualized for each cancer study.
on September 28, 2017
http://stke.sciencemag.org/
A cross-cancer query of TP53, which encodes the tumor suppressor and transcriptional regulator p53, illustrates this feature of the cBioPortal (Fig. 9A).
1. General and Specific: Select “All Cancer Studies” from the main query page (Home). 2. General: Select data types.
Specific: Select “Only Mutation.”
Note: This will automatically limit the query to only those cancer studies with mutation data.
3. General: Enter genes of interest. Specific: Enter TP53.
4. Press “Submit.”
5. Press the “Sort” link to organize the data from cancers with the most to those with the least frequently occurring mutations in the query gene (Fig. 9B).
6. To view the data as the absolute number of altered and unaltered samples, select “Show number of altered cases (studies with mutation data)” from the drop-down menu.
7. Mouse over any bar in the histogram to view a summary of the results.
8. Click the arrowhead beside any of the listed cancer studies to view the OncoPrints for the selected genes.
9. Click “View Cancer Study Details” to execute the query in the selected cancer study, which enables access to all of the results listed for a single study query.
10. Use the browser back button to return to the cross-cancer query results. 11. Click the “Export” link to download the data as an SVG file.
Fig. 9. cross-cancer queries. (a) Users initiate a query against all cancer studies in three steps. (B) The results are displayed as a histogram of the alteration frequencies of the query gene (or genes) across cancer studies. The example shows that TP53 mutation frequencies are the highest in squamous cell carcinomas of ovary, lung, and head and neck. on September 28, 2017 http://stke.sciencemag.org/ Downloaded from
Viewing cancer Study Summary Data
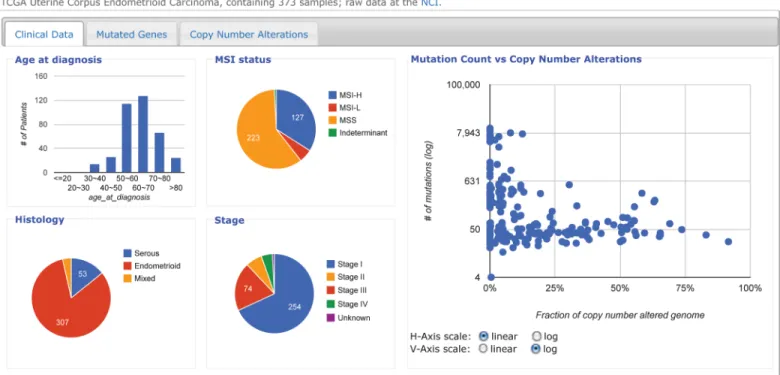
In addition to performing specific gene queries, the cBioPortal provides access to summary information about each cancer study included in the portal. The data available include various clinical details about the patients (survival and age at diagnosis), details about the tumor (histology, stage, grade), and summaries of the genomic data (number of nonsynonymous mutations and fraction of genome altered), de-tails about the recurrently mutated genes, and dede-tails about recurrent CNAs. The clinical data are presented both graphically and in table format (Fig. 10). The mutated gene and CNA data are presented in tables. All tables have a search option. The search queries all content (case IDs, gene symbols, and clinical attributes) in the table containing the searched term or phrase.
1. Select “Uterine Corpus Endometroid Carcinoma (TCGA, Provisional)” from the drop-down menu in the main query page (HOME). 2. Press the “View details” button.
3. Press the “more>>” button to see additional graphical summaries. 4. Mouse over the data in the graphical summaries for details.
5. Sort the data in the clinical data table by clicking the arrowheads next to each column. Use the scroll bars to move up and down or across the table.
6. Search for deceased patients by typing “Deceased” (without quotations) into the search box.
Note: Searching the table of patient data below the graphical summaries will not update the graphical data for the selected patient.
7. Restore the full list of cases by deleting the search text from the search box.
8. Click the tab “Copy Number Alterations” to access a list of chromosomal regions and genes with CNAs. 9. Click the tab “Mutated Genes” to access the list of recurrently mutated genes.
10. Click any of the listed genes to execute a new query for mutations of the selected gene in the selected cancer study. 11. Use the browser back button to return to the cancer study summary, which displays the “Clinical Data” results.
12. Click the “Serous” pie in the Histology pie chart to update other plots and the table to reflect the results of only those cases that are of the serous type.
13. Click the “Clear selection” button to restore all plots and table.
Fig. 10. The cancer study summary view. The example shows an overview of clinical attributes and a scatter plot of mutation count versus fraction of genome altered for each case in the TCGA endometrial cancer study.
on September 28, 2017
http://stke.sciencemag.org/
Viewing genomic alterations in a Single Tumor: Patient View
Because there are potentially hundreds or thousands of genomic alterations in any single tumor sample, it is crucially important to select, for inspection and analysis, alteration events that most likely contribute to oncogenesis or affect the response to therapy. Therefore, in addition to gene-by-gene alteration maps across many samples and across diverse tumor types and the cancer study summary data, users can also view genomic alterations in individual tumor samples in an interactive patient view page. Links to these pages are available from the OncoPrint (through the mouse-over details for each genomic event), the Mutations tab, and the cancer study summary page.
The patient view summarizes and visualizes all relevant data about a tumor, including clinical characteristics, summaries of the extent of mutations and copy-number alterations, as well as details about mutated, amplified, and deleted genes (Fig. 11). The results are displayed in tabbed displays. Genomic alterations in the summary tab are filtered by the following criteria: recurrence of mutations or CNAs across the tumor cohort (from MutSig and GISTIC), mutation occurrence in COSMIC (14), and cancer gene annotation [from resources, such as the Sanger Cancer Gene Census (29)]. The patient view also provides information about drugs that target the altered genes and lists relevant clinical trials from http://www.cancer.gov/.
1. Click the “DATA SETS” button at the top of the navigation pane. 2. Click “Uterine Corpus Endometrioid Carcinoma (TCGA, Provisional).” 3. Enter “TCGA-FI-A2D2” in the search box above the table.
4. Click on the case ID to access the patient view.
5. Mouse over the “More about this patient” link to see a summary of clinical details.
6. Mouse over the column titles in the Mutations and CNA tables to learn more about each column.
7. Mouse over the numbers in the “Allele Freq (T)” column to see the variant and total allele counts for each mutation.
8. Mouse over the graph in the “Cohort” column to see the number and fraction of cases in the cohort that have the same mutated gene and the same specific mutation.
Fig. 11. The cBioPortal patient view. The example shows the relevant genomic alterations and clinical data of an endometrial cancer sample with mixed histology from the TCGA study.
on September 28, 2017
http://stke.sciencemag.org/
9. To view all of the mutations, either click the “Mutations” tab or click the “Show all 42 mutations” below the mutations of interest table on the summary display.
10. To return to the summary, click the “Summary” tab.
11. To view all CNAs, either click the “Copy Number Alterations” tab, or click the “Show all 557 CNAs” below the CNA of interest table on the summary display.
12. To return to the summary, click the “Summary” tab.
13. Mouse over the graph in the top right of the summary display to see an enlarged view of the scatter plot of mutation count versus fraction of genome altered for the cohort with the current patient highlighted in red.
14. To view drugs that target genes with mutations or CNAs in this patient, click the “Drugs” tab. 15. To view clinical trials that may be relevant to this patient, click the “Clinical Trials” tab.
Note: Results may be filtered by drug, which are clinical trials on the drugs listed in the Drugs tab, or by cancer type, which are clinical trials for the same cancer type the patient has.
16. To view a PDF of the pathology report for the tumor, click the “Pathology Report” tab.
Note: This view requires Adobe PDF Reader other PDF viewer. For Adobe PDF Reader, additional options for zooming and printing and saving appear when the mouse is placed near the top or bottom of the PDF.
Programmatic access
REST-Based Web Service Interface
The cBioPortal Web service interface provides direct programmatic access to all genomic data and metadata stored within the database. This enables client applications to access cancer genomic data in the portal through any programming languages that can process HTTP requests and responses, such as Java, Python, Perl, R, and MATLAB. The REST-based Web service can be queried by client applications using URLs consisting of one or more parameters. The server responds with a tab-delimited text format. A summary of valid CGDS (Cancer Genomics Data Server) commands is provided in Table 2.
1. Click the “Web API” button at the top of the navigation pane.
2. Follow the instructions and examples as described on the page to retrieve the data of interest.
Table 2. Summary of Web service commands. command Description getCancerStudies Retrieves metadata regarding all cancer studies stored on the server. getGeneticProfiles Retrieves metadata regarding all genetic profiles—for example, mutation or copy-number profiles—stored about a specific cancer type. getCaseLists Retrieves metadata regarding all case lists stored about a specific cancer type. For example, within a particular study, only some cases may have sequence data, and another subset of cases may have been sequenced and treated with a specific therapeutic protocol. getProfileData Retrieves genomic profile data for one or more genes. getMutationData Retrieves the full set of annotated mutation data. This includes validation status, sequencing center, the amino acid change that results from the mutation, and the predicted functional consequence of each mutation, as predicted by http://mutationassessor.org. getProteinArrayInfo Retrieves informations on antibodies used by RPPA to measure protein and phosphoprotein abundance. getProteinArrayData Retrieves the abundance of proteins, phosphoproteins, or both measured by RPPA. getClinicalData Retrieves de-identified clinical data, including overall survival, disease-free survival and age at diagnosis. on September 28, 2017 http://stke.sciencemag.org/ Downloaded from
R and MATLAB Packages
The CGDS-R package provides direct access to all portal data within the R framework for statistical computing and graphics. The package is available for download from CRAN (the Comprehensive R Archive Network). Similar to the functionality of the Web API, the CGDS-R package provides functions to easily retrieve data and metadata about available cancer types, genetic data profiles, and case sets in the database. Data are returned in a standard R data frame and is immediately ready for subsequent visualization and statistical analysis by use of the R framework.
Like the R package, the MATLAB CGDS Cancer Genomics Toolbox provides a set of functions for direct retrieval of cBioPortal data from within the MATLAB (MathWorks) environment. The toolbox can be downloaded from the MATLAB Central File Exchange. Each toolbox function has a direct counterpart in the portal Web API. Data are returned as structured arrays in a format that is easy to interpret and ready for subsequent visualization and statistical analysis. An included tutorial (“showdemo cgdstutorial”) shows how to use all the functions as well as how to make basic plots.
1. Click the “R/MATLAB” button at the top of the navigation pane.
2. Follow the instructions and examples as described on the page to retrieve the data of interest.
nOTeS anD ReMaRKS
complementary Data Sources and analysis Options
Table S2 compares the cBioPortal to other cancer genomics data and analysis resources, including the TCGA data portal (https://tcga-data.nci.nih.gov/tcga/), the ICGC data portal (http://dcc.icgc.org/), the Broad Institute’s Genome Data Analysis Center (GDAC) Firehose (http://gdac.broadinstitute.org), the IGV (28), the University of California, Santa Cruz (UCSC) Cancer Genomics Browser (30), IntO-Gen (31), Regulome Explorer (http://explorer.cancerregulome.org), and Oncomine (Reserach Edition) (32). The cBioPortal provides a resource for exploratory analysis of cancer genomics data, with an intuitive Web interface, biologically relevant abstraction of genetic alterations at the gene level, integrative analysis of genomic data sets and clinical attributes, interactive network analysis, and patient-centric summaries. It was designed to complement existing tools and resources, such as genome browsers. The cBioPortal does not store raw data, which are available from data portals, such as TCGA, ICGC, and Gene Expression Omnibus (GEO) (http://www.ncbi.nlm.nih. gov/geo/). A portion of the data in the cBioPortal is retrieved from the Broad Institute’s GDAC Firehose (http://gdac.broadinstitute.org), an analysis pipeline that automatically performs standard processing and analyses on TCGA data sets. The cBioPortal currently only sup-ports analysis of correlations between alterations in query genes. To explore more complex correlations among genes, including mRNA expression, Regulome Explorer and Oncomine can be used. To visualize and analyze multiple data types on the genome (23 chromo-somes), the IGV and the UCSC Cancer Genome Browser can be used.
Future Directions
The cBioPortal project is under active development. We anticipate several new features in the near future, including the addition of more cancer studies; support for genomic methylation events and their visualization in OncoPrints; addition of clinical attributes to OncoPrints; improvements to the network view using SBGN (Systems Biology Graphical Notation) (33); queries to Pathway Commons for causative links (activation, inhibition); patient view improvements (more clinical attributes and treatment data, tumor tissue image views, gene expression events, and information about altered pathways in a single patient); and batch download of complete data sets.
We intend to build an active community of researchers and software engineers involved in development of the portal software. We welcome industry involvement by mutual agreement with MSKCC. Parties who are interested in obtaining a copy of the cBioPortal software with or without the source code should contact us via [email protected].
SUPPleMenTaRY MaTeRialS
Table S1. Cancer studies integrated in the cBioPortal (as of 21 February 2013)
Table S2. Comparison matrix of several cancer genomics data and analysis resources (as of 21 February 2013) ReFeRenceS anD nOTeS
1. International Cancer Genome Constortium, T. J. Hudson, W. Anderson, A. Artez, A. D. Barker, C. Bell, R. R. Bernabé, M. K. Bhan, F. Calvo, I. Eerola, D. S. Gerhard, A. Guttmacher, M. Guyer, F. M. Hemsley, J. L. Jennings, D. Kerr, P. Klatt, P. Kolar, J. Kusada, D. P. Lane, F. Laplace, L. Youyong, G. Nettekoven, B. Ozenberger, J. Peterson, T. S. Rao, J. Remacle, A. J. Schafer, T. Shibata, M. R. Stratton, J. G. Vockley, K. Watanabe, H. Yang, M. M. Yuen, B. M. Knoppers, M. Bobrow, A. Cambon-Thomsen, L. G. Dressler, S. O. Dyke, Y. Joly, K. Kato, K. L. Kennedy, P. Nicolás, M. J. Parker, E. Rial-Sebbag, C. M. Romeo-Casabona, K. M. Shaw, S. Wallace, G. L. Wiesner, N. Zeps, P. Lichter, A. V. Biankin, C. Cha-bannon, L. Chin, B. Clément, E. de Alava, F. Degos, M. L. Ferguson, P. Geary, D. N. Hayes, T. J. Hudson, A. L. Johns, A. Kasprzyk, H. Nakagawa, R. Penny, M. A. Piris, R. Sarin, A. Scarpa, T. Shibata, M. van de Vijver, P. A. Futreal, H. on September 28, 2017 http://stke.sciencemag.org/ Downloaded from