Quantitative atom-resolved force gradient imaging using noncontact atomic
force microscopy
Ahmet Oral, Ralph A. Grimble, H. Özgür Özer, Peter M. Hoffmann, and John B. Pethica
Citation: Appl. Phys. Lett. 79, 1915 (2001); doi: 10.1063/1.1389785 View online: http://dx.doi.org/10.1063/1.1389785
View Table of Contents: http://apl.aip.org/resource/1/APPLAB/v79/i12
Published by the American Institute of Physics.
Additional information on Appl. Phys. Lett.
Journal Homepage: http://apl.aip.org/
Journal Information: http://apl.aip.org/about/about_the_journal
Top downloads: http://apl.aip.org/features/most_downloaded
Information for Authors: http://apl.aip.org/authors
Quantitative atom-resolved force gradient imaging using noncontact
atomic force microscopy
Ahmet Oral,a),b)Ralph A. Grimble, H. O¨ zgu¨r O¨zer,a)Peter M. Hoffmann, and John B. Pethica
Department of Materials, University of Oxford, Parks Road, Oxford OX1 3PH, United Kingdom 共Received 4 April 2001; accepted for publication 11 June 2001兲
Quantitative force gradient images are obtained using a sub-angstro¨m amplitude, off-resonance lever oscillation method during scanning tunneling microscopy imaging. We report the direct observation of short-range bonds, and the measured short-range force interaction agrees well in magnitude and length scale with theoretical predictions for single bonds. Atomic resolution is shown to be associated with the presence of a prominent short-range contribution to the total force interaction. It is shown that the background longer-range interaction, whose relative magnitude depends on the tip structure, has a significant effect on the contrast observed at the atomic scale. © 2001 American Institute of Physics. 关DOI: 10.1063/1.1389785兴
The atomic force microscope共AFM兲1was originally de-vised as an analog of the scanning tunneling microscope
共STM兲, using forces rather than the tunnel current between
tip and surface atoms to generate atomic resolution images. Forces associated with short-range bonding have, like the tunnel current, an exponential dependence on distance,2,3 making atomic resolution possible. However, most of the actual applications of AFM have been at lower than atomic resolution because of the extreme sensitivity required to re-solve single bonds, and the instability of soft levers against the high force gradients of short-range interactions. Atomic resolution AFM has been achieved only recently using reso-nant cantilevers with large,⬃100 Å oscillation amplitudes in ultrahigh vacuum 共UHV兲.4 – 6 This technique has also been used to measure the force interactions between the tip and sample,7 but the oscillation amplitudes employed are much greater than the interaction range. Hence the interaction has to be inferred by mathematical deconvolution, which as-sumes both single valuedness of the interaction and the ab-sence of dissipation processes during the measurement. There have been more direct measurements of the interac-tion. Du¨rig et al.8observed short-range interactions using an Ir sample, but their work did not involve imaging. Other direct measurements have shown unexpectedly large length scales for the interaction potentials9,10 implying the domi-nance of forces other than atomic local bonding. In this let-ter, we report the direct observation of short-range bonds, and we show that they are indeed associated with atomic resolution in AFM as predicted by theory.11
Experiments are performed with a specially constructed high force resolution AFM/STM operating in UHV.12 The force gradient between the tip and sample is measured by vibrating the cantilever base at a frequency well below the resonance, with a very small oscillation amplitude of typi-cally 0.25–0.5 Å peak to peak. Excellent displacement sen-sitivity is thus very important. An all-fiber interferometer is
used to detect the cantilever deflections,13 and the reflectivi-ties of the fiber end and the lever are tailored to enhance the cavity’s finesse. The system has a 3⫻10⫺4Å/冑Hz noise floor, which enables ⬍1 N/m stiffness changes to be ob-served with sub-Å oscillation amplitudes using reasonable integration times. The amplitude at the tip, which is altered by the tip–surface interaction, is detected from the interfer-ometer output using a lock-in amplifier. The interaction stiff-ness 共negative of the force gradient兲 between the tip and sample kintcan be obtained from the simple relation14
kint⫽⫺
dF dz⫽k0
冉
A0
A ⫺1
冊
, 共1兲where k0, A0 and A are the lever stiffness, free oscillation amplitude and measured oscillation amplitude of the lever, respectively. The use of very small amplitudes has two ad-vantages. First, the interaction is determined at a single sepa-ration, and is thus easily correlated with the simultaneously observed tunnel current. Second, the interaction is effectively linearized at that point, and its value is directly found from a simple spring analysis, as in Eq.共1兲. This contrasts with large amplitude techniques, where the nonlinear nature of the in-teraction necessitates deconvolution of frequency shift data and the use of certain a priori assumptions about the nature of the interaction. Most literature reports confine themselves to reporting the frequency shifts of the resonant lever rather than the actual interaction force gradients.
The cantilevers are made from flattened and polished tungsten wires whose ends are bent and then etched to obtain sharp tips. The levers have stiffnesses in the range of 100– 250 N/m in order to be safely above the typical maximum
共negative兲 interaction stiffness and thus avoid the snap-in
instability at smaller separations. The stiffness of the levers is determined by measuring the thermal oscillation amplitude and also independently by a laser interferometer and a cali-brated test counterlever and a nanoindenter. The levers have 11–20 kHz resonant frequencies and quality factors, Q, of 600–3000. The piezo motions are calibrated using the fiber interferometer. The experiments are performed in an UHV system with a base pressure of ⬃5⫻10⫺11mbar. The
a兲Present address: Department of Physics, Bilkent University, 06533 Ankara,
Turkey.
b兲Electronic mail: [email protected]
APPLIED PHYSICS LETTERS VOLUME 79, NUMBER 12 17 SEPTEMBER 2001
1915
0003-6951/2001/79(12)/1915/3/$18.00 © 2001 American Institute of Physics Downloaded 08 May 2013 to 139.179.14.46. This article is copyrighted as indicated in the abstract. Reuse of AIP content is subject to the terms at: http://apl.aip.org/about/rights_and_permissions
Si共111兲 (7⫻7) surface is prepared in situ in the standard manner, finishing by flashing the sample to 1080 °C. The microscope is stable for long periods and we can record im-ages overnight automatically.
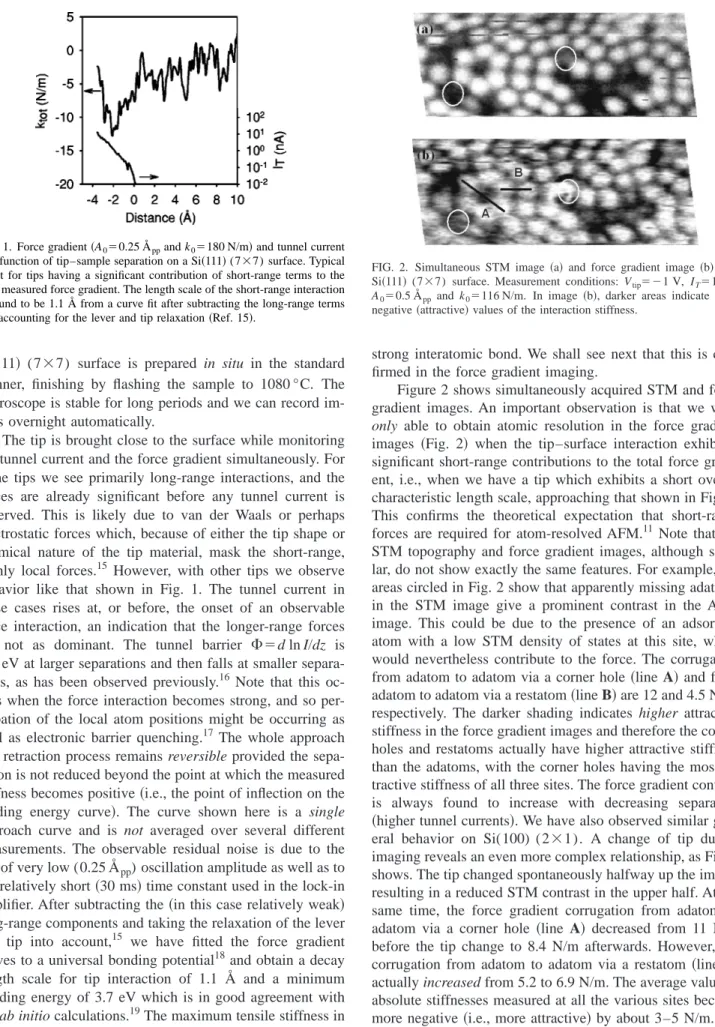
The tip is brought close to the surface while monitoring the tunnel current and the force gradient simultaneously. For some tips we see primarily long-range interactions, and the forces are already significant before any tunnel current is observed. This is likely due to van der Waals or perhaps electrostatic forces which, because of either the tip shape or chemical nature of the tip material, mask the short-range, highly local forces.15 However, with other tips we observe behavior like that shown in Fig. 1. The tunnel current in these cases rises at, or before, the onset of an observable force interaction, an indication that the longer-range forces are not as dominant. The tunnel barrier ⌽⫽d ln I/dz is
⬃2 eV at larger separations and then falls at smaller
separa-tions, as has been observed previously.16 Note that this oc-curs when the force interaction becomes strong, and so per-turbation of the local atom positions might be occurring as well as electronic barrier quenching.17 The whole approach and retraction process remains reversible provided the sepa-ration is not reduced beyond the point at which the measured stiffness becomes positive共i.e., the point of inflection on the binding energy curve兲. The curve shown here is a single approach curve and is not averaged over several different measurements. The observable residual noise is due to the use of very low (0.25 Åpp) oscillation amplitude as well as to the relatively short共30 ms兲 time constant used in the lock-in amplifier. After subtracting the共in this case relatively weak兲 long-range components and taking the relaxation of the lever and tip into account,15 we have fitted the force gradient curves to a universal bonding potential18and obtain a decay length scale for tip interaction of 1.1 Å and a minimum bonding energy of 3.7 eV which is in good agreement with the ab initio calculations.19The maximum tensile stiffness in Fig. 1 is⬃13 N/m and integration of the curve gives ⬃3 nN maximum force. Of this about 5 N/m and 1.2 nN共i.e., about 40%兲 are due to short-range interactions. We are thus mea-suring the short-range potentials responsible for a single
strong interatomic bond. We shall see next that this is con-firmed in the force gradient imaging.
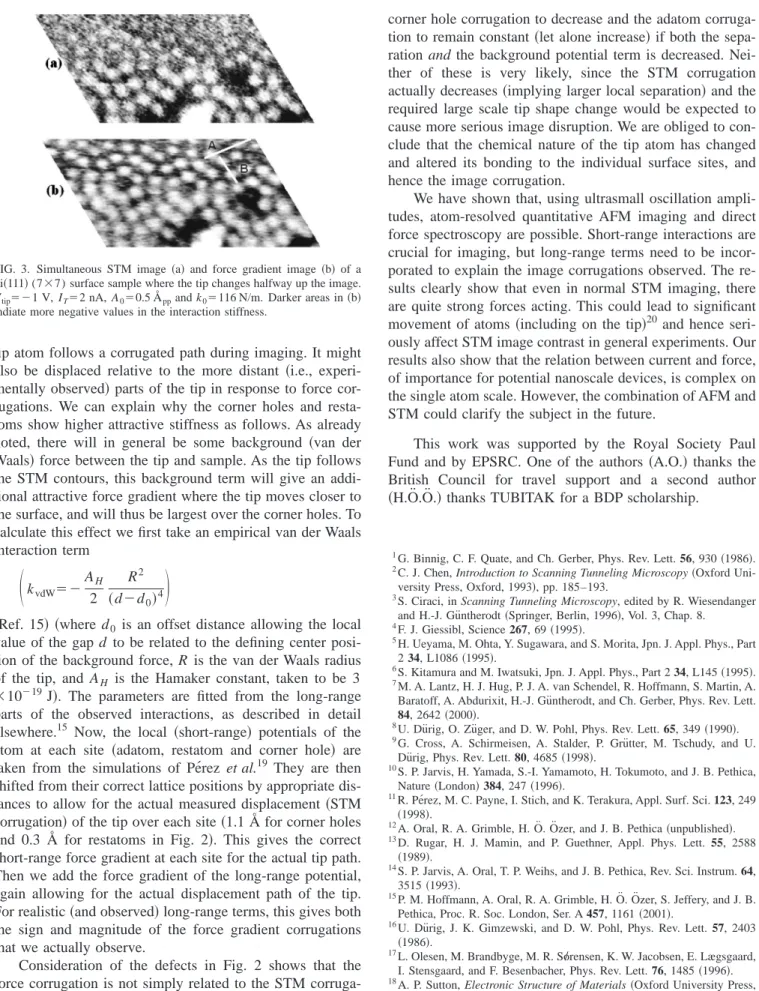
Figure 2 shows simultaneously acquired STM and force gradient images. An important observation is that we were only able to obtain atomic resolution in the force gradient images 共Fig. 2兲 when the tip–surface interaction exhibited significant short-range contributions to the total force gradi-ent, i.e., when we have a tip which exhibits a short overall characteristic length scale, approaching that shown in Fig. 1. This confirms the theoretical expectation that short-range forces are required for atom-resolved AFM.11 Note that the STM topography and force gradient images, although simi-lar, do not show exactly the same features. For example, the areas circled in Fig. 2 show that apparently missing adatoms in the STM image give a prominent contrast in the AFM image. This could be due to the presence of an adsorbate atom with a low STM density of states at this site, which would nevertheless contribute to the force. The corrugation from adatom to adatom via a corner hole共line A兲 and from adatom to adatom via a restatom共line B兲 are 12 and 4.5 N/m, respectively. The darker shading indicates higher attractive stiffness in the force gradient images and therefore the corner holes and restatoms actually have higher attractive stiffness than the adatoms, with the corner holes having the most at-tractive stiffness of all three sites. The force gradient contrast is always found to increase with decreasing separation
共higher tunnel currents兲. We have also observed similar
gen-eral behavior on Si(100) (2⫻1). A change of tip during imaging reveals an even more complex relationship, as Fig. 3 shows. The tip changed spontaneously halfway up the image, resulting in a reduced STM contrast in the upper half. At the same time, the force gradient corrugation from adatom to adatom via a corner hole 共line A兲 decreased from 11 N/m before the tip change to 8.4 N/m afterwards. However, the corrugation from adatom to adatom via a restatom 共line B兲 actually increased from 5.2 to 6.9 N/m. The average value of absolute stiffnesses measured at all the various sites became more negative 共i.e., more attractive兲 by about 3–5 N/m.
Calculations by Pe´rez et al.19indicate that the force gra-dient magnitude over the holes should be less than that over the adatoms, the opposite of what we observe. However, this assumes a laterally flat tip trajectory, whereas in reality the
FIG. 1. Force gradient共A0⫽0.25 Åppand k0⫽180 N/m兲 and tunnel current as a function of tip–sample separation on a Si共111兲 (7⫻7) surface. Typical result for tips having a significant contribution of short-range terms to the total measured force gradient. The length scale of the short-range interaction is found to be 1.1 Å from a curve fit after subtracting the long-range terms and accounting for the lever and tip relaxation共Ref. 15兲.
FIG. 2. Simultaneous STM image 共a兲 and force gradient image 共b兲 of a Si共111兲 (7⫻7) surface. Measurement conditions: Vtip⫽⫺1 V, IT⫽1 nA,
A0⫽0.5 Åppand k0⫽116 N/m. In image 共b兲, darker areas indicate more negative共attractive兲 values of the interaction stiffness.
1916 Appl. Phys. Lett., Vol. 79, No. 12, 17 September 2001 Oralet al.
tip atom follows a corrugated path during imaging. It might also be displaced relative to the more distant 共i.e., experi-mentally observed兲 parts of the tip in response to force cor-rugations. We can explain why the corner holes and resta-toms show higher attractive stiffness as follows. As already noted, there will in general be some background 共van der Waals兲 force between the tip and sample. As the tip follows the STM contours, this background term will give an addi-tional attractive force gradient where the tip moves closer to the surface, and will thus be largest over the corner holes. To calculate this effect we first take an empirical van der Waals interaction term
冉
kvdW⫽⫺ AH 2 R2 共d⫺d0兲4冊
共Ref. 15兲 共where d0 is an offset distance allowing the local value of the gap d to be related to the defining center posi-tion of the background force, R is the van der Waals radius of the tip, and AH is the Hamaker constant, taken to be 3
⫻10⫺19J兲. The parameters are fitted from the long-range parts of the observed interactions, as described in detail elsewhere.15 Now, the local 共short-range兲 potentials of the atom at each site 共adatom, restatom and corner hole兲 are taken from the simulations of Pe´rez et al.19 They are then shifted from their correct lattice positions by appropriate dis-tances to allow for the actual measured displacement 共STM corrugation兲 of the tip over each site 共1.1 Å for corner holes and 0.3 Å for restatoms in Fig. 2兲. This gives the correct short-range force gradient at each site for the actual tip path. Then we add the force gradient of the long-range potential, again allowing for the actual displacement path of the tip. For realistic共and observed兲 long-range terms, this gives both the sign and magnitude of the force gradient corrugations that we actually observe.
Consideration of the defects in Fig. 2 shows that the force corrugation is not simply related to the STM corruga-tion, and that changes in short-range forces have a major effect on the images. This is particularly evident in trying to model the effect of the tip change in Fig. 3. Without chang-ing the short-range potentials, it is only possible to cause the
corner hole corrugation to decrease and the adatom corruga-tion to remain constant 共let alone increase兲 if both the sepa-ration and the background potential term is decreased. Nei-ther of these is very likely, since the STM corrugation actually decreases共implying larger local separation兲 and the required large scale tip shape change would be expected to cause more serious image disruption. We are obliged to con-clude that the chemical nature of the tip atom has changed and altered its bonding to the individual surface sites, and hence the image corrugation.
We have shown that, using ultrasmall oscillation ampli-tudes, atom-resolved quantitative AFM imaging and direct force spectroscopy are possible. Short-range interactions are crucial for imaging, but long-range terms need to be incor-porated to explain the image corrugations observed. The re-sults clearly show that even in normal STM imaging, there are quite strong forces acting. This could lead to significant movement of atoms 共including on the tip兲20 and hence seri-ously affect STM image contrast in general experiments. Our results also show that the relation between current and force, of importance for potential nanoscale devices, is complex on the single atom scale. However, the combination of AFM and STM could clarify the subject in the future.
This work was supported by the Royal Society Paul Fund and by EPSRC. One of the authors 共A.O.兲 thanks the British Council for travel support and a second author
共H.O¨.O¨.兲 thanks TUBITAK for a BDP scholarship.
1G. Binnig, C. F. Quate, and Ch. Gerber, Phys. Rev. Lett. 56, 930共1986兲. 2C. J. Chen, Introduction to Scanning Tunneling Microscopy共Oxford
Uni-versity Press, Oxford, 1993兲, pp. 185–193. 3
S. Ciraci, in Scanning Tunneling Microscopy, edited by R. Wiesendanger and H.-J. Gu¨ntherodt共Springer, Berlin, 1996兲, Vol. 3, Chap. 8. 4F. J. Giessibl, Science 267, 69共1995兲.
5H. Ueyama, M. Ohta, Y. Sugawara, and S. Morita, Jpn. J. Appl. Phys., Part 2 34, L1086共1995兲.
6
S. Kitamura and M. Iwatsuki, Jpn. J. Appl. Phys., Part 2 34, L145共1995兲. 7M. A. Lantz, H. J. Hug, P. J. A. van Schendel, R. Hoffmann, S. Martin, A. Baratoff, A. Abdurixit, H.-J. Gu¨ntherodt, and Ch. Gerber, Phys. Rev. Lett.
84, 2642共2000兲.
8
U. Du¨rig, O. Zu¨ger, and D. W. Pohl, Phys. Rev. Lett. 65, 349共1990兲. 9
G. Cross, A. Schirmeisen, A. Stalder, P. Gru¨tter, M. Tschudy, and U. Du¨rig, Phys. Rev. Lett. 80, 4685共1998兲.
10S. P. Jarvis, H. Yamada, S.-I. Yamamoto, H. Tokumoto, and J. B. Pethica, Nature共London兲 384, 247 共1996兲.
11
R. Pe´rez, M. C. Payne, I. Stich, and K. Terakura, Appl. Surf. Sci. 123, 249
共1998兲.
12A. Oral, R. A. Grimble, H. O¨ . O¨zer, and J. B. Pethica 共unpublished兲. 13D. Rugar, H. J. Mamin, and P. Guethner, Appl. Phys. Lett. 55, 2588
共1989兲.
14
S. P. Jarvis, A. Oral, T. P. Weihs, and J. B. Pethica, Rev. Sci. Instrum. 64, 3515共1993兲.
15P. M. Hoffmann, A. Oral, R. A. Grimble, H. O¨ . O¨zer, S. Jeffery, and J. B. Pethica, Proc. R. Soc. London, Ser. A 457, 1161共2001兲.
16
U. Du¨rig, J. K. Gimzewski, and D. W. Pohl, Phys. Rev. Lett. 57, 2403
共1986兲.
17L. Olesen, M. Brandbyge, M. R. So”rensen, K. W. Jacobsen, E. Lægsgaard, I. Stensgaard, and F. Besenbacher, Phys. Rev. Lett. 76, 1485共1996兲. 18A. P. Sutton, Electronic Structure of Materials共Oxford University Press,
Oxford, 1993兲, pp. 1–6.
19R. Pe´rez, I. Stich, M. C. Payne, and K. Terakura, Phys. Rev. B 58, 10835
共1998兲.
20A. R. H. Clarke, J. B. Pethica, J. A. Nieminen, F. Besenbacher, E. Lægs-gaard, and I. StensLægs-gaard, Phys. Rev. Lett. 76, 1276共1996兲.
FIG. 3. Simultaneous STM image 共a兲 and force gradient image 共b兲 of a Si共111兲 (7⫻7) surface sample where the tip changes halfway up the image.
Vtip⫽⫺1 V, IT⫽2 nA, A0⫽0.5 Åppand k0⫽116 N/m. Darker areas in 共b兲 indiate more negative values in the interaction stiffness.
1917
Appl. Phys. Lett., Vol. 79, No. 12, 17 September 2001 Oralet al.