REDUCTION OF EFFECTS OF INACTIVE ARRAY ELEMENTS IN PHASE
ABERRATION CORRECTION
M.
Karaman,
H.
Koymen, A. Atalar, and
M.
O’Donnellt
Department
of
Electrical and Electronics Engineering
Bilkent University, Ankara, 06533
TURKEY
t
Department
of
Electrical Engineering and Computer Science
University
of
Michigan, Ann Arbor,
MI
48109-2122,
USA
ABSTRACT
Phase aberration correction based on time delay es- timation via minimization of sum of absolute diffe- rence (SAD) between radio frequency (RF) signals of neighboring elements is studied in the presence of missing elements. To examine the influence of inactive elements, phase estimation error is measured for various combinations of different number of missing elements, aberration level, and
SNR.
The measurements are performed on an experimental RF data set. Aberration delays of missing elements are interpolated using the phase estimate between the nearest active elements. The B-scan images are reconstructed for qualitative examination.IN TROD U CTIO N
Phase errors induced by tissue inhomogeneities crit- ically affect the image resolution of phased array ultrasound scanners. Various techniques had been developed to estimate and correct phase aberrations [l, 2, 31. Time delay estimation via minimization of SAD between the sampled RF echo signals of neighbor elements has been shown to perform well for accurate phase estimation with relatively high computational efficiency [5]. Accuracy of the estimation is seriously degraded, however, by the presence of missing elements Detection of differential delays between missing ele- ments is not possible in aberration correction based on time delay estimation on the neighboring elements. To obtain the complete aberration pattern for proper phasing of whole aperture, the differential delays of missing elements can be interpolated using the phase estimate between the nearest active elements next to missing elements. However, accuracy of phase estimation between two RF signals is limited by level
PI,
of their covariance [6]. The covariance depends on not only the spatial distance, but it is also critically influenced by aberration level and SNR of RF signals. To examine the accuracy performance of aberration correction with missing elements, phase estimation error have been measured for different combinations of the spatial distance, aberration level, and SNR. The measurements were performed on a 3.3 MHz,
64element phased array experimental
RF
data set. Dependence of the measurements on bit density of RF data is examined in the limiting case by using one bit word length for SAD computation. Additionally, B-scan images of a phantom were reconstructed with missing elements for qualitative test.ABERRATION CORRECTION
Phased array adaptive beamformers involve estimation of phase distortions across the array, and its compen- sation using the estimate. The compensation is easily realized by updating focusing delays using the esti- mated delays. One way is t o estimate aberration delays is to measure relative time shifts between neighboring elements. The final element delays, then, can be obtain by unwrapping the measured differential delays [l]. Computational requirements of cost function used in the time delay estimation, limit the computational efficiency of estimation. The SAD can be used as a computationally simple cost function, and is defined as:
M
E , , n ( t , u , a ) = C
I
s r n ( i + u r n ) - S n ( i + k + u n )I
( 1 )i= 1
where S n ( i ) and un correspond to the ith sample of the signal, and the aberration delay for the nth element, respectively. The signals Sm and Sn are defined as:
s m
=
x,
+
CrnWl S n = Xn+
cnW2 (2)where
X,
andXn
are the noise free RF signals, W1 andW2 are the uncorrelated Gaussian random noise having the same bandwidth with the RF signals, and cm and cn are the coefficients used t o obtain different SNR levels. The best match of Srn and S n results in the minimum SAD value. Thus, the value of
k
which minimizes the SAD corresponds t o the time delay difference between S, and S,. In the limiting case, the SAD expression can be simplified as:M
Drn,n(k, U , a) = z m ( i
+
urn)e
zn(i+ +
U,) (3)i = l
where zn(i) is the the one bit representation of
S,(i),
and @ is the bitwise logic EXCLUSIVEOR operation. For comparison purpose, the time-delay estimation using normalized cross-correlation as a cost function is considered:Cm,n(k) Q ) = (4)
Cfl,
{ S m ( t+
urn) - T m } {Sn(i+
k+
U n )-zn}
JxM
*=I {sm(i +urn)-
~ m } ’CE,
{sa(i+
t turn) - 3 n l ’where the
3,
is the mean value ofSn(.)
computed over the corresponding window. The best match of two signals is achieved a t the maximum correlation value where the maximizing parameter, IC, corresponds to the time delay between S, and S,,.To obtain the aberration delays, the time delay estima- tion outlined above must be repeated for all neighbor- ing element pairs. The estimate of resultaiit aberration delay time, r,, for the nth element is obtained by the
cumulative summation:
n
(5) j = 2
where A ~ j j - 1 is the differential delay between the j t h and ( j
-
1)th elements.Presence of missing elements causes loss of corre- sponding differential delays. Attempts to obtain the complete aberration pattern with lost differential delays result in forming two phase patterns over the sub- apertures on two sides of inactive elements. While elements of each subaperture are phased properly, the relative phasing of two subapertures with respect to each other may not be correct. This can cause significant degradation in image resolution. To handle this problem, the relative phase between two nearest operable elements on two sides of inactive elements is estimated, and it is evenly distributed over the missing
and (n - 1)th elements, Ar,,,,,-1, (i
<
n5
i+
T ) isobtained as:
MEASUREMENTS
To test influence of missing elements on aberration cor-
rection, various measurements are performed using an actual RF data set, acquired from a standard graphite- gel AIUM resolution phantom with a conventional 3.3 MHz, 64element phased array [l]. The RF A- scans were recorded for every possible combination of transmitter and receiver elements, using 10-bit, 17.76 MHz analog to digital conversion. All mea- surements and image reconstruction are carried out by digitally processing the recorded data tto emulate the operation of a real-time adaptive digital imaging system.
To reduce the phase quantization effects, the sampling rate of data is increased by 8 times using digital inter- polation resulting in a phase accuracy of 2n/43. For all measurements, a fixed transmit focus at 80 mm, and dynamic receive focusing are employed. Correlation and SAD functions are calculated on RF signals from diffuse scatterers within a 20 mm axial window located a t 60 mm away from the aperture.
Phase Estimation Error
The time delay estimation error vs rms aberration over the array, r m s { u } , and spatial distance, T , is
measured for correlation and 1-bit SAD functions. The measured error is the residual rms phase error between the original and estimated relative aberration delays. Note that the number of missing elements is equal t o
T - 1 for r
2
1. Since the measurements are performedon the different element pairs on the array, the error of each measurement is first averaged over the pairs with the same spatial separation:
1
.
N - rThen, the rms of this averaged error and its standard deviation over five different speckle data are obtained, denoted by rrns(A&!).
To obtain the results, the relative phase differences between the element pairs are estimated by the time delay estimation with a = 00 in Eqs. 3 and 4 , and
then the above error computations are carried out. The estimation is repeated for all element pairs separated by r elements, and for different ~ r n s { u } values.
-
elements [4]. If the elements between i and i
+
T areinactive, then the differential delay between the nth
Fig. 1 depicts the rrns(A&!) vs T and rms{u} for the correlation and 1-bit SAD. The isopotential contour
18 14 12
-
-
i I 0 2 I I 0 0.05 0.1 0.15 0.2 PHASE ABERRATION ( m u ) h ) RESIDUALPHASEERRORFORl-BTTSAD ( rm.{A*:) A 18 14 12 -10-
..K
3 8
g as
m 2 18 14 12 -10-
..K
3 8
g as
m 2 0 0 I 1 0 0.05 0.1 0.15 0.2PHASE ABERRATION (rm.(u) X )
Figure 1: Isopotential contours of the residual rms phase error vs the spatial distance and rms phase aberration.
values shown on the figures are given in fractions of a wavelength, and the contours are equally spaced. The error distributions for correlation and 1-bit SAD are almost the same. T h e error for the combinations of number of missing elements and rms aberration levels under 0.069 contour can be tolerable for time delay estimation (one quantization level is 0.023 A). In general, the phase estimation error is acceptable for missing elements up t o 10 percent of overall aperture with rms aberration up t o 0.15 A. The measured standard deviations indicate that while the results below the 0.069 contour are stable, the error mea- surements vary significantly with different speckle data for measurements above this error, and hence are not stable.
Noise Performance
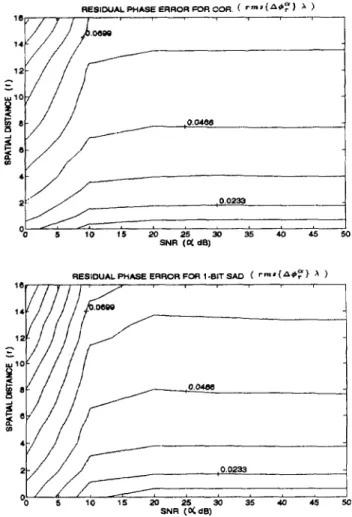
To test noise performance of aberration estimation using correlation and 1-bit SAD, phase estimation error is measured for different SNR levels and spatial
3 3 4 0 4 5 5 0
SNR (o( de)
RESIDUALPHASEERRORFOR 1-BITSAD ( rn'{A#?> )
2 5 & 3 5 & & 5 b
SNR ( X d B )
Figure 2:
phase error vs the spatial distance and SNR.
Isopotential contours of the residual rms
distances (see Fig. 2). To obtain these results, the noisy signals, S, and S,, (Eq. 2), are generated by proper setting of the coefficients, cm and c,. The rms and standard deviation computations over five speckle data are carried out as similar to those in the previous subsection. Note that, in the phase estimation measurements, the cost functions of Eqs. 3 and 4 are computed with no aberration, uj = 0, and hence the resulting error is a function of only the spatial distance, r , and SNR, a. The resultant residual rms error is denoted as rm.s{Ad,*}.
It must be noted that, in the measurements, it is assumed that the original data is noiseless. In fact the original data is real data and contains noise. Therefore the generated noise is actually an additive noise on the signal. Hence, the SNR values reported in this work
are lower than the actual SNR values.
The residual phase error measurements vs SNR and spatial distance for correlation and 1-bit SAD are given in Fig. 2. The correlation and 1-bit SAD functions, in
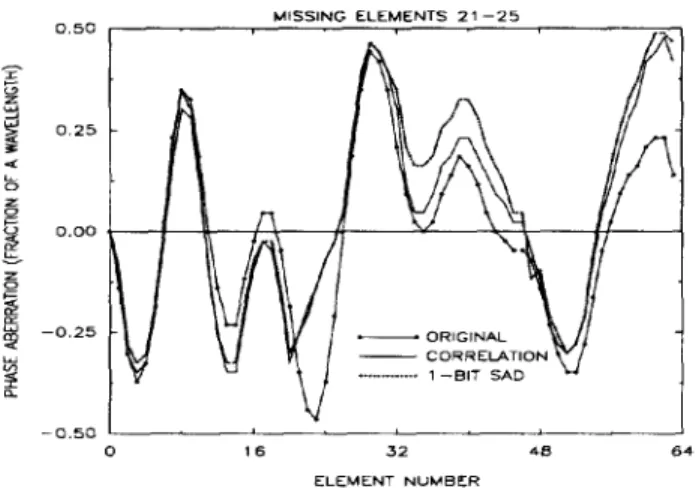
MISSING ELEMENTS 2 1 - 2 5 0.50 , -ORIGINAL -0.50
‘
0 16 32 48 64 ELEMENT NUMBERFigure 3: Original and estimated aberration patterns. general, show similar performance in phase estimation for different SNR levels. However, the error of 1-bit SAD is slightly higher than that of correlation at very low SNR. The measured standard deviations indicate that the results are quite stable for different speckle data with SNR higher than 10 dB.
B-SCAN IMAGES
For qualitative testing, the sector images of the phan- tom are reconstructed with missing elements and aber- ration. Each image shown in Fig. 4 shows a section of the phantom, and has a size of about 2.5 cm x 2.5 cm. In the reconstruction, dynamic receive focusing is employed, and transmit focus is fixed a t 80 mm. The images are displayed using only a logarithmic compression over a 50 dB dynamic range.
For each corrected image, the transmit and receive delays are updated using the aberration pattern es- timated from diffuse scatterers with missing elements 21-25. The window length used for correlation and 1- bit SAD is 20 mm. The missing elements and phase distortion are employed in both transmit and receive beamforming. The original and estimated aberration patterns shown in Fig. 3 ar.: used for electronic phase distortion and compensation, respectively.
Comparison of the control, aberrated, and corrected images shown in Fig. 4 indicates that the degradation due to aberration is significantly eliminated even with the presence of missing elements. The corrected images are very similar which clearly depicts the comparable performance of correction schemes based on 1-bit SAD and correlation. Slight difference between the control and corrected images is due to unperfect phase error compensation arising from accumulation of small esti- mation errors.
Figure 4: B-scan images: a) control b) aberrated, and corrected using c) correlation and d) 1-bit SAD.
CONCLUSION
Influence of missing elements in aberration correction based on time delay estimation on neighboring elements is investigated through the measurements performed on the experimental data. The measurements show that 1-bit SAD can be effectively used for correction of phase distortions with adjacent missing elements up to 10% of a 64-element phased array. Weak accuracy performance of 1-bit SAD a t very low SNR can be improved by averaging the estimates over a number of beams, and/or increasing the estimation window [5].
ACKNOWLEDGMENT
This work is supported in part by Turkish Scientific and Research Council, TUBITAK.
References
S. W. Flax and M . O’Donnell, “Phase-aberration cor- rection using signals from point reflectors and diffuse scatterers: basic principles,” ZEEE Trans. Ultrason. Ferroelec. Freq. Contr., pp. 758-767, Nov. 1988.
D. Zhao and G. E. Trahey, “Comparisons of image quality factors for phase aberration correction with diffuse and point targets,” IEEE Trans. Ultrason. Ferroelec. Freq. Contr., pp. 125-132, Mar. 1991.
M.
Fink, “Time reversal of ultrasonic fields - PartI: basic principles”, IEEE Trans. Ultrason. Ferroelec. Freq. Contr., pp, 555-566, Sep. 1992.
M . O’Donnell and W. E. Engeler, “Correlation-based aberration correction in the presence of inoperable ele- ments,” IEEE Trans. Ultrason. Ferroelec. Freq. Contr., pp. 700-707, Nov. 1992.
M.
Karaman, A. Atalar,H.
Koymen, andM.
O’Donnell, “A phase aberration correction method for ultrasound imaging,” IEEE Trans. Ultrason., Ferro- elect., Freq. Contr., pp. 275-282, July 1993.R. Mallart and