THE IMPACT OF NON-PRICING
STRATEGIES ON THE FINANCIAL
INTERMEDIARY ROLE OF TURKISH
BANKS
A Master’s Thesis
by
MAHMUT KARA
Department of
Management
Bilkent University
Ankara
May 2010
THE IMPACT OF NON-PRICING
STRATEGIES ON THE FINANCIAL
INTERMEDIARY ROLE OF TURKISH
BANKS
The Institute of Economics and Social Sciences
of
Bilkent University
by
MAHMUT KARA
In Partial Fulfilment of the Requirements for the Degree of
MASTER OF SCIENCE
in
DEPARTMENT OF
MANAGEMENT
BILKENT UNIVERSITY
ANKARA
May 2010
I certify that I have read this thesis and have found that it is fully adequate, in scope and in quality, as a thesis for the degree of Master of Science in Management.
Assoc. Prof. Dr. S¨uheyla ¨Ozyıldırım Supervisor
I certify that I have read this thesis and have found that it is fully adequate, in scope and in quality, as a thesis for the degree of Master of Science in Management.
Prof. Dr. Hakan Berument Examining Committee Member
I certify that I have read this thesis and have found that it is fully adequate, in scope and in quality, as a thesis for the degree of Master of Science in Management.
Assist. Prof. Dr. Ba¸sak Tanyeri Examining Committee Member
Approval of the Institute of Economics and Social Sciences
Prof. Dr. Erdal Erel Director
ABSTRACT
THE IMPACT OF NON-PRICING STRATEGIES ON
THE FINANCIAL INTERMEDIARY ROLE OF
TURKISH BANKS
Kara, Mahmut
M.S., Department of Management Supervisors: Assoc. Prof. S¨uheyla ¨Ozyıldırım
May 2010
This thesis aims to explore the effects of the availability of network branches on the intermediation performance of deposit banks in Turkey. Banks’ in-termediation performance was measured by their ability to attract loans and deposits. The variations of non-pricing behavior among large scaled versus small scaled banks and public versus private banks were also analyzed. Panel generalized method of moment was used with quarterly panel data between the years 2003 and 2008. Empirical findings reveal that there exist a positive and significant relationship between all deposit banks’ intermediation perfor-mance and their branch network decisions. Results also confirmed that by having larger branch networks especially for large scaled, small scaled and private deposit banks significantly increase their deposits ans loans during the sample period. However, we couldn’t find any association between the financial intermediation performance and branch network size of the public banks. Overall, the findings suggest that branch network decisions play a
critical role for deposit banks’ performance. Considering recent competition among banks in Turkey, we expect that branching strategies and other non-pricing strategies of the banks will matter more in the future.
Keywords: Banking, Competition, Non-Pricing Behavior, Branch Network,
¨
OZET
T ¨
URK BANKALARININ F˙IYAT DIS
¸I
STRATEJ˙ILER˙IN˙IN F˙INANSAL ARACILIK
FAAL˙IYETLER˙INE ETK˙ILER˙I
Kara, Mahmut
Y¨uksek Lisans, ˙I¸sletme B¨ol¨um¨u Tez Y¨oneticisi: Do¸c. Dr. S¨uheyla ¨Ozyıldırım
Mayıs 2010
Bu tez, mevduat bankalarının ¸sube a˘glarının, finansal aracılık faaliyeti per-formanslarına etkilerinin ortaya ¸cıkarılmasını ama¸clamaktadır. Bankaların performansları, kredi verme ve mevduat toplama kabiliyetleri ile ¨ol¸c¨ulm¨u¸st¨ur. Ayrıca, b¨uy¨uk ¨ol¸cekli bankalarla k¨u¸c¨uk ¨ol¸cekli bankaların ve kamu bankaları ile ¨ozel mevduat bankalarının fiyat dı¸sı davranı¸slarındaki farklılıklar da analiz edilmi¸stir. 2003 ile 2008 yılları arasını kapsayan ¸ceyrek d¨onem panel verileri ile panel GMM methodu kullanılmı¸stır. Ampirik sonu¸clar, mevduat bankalarının finansal aracılık faaliyeti performanslarıyla ¸sube a˘gı kararları arasında pozitif ve anlamlı bir ili¸ski oldu˘gunu ortaya koymu¸stur. Ayrıca sonu¸clar, ¸calı¸stı˘gımız d¨onem i¸cin, b¨uy¨uk ¨ol¸cekli, k¨u¸c¨uk ¨ol¸cekli ve ¨ozel sermayeli mevduat bankaları i¸cin ¸sube a˘gı geni¸sledik¸ce toplanan mevduatın ve kredi arzının artaca˘gını da do˘grulamı¸stır. Ancak, ampirik sonu¸clar, kamu bankalarının ¸sube a˘gı b¨uy¨ukl¨ukleri ile finansal aracılık faaliyeti performansları arasında istatistiksel a¸cıdan anlamlı sonu¸clar olmadı˘gını g¨ostermi¸stir. Sonu¸c olarak, ¸sube a˘gı
karar-ları, mevduat bankaları a¸cısından kritik bir rol oynamaktadır. T¨urkiyedeki bankalar arasında son yıllardaki rekabet g¨oz ¨on¨une alındı˘gında, bankaların ¸subele¸sme ve di˘ger fiyat dı¸sı stratejilerinin daha ¨onemli hale gelece˘gi beklen-mektedir.
Anahtar Kelimeler: Bankacılık, Rekabet, Fiyat Dı¸sı Davranı¸slar, S¸ube A˘gı, Mevduatlar ve Krediler.
ACKNOWLEDGMENTS
I would like to thank my advisor Assoc. Prof. Dr. S¨uheyla ¨Ozyıldırım for her immense and continuous support from the beginning of this thesis studies till the end. Trying to express my feelings with a few sentence is so weak for her contribution to this study and also to me as an advisor. I should emphasize that the most important payoff during the master program in Bilkent University was working with her.
It was my pleasure to get advices and contributions from Prof. Dr. Hakan Berument for reading and giving invaluable contributions especially for the econometric parts of the thesis.
I would also like to thank Assist. Prof. Dr. Ba¸sak Tanyeri for reading and giving invaluable comments.
I like to convey thanks to T ¨UB˙ITAK for the financial support they pro-vided for my graduate study.
Last but not least, I would like to thank my family. Words are insufficient to express my feelings for them.
TABLE OF CONTENTS
ABSTRACT iii
¨
OZET v
ACKNOWLEDGEMENT vii
TABLE OF CONTENTS viii
LIST OF TABLES x
LIST OF FIGURES xi
CHAPTER 1: INTRODUCTION 1
CHAPTER 2: LITERATURE REVIEW 8
CHAPTER 3: TURKISH BANKING SECTOR 14
3.1 Overview of Turkish Banking Sector . . . 14
3.1.1 General Structure . . . 14
3.1.2 Regulatory Environment . . . 20
3.1.3 Public Banks . . . 22
3.2 2000 November-2001 February Crises and the Banking Sector 24 3.3 Restructuring Program and Branching Strategies . . . 27
3.3.1 Banking Sector Restructuring Program . . . 27 3.3.2 Non-Pricing Characteristics and Branching Strategies . 31
CHAPTER 4: THE MODEL 35
CHAPTER 5: DATA AND METHODOLOGY 38
5.1 Data Set . . . 38
5.2 Methodology . . . 42
5.2.1 Fixed Effect Models . . . 45
5.2.2 Random Effect Models . . . 46
5.2.3 Panel Generalized Method of Moments . . . 47
CHAPTER 6: EMPIRICAL RESULTS 49 6.1 Empirical Results For All Deposit Banks . . . 49
6.2 Empirical Results for Large Versus Small Scaled Banks . . . . 50
6.3 Empirical Results for Private Versus Public Banks . . . 52
CHAPTER 7: CONCLUSION 56 BIBLIOGRAPHY 59 BIBLIOGRAPHY 59 APPENDICES 66 A: DESCRIPTION OF VARIABLES . . . 66
LIST OF TABLES
3.1 Number of Banks and Branches . . . 18
3.2 Bank Concentrations, 2000-2008 . . . 19
3.3 Turkish Banking Sector, 2003-2008 . . . 32
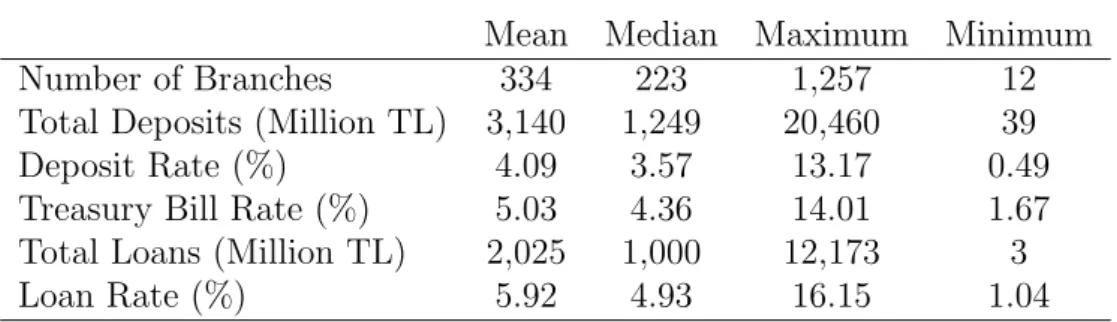
5.1 Some Balance Sheet Items of Banks (as of 2008, thousand TL) 40 5.2 Descriptive Statistics for All Sample Deposit Banks . . . 41
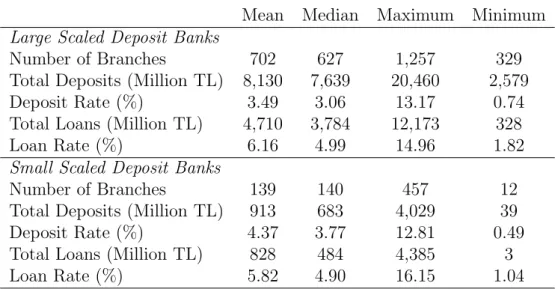
5.3 Descriptive Statistics for Large and Smalle Scaled Banks . . . 42
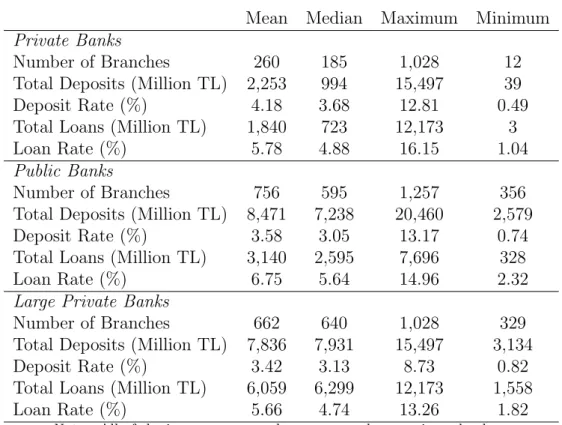
5.4 Descriptive Statistics for Private and Public Banks . . . 43
5.5 Hausman Endogeneity Test . . . 47
6.1 Regression Results for Loans per GDP . . . 54
6.2 Regression Results for Deposits per GDP . . . 55
B.1 Regression Results for Loan Estimation . . . 69
B.2 Regression Results for Deposit Estimation . . . 70
B.3 Regression Results for Loan Estimation . . . 71
LIST OF FIGURES
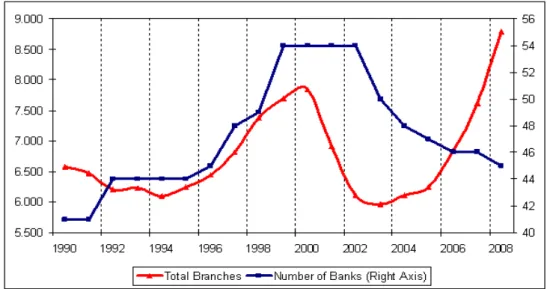
3.1 Financial Sector in Turkey as of 2008 (Source: CBRT) . . . . 15 3.2 Loans to Assets and Securities to Assets Ratios . . . 20 3.3 Ratio of Profits Generated Through Securities . . . 21 3.4 Percentage Share of Public Banks’ Assets in Total Assets . . . 23 3.5 Average Overnight Interest Rate in Interbank Market . . . 25 3.6 Ratio of Matured Receivables to Loans . . . 28 3.7 Number of Branches in Turkish Banking Sector (Source: TBA) 34
CHAPTER 1
INTRODUCTION
Banks are providing financial services to firms and consumers. Banks also have the intermediation function for holding and exchanging financial assets. They enable profitable investments by collecting deposits and lending loans. Recent studies show that institutional and financial structures of banks and their roles in the economy are important for economic growth and social welfare (King and Levine (1993), Levine (1995, 1997), Demirg¨u¸c-Kunt et al. (2004)). When banking system does not work well there is potential for financial instability (Borth, Caprio, Levine, 2004).
Using bank level data and applying Panzar and Rose (1987) methodology, Claessens and Laeven (2004) calculated H statistics for 50 countries includ-ing Turkey to identify their market structure. They found that H statistics varies generally between 0.60 and 0.80 which suggests that monopolistic com-petition was the best description of the degree of comcom-petition in a banking sector. In the monopolistically competitive markets, both the pricing and non-pricing behaviors stimulate differentiations among the banks. In a com-petitive market structure, banks, in general, try to differentiate themselves to obtain higher market share and increase their market power to earn more profits. Banks may distinguish themselves in many ways: It may be reputa-tion, product differentiation and extensiveness and location of their branch
networks (Northcott, 2004).
Yayla (2005) showed that asset concentration ratio1 in Turkish banking
sector began to increase after 2000 suggests less competition after crisis, how-ever, it stabilized around 0.6 which suggests monopolistic competition in the sector during the period 2003 to 2008. Turkish banking sector changed sig-nificantly in this period. More precisely, there have been privatization efforts for the public banks, mergers and acquisitions of both public and private banks, excessive foreign bank entries and also introduction of new rules and regulations to the sector. Thus, the competition in the market has been more aggressive than ever in recent years. More recently, C¸ elik and ¨Ur¨unveren (2009) also showed that banking sector is monopolistically competitive in Turkey.
Competition in the banking sector, is constituted by pricing and non-pricing competitions while non-pricing component takes place in the loan and deposit rates. However, non-pricing competition among banks is generally measured by advertising strategies or branch size (see, for example, Stigler (1968), Scott (1978), Kim and Vale (2001)). The determination of the strate-gic branching policy has always been a popular subject for researchers. For example, Kim and Vale (2001) examined the effects of branch size on banks’ extracting market power performance which was measured market share in terms of total loans in Norway. They found that there is a positive relationship between the market share of the bank for loans and its branch network, which is measured by number of branches, while there is no relationship between market size of the bank and its branch network. Calcagnini et al. (1999) ex-amined the determinants of the banks’ branching strategies in Italy and found that existing market structure influenced de novo branching.2 Moreover, they
1Concentration is a measure which shows how much of the total output in an industry
is produced by the largest firms in that industry. It is widely used as an indicator for determining market structure.
2De Novo Branch means a branch office of a bank which is originally established by the
showed that profitable banks with larger number of workers per branch and large amount of loans relative to deposits had more de novo branches. Carlson and Mitchener (2005) analyzed the effects of branching policy of the banks on the competition and the survival of these banks when there was a probable crisis in the economy. They found that effects that branching had on com-petition was quantitatively more important than geographical diversification for the bank stability.
Turkish banking sector faced two major crises in 2000 and 2001. Before 2000-2001 crisis, banks in Turkey has mainly invested on government debt instruments instead of private loans. Even in 2002, the share of government debt instruments in their total assets was was around 42% for all banks in Turkish banking market. This ratio decreased to 28% in 2008. However, as it was mentioned before it changed significantly in the post-crises period. Banks in Turkey have not been financing government debts as much as in the pre-crises period instead, they concentrated on exercising core financial inter-mediation function, loan lending and deposit collecting, for private investors and consumer since 2003. The regulatory environment of Turkish banking industry had also changed. Banking Regulation and Supervision Agency of Turkey (BRSA) was established in June 1999 and began to operate in Au-gust 2000. Before this institution, the regulation and supervision of banking system had a fragmented structure. This new independent authority has de-veloped legal and institutional framework to increase supervision and audit in the sector to make the sector more efficient and competitive.3
In Turkey, there is a strong link between financial sector and whole econ-omy.4 The banking sector comprises approximately 80% of the financial sector in Turkey (BRSA Report, 2009). According to the financial reports of the banks, total assets of Turkish banking sector increased about 75% between
3Source: http://www.bddk.org.tr/WebSitesi/english/About Us/About
BRSA/5804BRSA-Eng.pdf
the years 2001 and 2008. The share of total loans in total assets had increased from 25% to 52% within the same period. Deposits that have been the major sources of bank loanable funds kept their share in the total liabilities, i.e. between 65% and 70%. Since Turkish banking sector made good progress in this period, it is worth to analyze the impact of branching strategies to these developments.
The number of branches of Turkish banks increased by almost 27% from 6,908 in 2001 to 8,790 in 2008. In fact, between the years 2001 and 2005, number of branches of all deposit banks decreased about 10%. However, af-ter 2005 it increased almost 30% till 2008. In addition to the increase in the number of branches, both total loans and deposits per branch also increased during this period. As stated in the site of TBA, total loans per branch were 4.1 Million USD and reached to 27.3 Million USD in period 2001-2008. Similarly, total deposits per branch increased from 11.7 Million USD in 2001 to 33.9 Million USD in 2008. Since 2005 foreign banks have entered heavily to the Turkish banking sector by acquiring small banks. They opened many branches relatively in a short period of time. The number of branches of foreign deposit banks rised sharply from 209 to 2,034 in 2003 to 2008 pe-riod. Pehlivan (2004) stated that marketing concept was an alien concept for Turkish banks. Foreign banks however, came with their marketing strategies and established their marketing departments. In a short time, Turkish banks became aware of this concept and developed their own marketing strategy.
In the post-crises period, financial intermediation performance of the Turkish banking sector has been an interesting research area to investigate. In this thesis, our main aim was to explain the effects of branch network size to the financial intermediation performance of the deposit banks. We used changes in loans to GDP and deposits per GDP as proxies for the financial intermediation performance measures of the banks. In the first model, we examined the effects of branch network strategies to the lending performance
of the banks. In this model, we hypothesized that there is a positive relation-ship between the branch network size of banks and their total loans per GDP. In the second model, we estimated the effects of branch network strategies to the of deposit collecting performance of the banks. Similarly, we hypothe-sized that there is a positive relationship between the branch network size of banks and their total deposits per GDP. Both models were conducted for large scaled versus small scaled banks and public versus private and large private banks in Turkey. Large scaled banks are the largest seven banks in terms of their asset size. Asset size of the largest bank in the small scaled bank sample has evidently too small asset size. In this way, we aimed to explore whether the impact of non-pricing behaviors of banks on the financial inter-mediary performances vary among different scaled and different ownership type of banks in Turkey.
Although there are several other non-pricing behaviors in Turkish banking sector, we only used the number of branches because of the limitation in available data set. The banks were limited with the deposit commercial banks since other type of banks such as investment and development banks have no competitive behavior. They have few branches and give directed credits which encourages investments without collecting deposits.
In Turkey, the banking sector is very dynamic in the sense that they adapt new product and create alternatives immediately. Especially in the credit card market, the differenciation efforts of banks confirmed excessive competition in this sector. They offer special credit cards that consist many benefits for their holders. For example, the cardholders are able to purchase goods with installments without bearing any additional cost. They also offer special discounts, gifts and assistance services via telephone. FlexiCard is one of the credit cards with differentiated specialties. It lets users to choose the interest rate, rewards plan, fee and even the design on the card itself. A client can pick a higher or lower interest rate and at the same time get a
more or less generous bonus plan, and can decide how much of their annual fee they want to pay with the bonus points they earn. Another non-pricing effort is internet banking which was started to be used in late 1990s. Banking operations become cheaper and faster for internet banking users. The banks even started to use 3G technology recently. They send videos related to daily market reports to their customers via this technology. In 2002, the president and CEO of Garanti Bank, Ergun ¨Ozen stated that “We [banks] invest in technology and human resources much better than our competition; this gives an edge in producing an unmatched level of services and product range for our customers.”
In our estimations to relate the impact of network of branches on the total loans and deposits of the deposit banks during the period of 2003-2008. First, we found that there is a positive and significant association with the number of branches and total loans per GDP for all banks except public banks. We also observed positive impact of network branches on the total deposits per GDP for all banks. The empirical findings showed that by increasing the branch network, a bank may collect more deposits per GDP. We also found that banks are, in general, price elastic in the loans and deposits market. Only for the large private banks, savers would not care much about the prices of the deposits that they invest. It seems that they make their decisions according to the non-pricing attributes of the banks. For example, large scaled banks offer special type credit cards, different type of services such as tailor-made solutions via private banking, using 3G technology to send economic reports etc. Moreover, they may also trust to these banks more relative to small scaled banks.
The remaining part of this study was organized as follows: Chapter 2 summarized the banking literature about non-pricing strategies of the banks. Brief information about the Turkish banking sector was given in Chapter 3. The empirical model was introduced in Chapter 4. Data set and
methodol-ogy were explained in Chapter 5. The empirical results were summarized in Chapter 6 and the thesis was concluded in Chapter 7.
CHAPTER 2
LITERATURE REVIEW
The performance of a bank is significantly related with the pricing character-istics but it is not enough to explain completely the financial intermediation performance of the banks (Berger and Hannan, 1989). Banks’ performances are comprised of both pricing and non-pricing attributes of the banks. Non-pricing behavior of a bank may take many forms. Scott (1978) examined non-pricing competition in banking and took advertising and branching of deposit banks as examples of non-pricing competition in imperfect markets. Pinho (2000) studied non-perfectly competitive behavior in Portuguese bank-ing market. He found evidence that interest rate and entry deregulation were associated with an increase in both price and non-price competition in the deposit market. Nowadays, the banks are imposing more importance to the non-price characteristics such as branching strategies, special credit cards,5
Automated Teller Machines (ATM) networks, internet banking services or personnel attributes.
In the literature, there are studies to describe the effects of the mar-ket structure of the banking sectors to the competition intensity among the banks. Frexias and Rochet (1997) showed that, the optimal choice of loan and deposit volumes for banks in the perfect competition is the point where
5In Turkey, Fish card, Miles & Smiles, Wings Card are some of examples for special
the marginal profits are equal to the marginal management costs. If the market is perfectly competitive, then the behavior of a bank does not affect the market equilibrium. However, the market in which banks operate is not a perfectly competitive market. As Bikker and Haaf (2000) showed for the developed countries, banking markets are generally characterized as monop-olistic competition. For the developing countries; Yeyati and Micco (2003) and Gelos and Roldos (2002) found the same market conditions for banking sector. In this market structure, there is stiff competition between banks because the number of banks may increase rapidly whilst total market share is limited. Moreover, Panzar and Rosse (1987) introduced a measure called H statistics which is a measure of competitiveness. This measure is obtained as the sum of elasticities of gross revenue with respect to input prices.6 If this statistics is negative, then it can be stated that this firm is operating in a monopoly. The statistics will be positive but smaller than one when the market is monopolistically competitive or it is equal to one when the market is perfectly competitive. Similarly, Claessens and Laeven (2004) calculated H statistics for banking sector in 50 countries including Turkey during the period of 1994-2001. They found that H statistics lies between 0.60 and 0.80 suggesting market conditions of banking in these countries as monopolistically competitive. De Bandt and Davis (2000) measured the competition for bank-ing sectors in France, Germany and Italy by usbank-ing interest income and total income as pricing attributes of banks. They presented evidence that banking
6H statistics was firstly initiated by Panzar and Rosse in 1987. They constructed a
model log T R = α + n ∑ i=1 βilog wi+ k ∑ j γjlog CFj+ error
in which assumed n input and single output production where T R denotes total revenue,
wi is the i-th input factor and CF is other firm specific control k-factors. They suggested
that H statistics which can be calculated as: H=
n
∑
i=1
βiis the sum of input price elasticities.
Thus it reflects the competitive structure of the market. Moreover, they proved that H statistics is negative for a neo-classical monopolist or collusive oligopolist, between 0 and 1 for a monopolistic competitor, and equal to unity for a competitive price-taking firm in long-run competitive equilibrium.
markets in these three countries are not perfectly competitive, rather they are monopolistically competitive. Humprey and Rodriguez (2003) examined Spanish banking market and showed that the market is imperfectly competi-tive. The case in Turkish banking sector is also the same as the international examples. C¸ elik and ¨Ur¨unveren (2009) showed that, Turkish banking sector is a monopolistically competitive market. In the banking sector, competition is mainly composed of pricing and non-pricing competition as in most sec-tor. However the competitive nature of banking industry compels banks to use non-pricing tools intensively to differentiate themselves to achieve higher market shares.
In banking literature, there are many studies which are examining for the price characteristics of the banks, namely the loan rates and deposit rates. Barros (1995, 1999) used the differences in the regional markets in Portugal as a strategic variable in the bank loan and deposit pricing. He found that there were higher levels of competition for deposit pricing than loan pricing in Portugal banking sector. Similarly, Corvesier and Gropp (2002) found that there was a high intensity of price competition for savings and time deposits than pricing of loans and sight deposits. There are studies that indicate stickiness of the prices in banking markets. For example, Hannah and Berger (1991) argued that banks quoted interest rates for deposits are sticky in the sense that they vary less than the market interest rates. They showed that stickiness increases with market concentration. Berger and Udell (1992) found that credit rates in US are also relatively sticky, in the sense that an increase of one percent in the T-bill rate only leads to an increase of 0.5% of credit rates. Since prices are, in general, sticky in the banking sector, consumers would be more sensitive to non-pricing efforts.
In banking literature, studies on the non-pricing competition among banks widely concentrated on the branching decisions and its effects to the banks. For example, Zardhoohi and Kolari (1994) examined the branch level
effi-ciency in Finland. They showed that branch level effieffi-ciency increased with the number of branches in a network. Moreover, they found that this effect leveled off if the network size was less or equal to five branches. In order to catch up optimum branch network size, they argued that the general trend should be the consolidation in the banking industry. Scott (1978) claimed that a firm increased its use of non-price competitive devices (branching and advertising) as its market power initially increased from a low level. How-ever, its use of non-price rivalry would eventually decreased as its market power increased beyond some intermediate level as in US banking market. Kim and Vale (2001) argued that in oligopolistically-competitive markets such as in Norway, non price considerations may be the most important tool by which firms differentiated themselves and extracted market power. They used branching decisions of the banks as a strategic behavior parameter and showed that rival banks’ reactions were affecting significantly the branching decision of the corresponding bank. They found that as the branch network of a bank increased total loans supplied increased. Additionally, if rival’s branch network increased the amount of loan provided would decrease. Sim-ilarly, Valverde et al. (2005) studied the same model introduced by Kim and Vale (2001) both for loan market and deposit market in Spanish bank-ing market. Rival behaviors in the loan and deposit market were also taken into consideration. They found that branching strategy was more important for deposit competition compared to loan competition in Spain. Cesari et al. (2002) constructed a monopolistic competition model for the European bank-ing system. They found that competition has become intensified especially after deregulation. They argued that banks were choosing their branching strategies according to the degree of competition on interest rates.
Dick (2003) examined the effects of the passage of the Riegle-Neal Act which allowed for nationwide branching in US on various aspects of banking markets and found that the increase in concentration in larger geographic
areas covering several states increased competition in the lending market. Kim et al. (2007) examined Spanish banking sector for both savings banks and private banks in order to measure the ideal branching strategy. They found that for both bank types, opening new branches is ideal strategy both for loan and deposit efficiency. Dereli et al. (2007) explored the branching strategy of one bank that operates in Turkey during the period 2005-2006. They presented evidence that this particular bank used an estimation of ad-ditional amount of potential deposit collected by this bank when she adds a branch to her network. They also found that the critical components to es-tablish branch are the level of national output (GDP) and public investments, and the population of the relevant branch location
Hirtle (2007) found no systematic relationship between branch network size and overall institutional profitability in US during 2003:Q3. Moreover, she claimed that there is a weak relationship between branch network size and overall bank profitability since the banks optimized the size of branch net-work as part of an overall strategy both branch based and non-branch based activities. She concentrated on small business loans, deposits and branch network size as branch performance proxies and argued that previous studies ignored the most recent technological innovations, i.e. the advent of internet banking, the proliferation of automated teller machines and increasing num-bers of call centers when they study the impact of branching. In this thesis, we were unable to incorporate recent product and technology developments in the Turkish banking sector due to unavailability of data. Although we studied the fixed effect estimation to accommodate these developments, the results are not validated econometrically to report in this thesis.
There were also several studies on the non-pricing behavior of the banks related to credit card market and ATM network (see for example, Rochet and Tirole(2002), Matutes and Padilla (1994), Dick (2007), Nash and Sink-ley (1997)). In Turkey, Akın et al. (2008) analyzed the non-price
competi-tion for the credit card market and found that in order to acquire market power, banks bundle their cards with other banking services and differentiate themselves by providing a number of non-price benefits to their credit card customers. Moreover, they argued that general quality of bank services, dis-tributing money points, travel miles and similar benefits, enabling consumers to pay shopping bills in installments and offering discounts to cardholders are important factors for card choice of bank cardholders. Damar (2006) inves-tigated whether shared ATM networks yields positive benefits for banks by increasing their productive efficiency in Turkey. He argued that even though it is possible to realize positive effects to the banks, there are multiple factors that determine these benefits. Mainly, these factors are geographical distri-bution of shared ATM networks between urban and rural areas and level of competition between banks.
In this thesis, we estimated the branching decisions on the banks’ finan-cial intermediation performance which we used the proxy of change in the ratio of loans to gross domestic product and the ratio of deposit amounts to gross domestic product for the intermediation performance. Using these performance measurements, we constructed a model to study how branching affected banks performances during the period 2003:1-2008:12. We classified banks as large versus small scaled banks and public versus private and large scaled private banks to identify variations of branching effects among banks according to their ownership type or asset size.
CHAPTER 3
TURKISH BANKING
SECTOR
In this chapter, there are three sections: In the first section, general overview of the Turkish banking sector since 1990s was presented. Financial crises in 2000 and 2001 and their impact on the banking sector were summarized in the second section. Lastly, banking restructuring program and branching policy of the Turkish banking sector were reviewed.
3.1
Overview of Turkish Banking Sector
3.1.1
General Structure
Since 1990s, Turkish economy experienced several banking crises due to moral hazard problems, huge public sector deficits, high real interest rates, ex-tremely risk taking behavior of banks, high inflation and volatile economic growth (Ertu˘grul and Sel¸cuk, 2002; Kibrit¸cio˘glu, 2005). During the period 1990-2001, while the average growth rate of GDP was around three percent, the volatility (standard deviation) of the GDP growth rate was reaching six percent which can be considered very simple evidence of instability in the economy. The economy had been exposed to crisis in 1991, 1994 and 1998 (BRSA, 2009). The ratio of net debt of the public sector to GDP exceeded
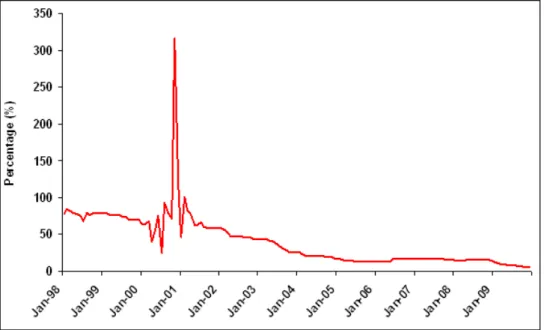
60% within the same period. Moreover, overnight interest rates increased to 150% annually in 1994 and 2,300% in 2000.
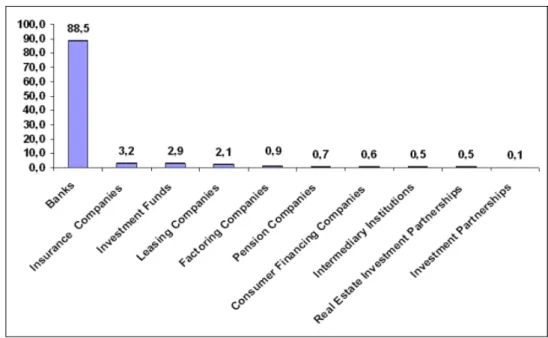
Figure 3.1: Financial Sector in Turkey as of 2008 (Source: CBRT)
Macroeconomic and political risks have been impinged on Turkish banking systems health. Nevertheless, the banking sector is still in development pro-cess and has further growth potential. According to the Banks Association of Turkey (TBA) (2009), the ratio of financial assets consisting of bank assets, bank shares and public and private borrowing instruments to GDP is 150% in Turkey as of 2007 whereas this ratio is 246% for other developing countries and 421% for the world. The main component of the Turkish financial sec-tor has been the banking system. The share of Turkish baking secsec-tor in total assets of the Turkish financial sector reached 88.5% as of December 2008 (Fig-ure 3.1). The remaining part of the financial sector, which is mostly owned or affiliated with the major commercial banks, consists of insurance compa-nies, factoring compacompa-nies, leasing compacompa-nies, consumer financing compacompa-nies, pension companies, intermediary institutions, investment funds, investment partnerships and real estate investment partnerships. Although banks consti-tute the major part of the financial sector in Turkey, the size of the banking
in the Central and Eastern Europe: The ratio of the asset size to GDP in-creased to 77.1% as of 2008 from 62% as of 2000. The main reason that led the sector to be inefficient in terms of providing intermediation service can be summarized as volatile macroeconomic environment, small capitalization of the banks, weak risk and management applications, insufficient audit mech-anism and modern legal framework, full deposit insurance applications and public banks which were dominating the banking sector (BRSA, 2009).
There were 56 commercial banks at the end of 1990. But only five of them had total assets of larger than 10 billion TL. These five banks were composed of 50% of the banking sector in 1990 and this ratio was kept its level even in 2000 (see Table 3.2, for CR5 in 2000). However, there was a notable increase in 2001 and 2002 due to the failure of some banks and consolidation of public banks in Turkey. There was 8 public deposit banks in 1990 while it decreased to 3 in 2003 while total number of banks also decreased from 67 to 50 during this period.
Since the number of banks decreased significantly after 2002, market share of the largest bank become relatively higher. More precisely concentration ratio for five largest banks did not change much and stabilized around 65% for assets and deposits. On the other hand, the concentration ratio for the branches started to decrease by 2005 suggesting more competition in terms of branches. In 2005 by the announcement of Turkey as a candidate country to European Union, significant foreign entries to the banking sector occurred. These banks entered the market by taking over the existing small private banks with good branch network. As seen in Table 3.1 foreign deposit banks’ branches increased almost 10 times (from 209 to 2034) during 2003 to 2008. Their heavy branching strategies are aimed to have higher market power immediately in the sector.
According to HHI, CR3 and CR5 values, Turkish banking sector seems to be more like “monopolistically competitive”. Another interesting and notable
market structure is the existence of dominating large scaled, private and public banks. As it will be seen in Table 5.1 and according to concentration ratios in Table 3.2, public banks are among the largest banks in Turkey.
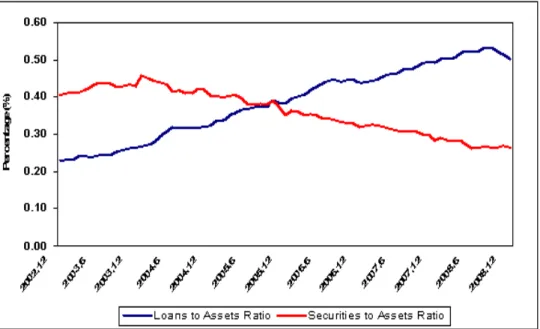
The loans share in the total assets of the banking sector had decreased while the share of the securities increased sharply since 1990s till the twin financial crises in 2000 and 2001. The share of the securities in the total assets were around 10% in 1990 and reached to 41% in 2002. On the other hand, loans to asset ratio of banks decreased from 47% in 1990 to 23% in 2002 (Figure 3.2). As reported by BRSA (2009), “As a consequence of macroe-conomic and political stability secured in 2002-2008 periods and appropriate policies for banking sector, total assets of the sector grew with an annual average of 23%. Owing to the fact that intermediation activities which are the basic function of the sector could be concentrated on, loans became the item displaying the highest increase throughout the period. In 2002-2008 pe-riods, total loans grew with an annual average of 40%.” As of 2008, the share of loans in the total assets of the banking sector reached to 50% while the securities ratio to the total assets decreased to 26% (Figure 3.2). As shown in Figure 3.2 these ratios are clearly indicating that the crowding out effect of the government decreased while the loans provided to real sector relatively increased within this period.
During the twin crises, since the public sector debt requirement were in-credibly high; Treasury had to sell its debt instruments with a very low ma-turity and a high interest rate in order to finance public deficits.7 In fact,
managers of the banks made economically rational choices and provided their loanable funds to government as a riskless and very profitable investment in-stead of lending to real sector. Because the exchange rate regime was also convenient to take currency risks in 2000,8 banks borrowed also foreign cur-7An auction with a 28 days maturity and 144.23% interest rate was done in February
2001. Moreover, there were also auction announcements but did not happen due to no bids offered by the investors.
T able 3.1: Num b er of Banks and Branc hes 1990 2000 2003 2008 Num b er Num b er Num b er Num b er Banks Branc hes Banks Branc hes Banks Branc hes Banks Branc hes Dep osit Bank 56 6,543 61 7,807 36 5,949 32 8,741 Public 8 2,975 4 2,834 3 1,971 3 2,416 Priv ate 25 3455 28 3,783 18 3,594 11 4,290 SDIF -11 -2 175 1 1 F oreign 23 113 18 117 13 209 17 2,034 Non-dep ository Banks 10 10 18 30 14 17 13 49 Public 3 3 3 11 3 4 3 23 Priv ate 4 4 16 14 8 9 7 23 F oreign 3 3 3 3 3 3 3 3 T otal 67 6,566 79 7,837 50 5,966 45 8,790 Source: TBA. SDIF stands for banks in the Sa vings Dep osit Insurance F und.
T able 3.2: Bank Concen trations, 2000-2008 2000 2001 2002 2003 2004 2005 2006 2007 2008 Conc entr ation R atios (CR) CR3 Asset 0.32 0.39 0.49 0.46 0.45 0.48 0.44 0.43 0.43 CR5 Asset 0.50 0.59 0.71 0.64 0.63 0.66 0.66 0.65 0.65 CR3 Dep osit 0.38 0.38 0.48 0.45 0.46 0.48 0.45 0.45 0.44 CR5 Dep osit 0.51 0.56 0.70 0.63 0.64 0.67 0.65 0.65 0.65 CR3 Branc h 0.40 0.48 0.44 0.45 0.45 0.44 0.41 0.38 0.37 CR5 Branc h 0.51 0.64 0.61 0.64 0.65 0.62 0.59 0.55 0.55 Herfindahl Hirschman Index (HHI) HHI Asset 643 836 883 1,058 1,058 1,077 1,050 1,027 1,034 HHI Dep osit 763 879 987 1,073 1,150 1,128 1,094 1,080 1,089 HHI Branc h 633 670 701 1,028 1,047 1,009 932 861 835 Num b er of Banks 78 61 54 50 48 47 46 46 45 The Banks Asso ciation of T urk ey . CR3 (CR5) is mark et share of three (fiv e) largest banks in the sector. CR5 > 0 .80 indicates high concen tration. 10000 ∗ ∑n i s 2 i where n is total n um b er of banks and si is mark et share of bank i. If HHI < 10000, mark et can b e considered as comp etitiv e whereas ≤ HHI < 1800, the mark et is mildly concen trated.
Figure 3.2: Loans to Assets and Securities to Assets Ratios
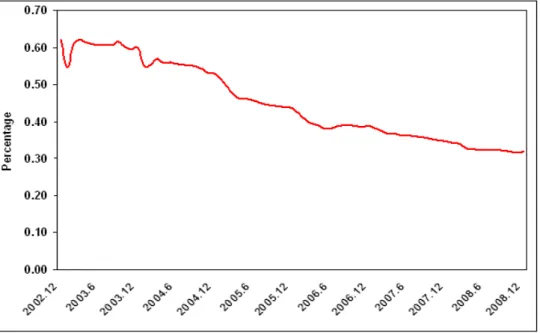
rencies relatively with lower rates and invested to domestic government bonds. At the beginning of 2000s, the net income of Turkish banks was heavily com-posed by Treasury activities. As seen in Figure 3.3, it was still above 60% of their net income as of 2002. It can be argued that the banking sector was not fulfilling its main intermediary role well before 2002. However, the bank-ing sector has been always producbank-ing higher rates of return. Its profitability was consistently three to five times higher than the norms in most OECD countries (McKinsey Global Institute Report, Retail Banking, 2003).
3.1.2
Regulatory Environment
The 1985 Banking Law (Bank Act No. 3182) was the first major attempt to regulate banking sector in Turkey. According to this law, Treasury was the institution that was responsible for regulating the banking sector till 1999. While Treasury was the responsible institution to regulate the sector, it was also responsible to meet the day to day financing needs of the government of which are done through deposit banks generally. This duality was one of the main causes of politicizing the banking supervision and regulation
Figure 3.3: Ratio of Profits Generated Through Securities
activities in Turkey. In 1999, a new act was launched, namely Banks Act No. 4389. Banking sector aimed to synchronize with the international banking regulation standards. By this law, BRSA has been established which is an independent council in order to monitor and regulate the banking sector. However, this law also changed eight times till 2004. Lastly, a new Bank Act was launched, namely Bank Act No. 5411 in late 2005. According to international banking standards, this law can be considered as a modernist law.
Explicit deposit insurance was introduced in Turkey in 1983. Initially, the insurance fund offered a limited coverage for the depositors and funded by premiums paid by the commercial banks. Later, it turned to full deposit in-surance scheme during the 1994 currency crisis and blanket guarantee during 2000-2001 twin crisis.9 As emphasized in the literature extensively (see for ex-ample Demirg¨u¸c-Kunt and Detragiache (2002) and Demirg¨u¸c-Kunt and Kane (2002)), explicit insurance increases the risk attaching to the asset portfolios of commercial banks. Moreover, full deposit insurance promotes significant
9See Demirg¨u¸c-Kunt, Karacaovalı, and Laeven (2005) for details of insurance in Turkey
moral hazard problems in the banking systems. As documented by Denizer et al. (2000) and ¨Ozyıldırım and ¨Onder (2008), Turkish banks undertook excessive risks especially in the period with full government guarantee on de-posits. Tanyeri (2010) stated that there was lack of transparency in the same period.
In July 2000, as part of the disinflation program,10 government started
to phase out the full deposit insurance, by lowering the ceiling to 100 billion TL.11 In July 2003, the BRSA announced that it would adhere to the full
deposit insurance, but that it would reduce the coverage to deposits that are below 50,000 billion TL by July 2004, which was executed as planned. This ceiling is broadly in line with the deposit guarantee in EU countries, whereby the level of deposit protection varies between 20,000 euro and 60,000 euro, however it is still high for Turkey, given that its average income per capita is about one-fifth of that in the EU. Moreover, ceiling covers over 90% of the accounts by the number of accounts, but only about 60% by the size of accounts.
3.1.3
Public Banks
Existence of dominating effect of public banks in the sector was one of the discrepancies for the efficiency in the banking sector. La Porta et al. (2000) found evidence that there is a negative relationship between the degree of government ownership of banks and overall economic growth and productivity growth. In Turkey, the number of public banks declined from 12 in 1980 to eight in 1990 and four in 1999. At the end of 1990s, bad policies of government
10An economic program documented in December 1999, which aimed to reduce inflation
rate until the end of 2002.
11Licence of ˙Imar Bankası was revoked in June 2003 and its management also transferred
to Savings Deposit Insurance Fund (SDIF). It was seen that the bank made off-the-record transactions because there were differences between the actual total deposit and the deposit notified to public authorities. It is stated that this was a rare corruption example in the banking history of the world. For ˙Imar Bank case, new resources was allocated since SDIF’s resources could not afford its cost. Deposit owners were paid a total amount of 8.6 billion TL as end of 2008.
Figure 3.4: Percentage Share of Public Banks’ Assets in Total Assets
with the excessive risk taking of banks led public banks to over-branched and over-staffed (Zaim, 1995). Ziraat Bankası, Halk Bankası, Vakıflar Bankası and Emlak Bankası12 were the public banks which dominated the banking
sector in 2000s, of which first three of them are still operating as public bank (see Table 3.1). As shown in Figure 3.4 their total assets share in the sector was 40% at the end of 2002 while it was still high in 2008 which was around 30%.
The dominant share of public banks has distorted the efficient resource allocation of banks in Turkey. As examined by Steinherr et al. (2004), the personnel regime in the public sector deteriorated the production efficiency of public banks in Turkey until 2000-2001.
12Emlak Bankası was transferred to Ziraat Bankası in 2001 by the decision of BRSA.
In the same year, 96 branches which were transferred to Ziraat Bankası decided to be transferred to Halk Bankası.
3.2
2000 November-2001 February Crises and
the Banking Sector
Before 2000, Turkish economy faced crises frequently because of unsustain-able debt dynamics and some structural problems in the financial sector. As of December 1999, a new exchange rate based economic program had been launched to decrease inflation rate, to get sustainable economic growth rate and ensure the stability in the economy. The letter of intent was signed with IMF as of December 9, 2000. It proposed a three-year stand by arrangement. As highlighted by Aky¨uz and Boratav (2002), such programs generally lead to currency appreciations and relying on capital inflows attracts by arbitrage opportunities to finance growing external deficits. The program for Turkey sets forth a determined exchange regime for one 18 months period. It was programmed to be increased 20% of exchange rates for a year. This led banks to take risks of being in short of foreign exchanges more easily. On the other hand, inflation rate targeted to be decreased. There were performance crite-ria comprise of both primary surplus, privatization and both new and stock external of debt. This program was also aimed to make structural reforms on agriculture, pensions, fiscal transparency and tax administration. It had an exit strategy in order to avoid the negative effects of determined exchange rate regime (see Vegh 1992). Following 18 months, it designed to shift from determined exchange regime to progressively widening band around a deter-mined path to achieve a smooth transition the floating rate regime effectively. At first, this program received both public’s and IMF’s support and confi-dence. Moreover, since Turkey was announced to be an official member to be considered for European Union enlargement net capital inflow increased notable. As capital inflow continued, money market liquidity increased, and overnight interest rates decreased significantly (Figure 3.5).
Figure 3.5: Average Overnight Interest Rate in Interbank Market
were positioning aggressively themselves by purchasing more government debts and engaging repo funding for short term financing needs. Central bank lending to the banks in the interbank market and also providing liquidity to the market by purchasing government securities amounted approximately 4.3 billion USD. However, the net domestic asset ceiling was exceeded and the net international reserve floor was reached. First, the loss of credibility of the monetary authorities concerned the investors on the viability of the program. Then, capital outflows started to increase. The capital outflows triggered massive demand to foreign currencies led these capital to exit. Thus, liq-uidity crisis occurred on November 2000. Since the program did not allow interfering to interest rate, the interest rates raised sharply, i.e. overnight interbank interest rates jumped to even 2,300% in 2000. Finally, IMF an-nounced a 10 billion USD package in order to avoid any possible speculative attack.
This program could not be able to match its aims because there were some structural problems and fragilities on public finance and banking sector in that period. In particular, banks exploited the arbitrage opportunities of borrowing at low cost abroad and investing high-yielding government debt
instruments. In expectation of further decline of interest rates due to disin-flation, banks increased their long term fixed-rate government debts. This deteriorated the financial position of the banks and raised their liquidity, interest rate and currency risks. Additionally there was also political insta-bility. The government could not be able to fulfill some of the commitments set by the program. For example, according to the program,13 21 public
en-terprises were supposed to privatized. Furthermore, regulatory measures of the banking sector had been delayed.
Speculative attack to the currency and capital outflow in November 2000 were overcome by a very high interest rate and loss of foreign exchange re-serves and IMF credit amounting 7.5 billion USD. However, just after three months later, a political dispute fired another financial crisis. This time it was a currency crisis. As of 21st of February, interbank overnight interest rate was 6,200%. Central Bank of Turkey’s currency reserve decreased ap-proximately 5.4 billion USD within a week. Since the Central Bank could not survive to this attack exchange rate regime changed to floating rate regime immediately.
Since banks faced two severe crises, their balance sheets were significantly deteriorated. Banks were obliged to be rehabilitated in order to have sound banking system in Turkey. The fragmented regulation and supervision played role in fragility of Turkish banks ( ¨Ozatay and Sak, 2003). In fact, SDIF has been established in 1983 by Decree Law No. 70 of the Banking Law and the Central Bank of the Republic of Turkey was empowered with its administration and representation. With the amendment of Banks Act No. 4389, the government decided to set up an independent institute, BRSA, to empower and manage SDIF in rehabilating failing banks after the twin financial crises. There were 25 banks transferred to the SDIF. Most of them are consolidated under some banks which are also under the control of SDIF in
order to manage easily. On the other hand, four of them were sold directly, other four of them went to bankruptcy while one of them was transferred to a public bank. Under new regulatory structure, SDIF has been done its functions in a quick manner. The collections from the resolution of the SDIF banks amounted to 18 billion USD as end of 2008, of which 90% was collected by the end of 2004.
3.3
Restructuring Program and Branching
Strategies
Turkish banking sector faced major transformations after twin crises in 2001 and 2002. Since we examined the post-crises period, these major changes in banking sector would be provided more extensively. Hence, in this section, we, first, explained the “Banking Sector Restructuring Program14” and then
described the branching strategies of Turkish deposit banks.
3.3.1
Banking Sector Restructuring Program
Following serious two crises experienced in 2000 and 2001, economic policies changed, and the implementation of the policies were sent to the IMF as a letter of intention on 31st July, 2001. This letter of intention expressed the continuation of the economic reform program. The main goal of the program was to decrease the inflation rate to reach a more stable economic environment and to enable a sustainable growth rate. In order to achieve these goals; the banking sector was restructured. In May 2001, “Banking Sector Restructuring Program” was initiated to restructure public banks, to transfer the banks to SDIF of which distorts the stability in banking sector as soon as possible, to support some private banks which were affected deeply
14See www.bddk.org.tr/WebSitesi/turkce/Raporlar/DigerRaporlar/15279C8914BD.pdf
Figure 3.6: Ratio of Matured Receivables to Loans
from the crises in order to reach a healthier banking system and lastly, to strengthen the regulation and supervision framework in banking sector.
Jung (1986) emphasized that if real sector and financial sector are in a close relationship, a problem in one of these sector will spread to other sector as well. Similarly, the companies were not able to pay back the credits in Turkey because of the financial crises occurred in 2000 and 20001. More precisely, the ratio of matured receivables, the receivables that that have come due, to loans has increased sharply from around 5% in 2000 to 23% at the end of 2001 for deposit banks (Figure 3.6). In order to overcome this problem, two applications were introduced in 2003 and 2007 named as “˙Istanbul Approach” and “Anatolian Approach” respectively.15
As mentioned above, the government removed the fragmented structure in banking regulation and supervision, and established an independent body
15These applications were allowing companies to restructure their loan debts and
ob-taining new funding if necessary by the help of the Law 4743. One of them was called ˙Istanbul Approach and was applied between 2002 and 2005. By this application, restruc-tured loan amount was USD 5,960 million which was corresponding to 16% of total loan in the banking system as end of 2002. Anatolian Approach was implemented in 2007 likely ˙Istanbul Approach. However, by this approach, insolvent small and medium sized enter-prises were targeted to be regained to the real sector. Its idea was also restructuring debts these enterprises to financial sector as well.
which will be the sole authority in banking sector in 2000. Initially, The Un-dersecretariat of Treasury was responsible for issuing banking regulations and Central Bank of Turkey was responsible for off-site supervision and was man-aging SDIF. Banking Regulation and Supervision Agency was established in May 1999 and began to operate in August 2000, which has been the sole au-thority in Turkish banking sector since then. By this way, regulation process has been more transparent and the supervision system has been strengthened. After 2000-2001 crises and especially restructuring of public banks, num-ber of branches and staff had been reduced significantly (BDDK, 2009). Around 27% of the personnel retired as of September 2003. Moreover, al-most 33% of the branches of public banks was closed. Around 50% of their personnel transferred to other public institutions. The program also sug-gested privatization of these banks. However, in the meantime, a special regulation was published on November 22nd of 2000 to change the status of the public banks as corporations. In Turkey, public banks are used to be operating under different legal structure than private banks. This regulation turned public banks to be operating as commercial banks in a more compet-itive market and subject to same Banking Act. Despite none of the public banks has been privatized since 2000, a merger occurred within these public banks. All assets and liabilities of Emlak Bank transferred to Ziraat Bankası on July 2001. After the merger, 96 branches of Emlak Bank transferred from Ziraat Bankası to Halk Bankası within the same year.
The duty losses of public banks16amounted 17.5 billion TL as of December
2001 was liquidated. Due to these losses including interest accruals, the Treasury compelled to issue Special Issue Government Bonds amounting 22.9
16The first time a duty loss occurred, it was recorded as a claim on the asset side of the
state banks’ balance sheet. Interest accruing on that stock was shown as interest income in the banks’ profit and loss statement, even when no cash income was received from the Treasury. Treasury compensated for the flow of duty losses fully within the year through budgetary appropriations, and second, that it issued non-cash securities in exchange for the stock of accumulated duty losses. This operation increased the net stock of domestic debt. And this led Treasury to borrow more from the financial markets, and concluded crowding out effect for the loan lending mechanism in the banking sector.
billion TL. Moreover, capital support amounting of 3.5 billion USD were provided to strengthen the capital structure of the public banks.
As another effort to restructure commercial deposit banks, reporting stan-dards changed to inflation accounting.17 Thus the balance sheets of the banks have become more transparent with the help of inflation accounting.
By the “Banking Sector Restructuring Program,” fiscal discipline and re-quired legal framework were achieved. As stated by Rodrik (2009), “...Mon-etary policy is governed by an inflation targeting framework and an indepen-dent central bank. Fiscal policy has been generally restrained and the public debt-to-GDP ratio stable or declining. Banks have strong balance sheets, and regulation and supervision are much tighter than before.” As mentioned before, banks in Turkey were mainly focused on the government debt instru-ments in the pre-crises period. However, in the post-crises period banks are not concerned with the profits gained by the government debt instruments as much as pre-crises period, they concentrated more on customer needs and main banking activities. These significant changes contributed to stable and high growth and decreasing real interest rate in Turkey. As it can be seen from Table 3.3, Turkish banking sector increased its intermediary role in the deposit and credit markets. According to the reports of TBA, total assets of the banking sector, in nominal values increased from 250 billion TL (179 bil-lion USD) in 2003 to 733 bilbil-lion TL (464 bilbil-lion USD) in 2008. Total amount of loan provisions were also increased during the same period. Despite a slight decline during global financial crises, the amount of total loans reached from 49 billion TL (50 billion USD) to 367 billion TL (241 billion USD) as of 2008.
17Inflation accounting is a kind of accounting which shows the effects of price changes on
the companys’ assets and liabilities that were valued by the past costs. It was taken into account in 1975 for the first time and stood in international accounting standards which made by International Accounting Standards Committee. Whatever the reason of rising on the private and general price level, it was a non-related factor for the company. Rising of general price level which was not related to company would effect the financial statements of the company badly. The company might have paid more tax than it had to be because of higher inflation. In Turkey, inflation accounting application was started implementing just after 2003. And this application was terminated by BRSA for the banking sector at the beginning of 2005.
Total amount of deposits collected were also increased steadily between these periods. It increased approximately from 161 billion TL (115 billion USD) to 455 billion TL (298 billion USD). Loans to deposits ratio increased from 0.30 to 0.81 suggesting that banks have been using more of their deposits as credits. Overall, we can argue that intermediation performance of the banks increased remarkably after 2000-2001 financial crises in Turkey.
3.3.2
Non-Pricing
Characteristics
and
Branching
Strategies
Since 2000, banks operating in Turkey have faced with more competition (see also Table 3.2) and changed their pricing and non-pricing strategies on their main banking activities. In particular, increasing competition has compelled banks to offer similar prices for their loan sales and their deposit purchases. Their efforts to gain competitive edge shifted to the non-pricing efforts. Some of these efforts are brought new products to be introduced in the market. For example; credit cards which have different attributes relative to competitors’ credit cards, internet banking activities with almost zero cost to customers, wider branch and ATM networks and concepts.18 In several ways, banks have been concentrated more on their non-pricing decisions. In the banking practice, a good network of branches is considered as a major non-pricing competitive tool to reach more depositors and borrowers. However, cost of having wider branch network is considerably high. For example, Nath et al. (2001) showed that in US banking market, the average transaction cost at a full-service bank reduced from 1.07 USD to 0.27 USD at an
ATM, and fell to about a penny if the transaction was made on the web. Similar to many countries, ATM and internet banking tools have been used intensively as the means to collect deposits and provide loans in Turkish
18For example, some banks have shopping mall branch concept in which they have late
T able 3.3: T urkish Banking Sector, 2003-2008 2003 2004 2005 2006 2007 2008 T otal Assets (Million TL) 249,688 306,439 406,909 499,731 581,606 732,536 T otal Loans (Million TL) 64,572 97,197 154,504 219,784 286,427 368,014 T otal Dep osits (Million TL) 160,812 197,394 251,490 307,647 356,865 454,599 Num b er of Credit Cards 19,863,167 26,681,128 29,978,243 32,433,333 37,335,179 43,394,025 Num b er of A TMs 12,857 13,544 14,823 16,511 18,800 21,970 Num b er of POS 662,429 912,118 1,140,957 1,282,658 1,453,877 1,632,639 Num b er of Branc hes 5,966 6,106 6,247 6,849 7,618 8,790 Num b er of Banks 50 48 47 46 46 45 Source: In terbank Card Cen ter and The Banks Asso ciation of T urk ey . POS stands for p oin t of sale.
banking sector. Moreover, cellular phones have started to be used as newer tool of lending. Banks advertise extensively that borrowers can apply for loan by just entering their ID numbers and sending a message to the banks. They commit to start the process immediately even in five minutes.
Number of banks in the sector has stabilized around 50 banks since crisis in 2000-2001 in Turkey. On the other hand, number of branches of the whole banking sector increased from 5,966 in 2003 to 8,790 in 2008 (Table 3.7). The number of ATMs19 increased almost 70% (12,857 to 21,970) during the
period of 2003 to 2008 (see Table 3.3 and Figure 3.7). Number of branches per bank increased by 64% while it was registered as 88% for ATM between 2003 and 2008. The number of credit cards as one of the loan allocating bank instrument was 19.9 million in 2003 and reached to 43.4 million in 2008. The trend in branching and availability of several innovative products can be considered as the indications of increasing competition in the market and the efforts of banks to reach more customers after the post-crises period (Figure 3.7). The aggressive competition in the credit card market is also worth to mention in Turkish banking sector. Banks have been trying to differantiate themselves by launching different attributed credit cards. For example, Akbank made a strategic partnership with Boyner Holding and they launched a credit card named as Fish Card. They differantiate this card by its most important specification which is giving so many gifts to its holders. On the other hand, Yapı ve Kredi Bank is the first bank in Turkish banking sector which offered credit cards to its customers in 1988. As of 2009, this credit card has been the best card for 18 years in terms of sales turnover in credit card market in Turkey. As mentioned before, banks have been involved in the internet banking intensively since late 1990s. Number of customers that used internet banking at least once reached to 13 million as 2009. Overall, in a competitive banking sector in Turkey, we observe that it became a mandate to use non-pricing tools and follow technological advancements intensively.19Number of ATMs are consists of banks which are subscribed to Interbank Card Center.
CHAPTER 4
THE MODEL
In this thesis, we estimated the effect of non-pricing behavior on the perfor-mance of the banking intermediation function. We used the loan amounts lent per GDP and the deposit amounts collected per GDP by banks as a proxy for the performance of the banking intermediation function. In order to ex-plore the effects of non-pricing decisions to the performance of the banks’ intermediary function we controlled for the impact of lending and deposit rates respectively. T-bill rate was also included in the model to control the impact of alternative uses of banking funds. We used number of branches as a non-price instrument. It was hypothesized that by increasing the number of branches a bank increases its loan per GDP. Similarly, by increasing the number of branches, a bank collects more deposits per GDP. Hence,
We specify our reduced form empirical models as;
log(Lit) = f [log(bit), log(rlit), log(r g
t)] (4.1)
and,
log(Dit) = f [log(bit), log(ritd), log(r g
t)] (4.2)
where i=1, 2, . . . , n denotes banks, and t denotes quarters.
The equilibrium amount of loan per GDP (Lit) is a function of number l
(rtg) (see appendix A for full description of the variables). Our hypotheses for the first model (equation 4.1) as follows:
Hypothesis 1: The loans per GDP for bank for bank i at time t would have
a positive relationship with the number of branches at time t. It is expected to have that ∂Lit/∂bit > 0.
Hypothesis 2: The loans per GDP for bank i at time t would have a
negative relationship with its loan rate at time t. It is expected to have that
∂Lit/∂ritl < 0.
Hypothesis 3: The loans per GDP for bank i at time t would have a
negative relationship with Treasury bill rate at time t. It is expected to have that ∂Lit/∂rtg < 0.
In the second model (equation 4.2), all the variables were the same ex-cept that price variables would be deposit rates. Accordingly, the amount of deposits collected per GDP was the independent variable. In this model specification, our hypotheses for this model are as follows:
Hypothesis 4: The deposits per GDP for bank i at time t would have a
positive relationship with the number of bank branches. It is expected to have that ∂Dit/∂bit > 0.
Hypothesis 5: The deposits per GDP for bank i at time t would have
a positive relationship with its deposit rate. It is expected to have that
∂Dit/∂ritd > 0.
Hypothesis 6: The deposits per GDP for bank i at time t would have a
negative relationship with the rate of the Treasury bill rate. It is expected to have that ∂Dit/∂rgt < 0.
In addition to sample of all deposit banks, we tested our hypothesis for large scaled versus small scaled banks and public versus private banks. Since we estimated our regression by panel generalized method of moments, suf-ficient numbers20 of instruments were used. These instruments were mainly
selected as the lagged values of the independent variable as in Arellona and Bond (1991) and the level values of the dependent variables in the regression equation. For all the estimation of the regression, we tested for the overiden-tifying restrictions of the instruments by Sargan test which were reported in the estimation results section.
CHAPTER 5
DATA AND METHODOLOGY
5.1
Data Set
In this thesis, we examined the performance of deposit banks between the periods of January 2003 and December 2008 with quarterly data. During this period, some of the operations such as mergers and/or acquisitions activities made the data to be unbalanced. For example, a merger realized between Ko¸cbank and Yapı ve Kredi Bank at the end of 2006. Moreover, Pamukbank was transferred to SDIF in 2002 by BRSA. The bank continued its operations until 2004 and transferred to a public bank, Halk Bank.
Since we aim to measure branch network effects on banks’ loan and deposit performance, we eliminated deposit banks that have very small network of branches. More precisely banks that had less than 10 branches on average for the period 2003 to 2008, were excluded from the data set21. In fact, these
banks are mostly the foreign banks that had only representative branches and were operating in Ankara or ˙Istanbul.
There were 32 commercial deposit banks by the end of 2008. Six of these banks are foreign banks as representative branches. They were excluded in our analyses. Moreover, four banks were also eliminated since they had less
21Similarly, Hirtle (2007) stated that, she excluded the banks with less than 10 branches
since she was primarily interested in the performance of banks operating significant branch networks. The same argument is valid for this study also.