The Effects of Ultrasound Parameters and Microbubble
Concentration on Acoustic Particle Palpation
This is a post-refereeing final draft. When citing, please refer to the published version: N. Saharkhiz, H. Koruk, J.J Choi, The Effects of Ultrasound Parameters and Microbubble Concentration on Acoustic Particle Palpation, The Journal of the Acoustical Society of America 144(2), 796-805, 2018. https://doi.org/10.1121/1.5050524
1 2
The Effects of Ultrasound Parameters and Microbubble Concentration on Acoustic Particle Palpation
Niloufar Saharkhiz,1 Hasan Koruk,2 and James J. Choi1,a)
1Department of Bioengineering, Imperial College London, Exhibition Road,
London SW7 2BP, United Kingdom
2Mechanical Engineering Department, MEF University, Ayazaga Caddesi, No.4,
The elasticity of tissue - an indicator of disease progression - can be imaged by ul-1
trasound elasticity imaging technologies. An acoustic particle palpation (APP) has 2
recently been developed - the use of ultrasonically-driven acoustic particles (e.g., mi-3
crobubbles) - as an alternative method of tissue deformation. APP has the potential 4
to improve the resolution, contrast, and depth of ultrasound elasticity imaging; but 5
the tissue displacement dynamics and its dependence on acoustic pressure, center 6
frequency, and microbubble concentration remains unknown. Here, we produced dis-7
placements of at least 1 µm by applying ultrasound onto a microbubble solution 8
(concentration: 10 × 106 microbubbles ml−1) placed within a tunnel surrounded by 9
a 5% gelatin phantom. Displacements of more than 10 µm were produced using a 1, 10
3.5, or 5 MHz center frequency pulse with peak-rarefactional pressures of 470, 785, 11
and 1,210 kPa, respectively. The deformation of the distal wall varied spatially and 12
temporally according to the different parameters investigated. At low pressures, the 13
deformation increased over several milliseconds until it was held at a nearly constant 14
value. At high pressures, a large deformation occurred within a millisecond followed 15
by a sharp decrease and long stabilization. Ultrasound exposure in the presence of 16
microbubbles produced tissue deformation (p < 0.05) while without microbubbles, 17
no deformation was observed. 18
I. INTRODUCTION
19
Changes to the elastic properties of tissue are strong indicators of disease progression. 20
In cancer (?), liver cirrhosis (?), and other diseases, tissue stiffens over time. Quantify-21
ing and imaging changes in elasticity are thus major goals in imaging modalities, such as 22
ultrasound and magnetic resonance imaging (MRI) (?). The general steps for measuring 23
elasticity noninvasively using acoustic radiation force (ARF) is to apply the force to the 24
tissue (i.e., palpation), monitor the resulting deformation, and derive the elasticity using 25
a model (???). In these techniques, ARF is applied by focusing ultrasound onto a region 26
of excitation (ROE) and is proportional to the intensity of ultrasound and the absorption 27
coefficient of the tissue (?). The deformation can be monitored by ultrasound or other 28
modalities, such as MRI and optical imaging. Despite the benefits of ARF-based elasticity 29
imaging, there are diseases, such as micro-metastatic cancers and distal regions of the liver, 30
which cannot be imaged due to poor imaging depth, contrast, or resolution (?). 31
Lipid-shelled and gas-filled microbubbles are routinely used in the clinic as ultrasound con-32
trast agents to improve the quality of ultrasound images (?). This contrast enhancement 33
takes advantage of a microbubble’s unique behavior in an acoustic field: nonlinear vol-34
umetric oscillations that enhance scattering. Ultrasound exposure of a microbubble also 35
generates a primary radiation force (or Bjerknes) force which is proportional to the spatial 36
derivative of the acoustic pressure and the bubble’s volume (?). Microbubbles undergoing 37
primary radiation force move in the direction of ultrasound propagation (?). Microbubbles 38
also experience a secondary radiation force, which is an attractive or repulsive force between 39
oscillating bubbles. This force becomes relevant as the distance between adjacent bubbles 40
is reduced (i.e., high concentrations) and as the pressure and pulse length increase (?). 41
Bubbles exposed to ultrasound have been previously used to measure the elasticity of vis-42
coelastic media (?). In one approach, large bubbles were formed by vaporization of a hydrogel 43
(gelatin) with a laser. This laser-generated bubble had a radii between 18 and 78 µm and 44
was used to measure the Young’s modulus of the material. In another study, the elastic 45
properties of materials was measured by exposing a large laser-generated bubble (diameter: 46
100-800 µm) to an acoustic field (?). Moreover, some experiments have been conducted to 47
characterize the time-dependent mechanical properties of microvessels by optically imaging 48
the tissue’s response to an ultrasonically-driven microbubble collapse (i.e., inertial cavita-49
tion) against vessel walls (?). 50
We recently explored the use of pre-formed microbubbles undergoing primary ARF - acous-51
tic particle palpation (APP) - as a stress source for elasticity imaging (?). In this technique, 52
microbubbles were administered into a vessel that modelled the bloodstream of tissue. The 53
application of ultrasound caused the microbubbles to move in the direction of wave propa-54
gation and push against the distal vessel wall, resulting in tissue deformation. It was shown 55
that a larger force was applied with APP than with ultrasound only ARF-based methods 56
(?). Microbubbles used in this manner are acting as contrast agents for elasticity imaging. 57
However, just as contrast agents for ultrasound imaging are not simply the enhancement of 58
tissue contrast - it is the blood supply that is enhanced - microbubbles in APP would not 59
enhance the tissue contrast directly. Microbubbles are contained within the vasculature and 60
thus the vessel wall would be assessed. Thus, APP-based imaging may be able to probe 61
large vessels such as arteries or veins. The Young’s modulus of arteries in human can range 62
from 0.3 to 5.5 MPa (?) with the mass density of 1050-1075 kg m−3 (?) and the speed of 63
sound of 1560-1660 m s−1 (?). These properties depend on the composition of the vascular 64
tissue such as collagen, elastin and smooth muscle cells (?) and will change with age and the 65
progression of vascular diseases (??). However, the vessel’s properties in APP-based imaging 66
may be far less relevant as the probed vessels approach the size of arterioles, venules and 67
capillaries. In such small vessels, their thickness approaches a single cell and in the case of 68
microvessels with very thin walls, the vessel takes on the elasticity of the surrounding tissue 69
microstructures (?). For soft tissue such as liver, the Young’s modulus, mass density and 70
speed of sound are 0.6 kPa (?), 1050 kg m−3 (?) and 1578 m s−1 (?) respectively. APP 71
techniques are not limited to just vessels and could potentially measure the elastic properties 72
of the other tissue types by injecting the particles into the cerebrospinal fluid, fluid bodies or 73
subcutaneously into the lymphatic system (?). Thus, there is a potential for measuring the 74
stiffness of tissue microenvironments. But to make this elasticity measurement technique 75
pragmatic, it must be safe and effective. One of the concerns with sonicated microbubbles 76
is that high magnitudes of inertial cavitation may damage the surrounding tissue environ-77
ment. This occurs when the rarefactional phase of an ultrasonic pulse is high enough to 78
cause the bubble to unstably expand to at least twice its initial radius (?), which leads to 79
a rapid collapse due to the inertia of the surrounding fluid. This phenomenon depends on 80
the frequency of ultrasound, peak rarefactional pressure and pulse length (?). As a result, 81
the acoustic parameters must be below a threshold to minimize the magnitude of inertial 82
cavitation. Although there is some debate about when in vivo bio-effects arise, studies 83
have suggested that the mechanical index (MI) should be kept below 0.4 when ultrasound 84
is applied in the presence of certain types of microbubbles (?). The MI is proportional to 85
the peak-rarefactional pressure and inversely proportional to the square root of the center 86
frequency. Since APP can be achieved with very low intensities (low acoustic pressures and 87
short duty cycles), we anticipate very low thermal index (TI) values. 88
The purpose of this study is to identify a range of ultrasound and microbubble conditions 89
that can generate APP to an extent that is relevant for elasticity imaging. Microbubbles 90
flowing through a wall-less channel in a 5% gelatin phantom was exposed to ultrasound to 91
cause deformation of the distal tissue wall. The Young’s modulus of 5% gelatin phantom is 92
approximately 1.5 kPa as determined in previous studies (??) and is similar to the elastic-93
ity of the brain in young rats (?) and liver in humans (?). The effects of different center 94
frequencies (1, 3.5, and 5 MHz), which are below, close and above the resonance frequency 95
of microbubbles, were investigated. A wide range of acoustic pressures were applied (peak 96
negative of 0.3 to 2 MPa) to observe how microbubbles behaved below, at, and above the MI 97
threshold for clinical safety. Experiments were also conducted with a range of microbubble 98
concentrations (4 × 10⁶, 10 × 106 and 20 × 106 microbubbles ml−1) to explore the possibility 99
of palpating tissue using low microbubble concentrations. 100
II. MATERIALS AND METHODS
101
A. Tissue Mimicking Material
102
Experiments were conducted with gelatin phantoms that mimicked the elastic and acous-103
tic properties of tissue (?). These phantoms had a speed of sound of approximately 1540 104
m s−1, a mass density of approximately 1 g cm−3 and a Young’s modulus of approximately 105
100− 102 kPa (?). To prepare each phantom, 10 g of gelatin powder (Fisher Scientific UK 106
Ltd, Loughborough, UK) was added to 200 ml of degassed and deionized water. The solution 107
was dissolved by heating (42◦C for 40 minutes), stirred continuously to create a homogenous 108
solution, and then degassed for 30 minutes under the vacuum strength of 720 mmHg in a 109
vacuum chamber. The mixture was poured into a phantom box which had two Mylar sheets 110
that allowed for ultrasound to enter and leave the box. An 800-µm-in-diameter carbon rod 111
(Hyperflight, UK) was inserted into the phantom. The box was then refrigerated overnight 112
(approximately 12 hours) so that the solution solidified. Each phantom was left at room 113
temperature (22 ◦C) for an hour prior to experiments. The rod was then removed before 114
sonication to provide a wall-less tunnel for water and microbubbles to flow through. 115
B. Microbubble Preparation
116
Lipid-shelled microbubbles were prepared according to a previously described method 117
(?). Dipalmitoylphosphatidylcholine (DPPC-82%), Dipalmitoylphosphatidic acid (DPPA-118
8%), and dipalmitolyphosphatidylethanolamine-PEG5000 (DPPE-PEG5000-10%) (Avanti 119
Polar Lipids Inc., AL, USA) were mixed and diluted with saline and glycerol. Each vial was 120
filled with perfluorobutane gas (FluoroMed L.P., Texas, USA) and placed in a mechanical 121
shaker (Synergy Electronics, Scottsdale, AZ, USA) for 45 seconds to activate the bubbles. 122
The size and population distribution of the bubbles were calculated by optical microscopy 123
followed by image processing using a previously described technique (?). The mean diameter 124
of the bubbles was 2.07 ± 1.28 µm with a range from 0.5 to 9.87 µm. The undiluted vial 125
concentration was 3.83 × 10⁹ microbubbles ml−1; approximately 2000 times the clinical 126
dose of 2.04 × 10⁶ microbubbles ml−1. This clinical dose was based on a 0.02 ml kg−1 127
recommendation while assuming a 5 L blood volume for a 70 kg individual (?). Diluted 128
microbubbles solutions were prepared by diluting the vial’s content with select amounts of 129
deionized, degassed water for each experiment. 130
C. Experimental Setup
131
The tissue-mimicking phantom was placed in a water tank using a 3-D manual positioning 132
system (Newport, Bloomfield, NY, USA). The tank’s water was degassed and deionized. A 133
high frame rate camera (frame rate: 1200 frames per second, field of view: 416 × 144 pixels, 134
model: Nikon 1 V3, Nikon Inc., USA) with an attached lens (Nikon VR 70-300 f/4.5-5.6) 135
was used to record the displacement of the channel (Fig. ??). Two magnifying glasses with 136
magnification factors of 10x were used to improve the resolution to 10 µm pixel−1. An 137
LED light source (KL 2500 LED, SCOTT, Stafford, UK) with gooseneck guides was used 138
for backlight illumination and to increase the contrast between the wall-less channel and the 139
background (Fig. ??). For all experiments, microbubbles flowed across the channel using 140
a syringe pump (70-3007, Harvard Apparatus, Cambridge, UK) and plastic tubes (R 3603, 141
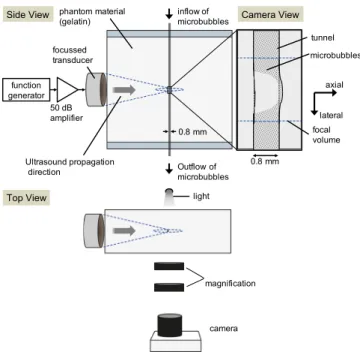
Side View function generator inflow of microbubbles tunnel microbubbles lateral axial focal volume focussed transducer phantom material (gelatin) 0.8 mm Camera View 50 dB amplifier 0.8 mm Top View camera light Outflow of microbubbles magnification Ultrasound propagation direction
FIG. 1. Experimental setup. A solution of microbubbles flowing through a 0.8 mm wall-less channel were sonicated by a focused ultrasound transducer. The channel was created in a 5% gelatin phantom which was immersed in a water tank. The transducer was driven by a function generator and 50 dB amplifier (side view). The sonicated bubbles applied a force to the channel’s wall and deformed it (Camera view). The deformation of the wall was recorded by a high frame rate camera. Two magnifying glasses were used to increase the resolution of the final image. To increase the contrast between the channel and the phantom material, the background was illuminated (top view).
Tygon) attached to the connectors on the phantom box. The flow rate was 700 µl min−1 142
and the velocity was 23 mm s−1. 143
Three different single element transducers (Power Series, Olympus Industrials, UK) of 1 MHz 144
(aperture diameter: 25.4 mm, f-number: 0.9, FWHM: 4.77 mm, focal length: 51.15 mm, 145
part number:18-0116-P), 3.5 MHz (aperture diameter: 19.05 mm, f-number: 3.3, FWHM: 146
1.71 mm, focal length: 52.02 mm, part number:17-0312-P) and 5 MHz (aperture diameter: 147
25.4 mm, f-number: 4.8, FWHM: 0.83 mm, focal length: 52.30 mm, part number:18-0516-P) 148
were used. Each transducer was calibrated in free field by a hydrophone (Precision Acoustics 149
Ltd., Dorchester, UK) in a separate set of experiments. In order to place the transducer’s 150
focal volume over the tube, we first imaged the rod that remained embedded in the phantom. 151
In an imaging configuration, the transducer was connected to a pulser/receiver (DPR300, 152
JSR Ultrasonics, Pittsford, NY, USA) and oscilloscope (DPO3014, Tektronix, Inc. OR, 153
USA) to position the transducer axially. The carbon rod was then gently removed from 154
the phantom. The lateral targeting was conducted by imaging an air bubble that filled the 155
channel after the rod was removed. In the APP configuration, the transducer was driven by 156
a waveform generator (33500B Series, Agilent Technologies, Santa Clara, CA, USA) and 50 157
dB power amplifier (Precision Acoustics Ltd, Dorchester, UK) to produce a specific range 158
of beam characteristics (Table ??). 159
After alignment of the transducer, the control experiment (without the presence of the 160
microbubbles) was conducted by establishing a flow of degassed, deionized water through 161
the channel. The channel was then filled with a flow of diluted microbubbles. The channel 162
was cleaned after each experiment by flowing an air bubble across the channel. In order 163
to evaluate whether residual microbubbles accumulated in the channel, a second control 164
experiment with water was conducted at the end of the experiments. No significant difference 165
in deformation was observed between the initial and final controls. For all experiments, 166
images were captured before, during and after ultrasound excitation (Fig. ??) 167
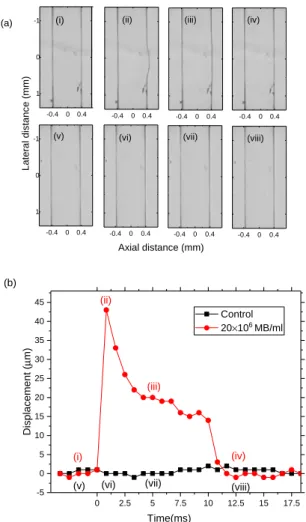
- 0 . 4 0 0 . 4 - 1 0 1 ( a ) - 0 . 4 0 0 . 4 ( i i ) - 0 . 4 0 0 . 4 ( i i i ) - 0 . 4 0 0 . 4 ( i v ) ( i ) - 0 . 4 0 0 . 4 - 1 0 1 - 0 . 4 0 0 . 4 L a te ra l d is ta n c e ( m m ) A x i a l d i s t a n c e ( m m ) - 0 . 4 0 0 . 4 ( v i i ) - 0 . 4 0 0 . 4 ( v ) ( v i ) ( v i i i ) 0 2 . 5 5 7 . 5 1 0 1 2 . 5 1 5 1 7 . 5 - 5 0 5 1 0 1 5 2 0 2 5 3 0 3 5 4 0 4 5 ( v ) ( v i ) ( v i i ) ( i ) ( i i ) ( i i i ) ( i v ) ( v i i i ) ( b ) C o n t r o l 2 0 ×1 06 M B / m l D is p la c e m e n t ( µ m ) T i m e ( m s )
FIG. 2. (a) The images acquired by the camera of the wall less channel pre, during and post excitation (center frequency: 5 MHz, peak-rarefactional pressure: 2210 kPa, pulse length: 10 ms) with the channel filled (i-iv) with the microbubbles and (v-vii) with water alone (Control). The images are captured (i), (v) before the excitation and (ii-iv), (vi-vii) at 0.83, 4.98 and 12.45 ms after the start of the excitation. MB: microbubbles. (b) Displacement over the length of the pulse for the corresponding images.
D. Deformation Analysis
168
In order to analyze the APP-induced deformation dynamics, we tracked and collected the 169
wall deformation using the pixels from the images captured by the camera and processed 170
with MATLAB (The Mathworks, Natick, MA, USA). Since wall deformation occurred in 171
the direction of wave propagation, we anticipated that the deformation would occur on and 172
orthogonal to the distal wall. Our first step was to automatically detect where the wall was 173
located within each image. This was achieved by tracking a 1-D line of pixels along the 174
axial axis. Once this was found, each image was interpolated by a factor of 10 along the 175
axial dimension. The overlap of the focal volume with the distal wall was detected and the 176
focal center of the ultrasound beam on the distal wall was determined which was assumed as 177
the middle of the previously detected overlapped area. An average of five adjacent pixels in 178
the focal center were considered in our deformation measurements. The displacement of the 179
focal center pixels in each frame was measured using 1-D cross-correlation. The position of 180
the focal center was averaged at five to ten frames before the excitation and was considered 181
as the reference for the cross-correlation algorithm. 182
E. Statistical Analysis
183
The mean and standard deviation values were calculated based on the deformation values 184
for five consecutive pulses. Statistical tests, one-way analysis of variance (ANOVA) followed 185
by post-hoc Bonferroni analysis, were performed to check the significance of the results. 186
The data sets for different microbubble solutions at each acoustic pressure for each of the 187
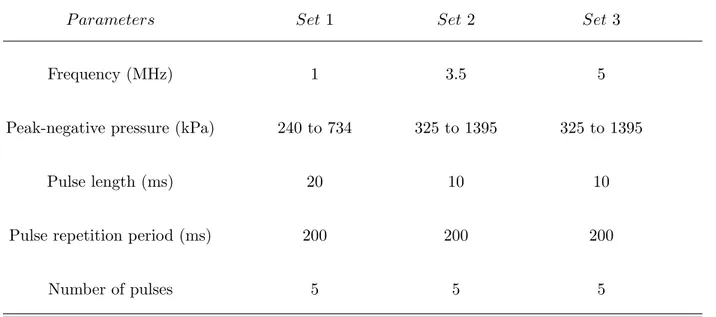
TABLE I. Ultrasound parameters
P arameters Set 1 Set 2 Set 3
Frequency (MHz) 1 3.5 5
Peak-negative pressure (kPa) 240 to 734 325 to 1395 325 to 1395
Pulse length (ms) 20 10 10
Pulse repetition period (ms) 200 200 200
Number of pulses 5 5 5
transducers were compared and a P value of 0.05 was considered to determine the significant 188
difference. Linear regression was also performed to compare the displacement amplitudes 189
for different solutions over all the applied acoustic pressures. 190
III. RESULTS
191
A. Deformation Dynamics
192
A uniform flow of microbubbles with a concentration of 20 × 106 microbubbles ml−1 was 193
established through the channel before the excitation ((Fig. ??(a).i), (Fig. ??(b).i)). The 5 194
MHz transducer was driven at a peak-rarefactional pressure of 2,210 kPa, which pushed the 195
microbubbles towards the distal wall of the channel and created a large wall displacement of 196
approximately 43 µm ((Fig. ??(a).ii), (Fig. ??(b).ii)). The displacement decreased rapidly 197
in the following frames ((Fig. ??(a).iii), (Fig. ??(b).iii)). Finally, the channel wall returned 198
to its initial position after the removal of ultrasound ((Fig. ??(a).iv), (Fig. ??(b).iv)). The 199
same experiment was conducted with the channel filled with water and without the presence 200
of the microbubbles. No deformation of the channel was observed in the control experiment 201
((Fig. ??(a).v-vii), (Fig. ??(b).v-vii)). 202
B. Acoustic Pressure
203
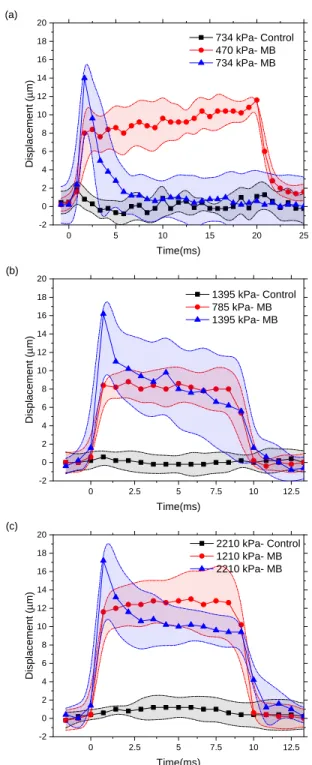
In order to evaluate the effect of different acoustic pressures on the APP, the 1 MHz 204
transducer was driven at different pressures (peak-rarefactional pressure from 240 to 734 205
kPa). As expected, higher acoustic pressure produced greater displacements. In one set of 206
experiments with a microbubble concentration of 10 × 106 microbubbles ml−1, it was ob-207
served that low pressure exposure (i.e. 470 kPa) produced a displacement of the wall that 208
was nearly constant during the entire pulse duration. Increasing the pressure above 520 209
kPa (i.e. 734 kPa) led to a displacement up to 14 ± 3.58 µm (0.83 ms after the start of 210
the excitation), which rapidly decreased in the following frames (Fig ??(a)). In the control 211
experiments at the highest pressure (i.e., 734 kPa), a very small net displacement of 1.86 µ 212
m was observed while no displacement was observed at lower pressures. 213
We evaluated similar experiments with the 3.5 MHz transducer (Fig. ??(b)). No displace-214
ment was observed in our control where the channel filled with water, was exposed to acoustic 215
pulses at 1,395 kPa. In the presence of microbubbles (concentration: 10 × 106 microbub-216
bles ml−1), ultrasound exposure at 785 and 1395 kPa produced a maximum displacement of 217
8.8 ± 1.58 µm and 16.2 ± 4.39 µm, respectively. The displacement pattern where an initial 218
peak displacement followed by a decrease in the following frames, was observed for acoustic 219
0 5 1 0 1 5 2 0 2 5 - 2 0 2 4 6 8 1 0 1 2 1 4 1 6 1 8 2 0 ( a ) 7 3 4 k P a - C o n t r o l 4 7 0 k P a - M B 7 3 4 k P a - M B D is p la c e m e n t ( µ m ) T i m e ( m s ) 0 2 . 5 5 7 . 5 1 0 1 2 . 5 - 2 0 2 4 6 8 1 0 1 2 1 4 1 6 1 8 2 0 ( b ) 1 3 9 5 k P a - C o n t r o l 7 8 5 k P a - M B 1 3 9 5 k P a - M B D is p la c e m e n t ( µ m ) T i m e ( m s ) 0 2 . 5 5 7 . 5 1 0 1 2 . 5 - 2 0 2 4 6 8 1 0 1 2 1 4 1 6 1 8 2 0 D is p la c e m e n t ( µ m ) T i m e ( m s ) 2 2 1 0 k P a - C o n t r o l 1 2 1 0 k P a - M B 2 2 1 0 k P a - M B ( c )
FIG. 3. Displacement over the length of the pulse. The deformation of the distal wall was tracked for different ultrasound exposure conditions (circles and triangles) with and (squares) without microbubbles. Displacements are shown as averages for five consecutive pulses using (a) 1 MHz, (b) 3.5 MHz, and (c) 5 MHz transducer. The microbubble (MB) concentration was 10 × 106
pressures above 930 kPa. 220
For the experiments using the 5 MHz transducer, no displacement was observed for the 221
control experiments. Using a solution of 10 × 106 microbubbles ml−1, higher pressures led to 222
higher displacement of the channel. For the relatively high pressures (above 1,210 kPa), the 223
same displacement pattern where an initial peak displacement was produced, was observed 224
(Fig. ??(c)). 225
We evaluated the effect of three different microbubble concentrations and a range of acoustic 226
pressures (Table ??) for each transducer. Since the results for only two different pressure 227
values were shown in Fig. ?? for each transducer, the effect of pressure on displacements 228
is not clearly depicted. The effect of acoustic pressure and microbubble concentration is 229
shown in Fig. ?? in Section 2C. For each microbubble concentration, the acoustic pressure 230
was increased and the maximum value of the displacement was measured and averaged for 231
5 consecutive pulses. Higher acoustic pressures produced greater displacements. 232
For each transducer, data sets for each pressure level were compared for all the microbub-233
ble concentrations with ANOVA followed by post-hoc Bonferroni analysis. For the 1 MHz 234
transducer, the results were significantly different between all microbubble concentrations 235
at pressure levels of 355-734 kPa except between 10 × 106 and 20 × 106 microbubbles ml−1 236
solutions. At acoustic pressures of 240 and 300 kPa, the displacements were different except 237
between the control and 4 × 10⁶ microbubbles ml−1 and between 10 × 106 and 20 × 106 238
microbubbles ml−1 solutions. For the 3.5 MHz transducer, the results were significantly 239
different between all the microbubble concentrations at pressure levels of 475, 615 and 1395 240
kPa except between 10 × 106 and 20 × 106 microbubbles ml−1 solutions. For the remaining 241
acoustic pressures, the results were different only between the control and the experiments 242
with microbubbles. Finally, for the 5 MHz transducer, the presence of microbubbles in 243
solutions yielded significantly different displacements compared to the control experiments. 244
At the pressure of 1510 kPa, all the results were found to be significantly different. The 245
resultant displacements from 4 × 10⁶ and 10 × 106 microbubbles ml−1 solutions were not 246
found to be significant at pressure levels of 1210, 1810 and 2110 kPa. For each transducer, 247
linear regression was performed on data sets at all pressure levels for each microbubble con-248
centration. All the results were significantly different except for the control experiment with 249
the 3.5 MHz transducer. In addition, slope of the linear fit was found to increase as the 250
microbubble concentration increased for each transducer. 251
C. Center Frequency
252
The effect of ultrasound center frequency on the outcome of APP was investigated by 253
keeping the microbubble concentration constant (4 × 10⁶ microbubbles ml−1) and adjusting 254
the acoustic pressure (Fig. ??(a)). Since each transducer produced a different range of 255
acoustic pressures, the displacement values were calculated as a function of MI. The experi-256
ments were repeated using microbubble concentration of 10 × 106 (Fig. ??(b)) and 20 × 106 257
microbubbles ml−1 (Fig. ??(c)). For low MI values (below 0.6), no significant difference 258
was observed between the displacement values generated by the transducers for a given MI. 259
We summarized the averaged deformation values of each excitation for all the pressures, 260
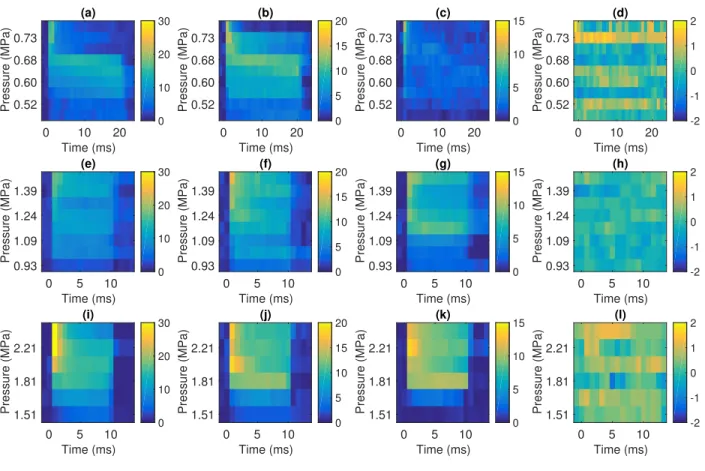
center frequencies, microbubble concentrations and control experiments in Fig. ??. Defor-261
mation of the wall was almost constant during excitations with moderate pressures (below 262
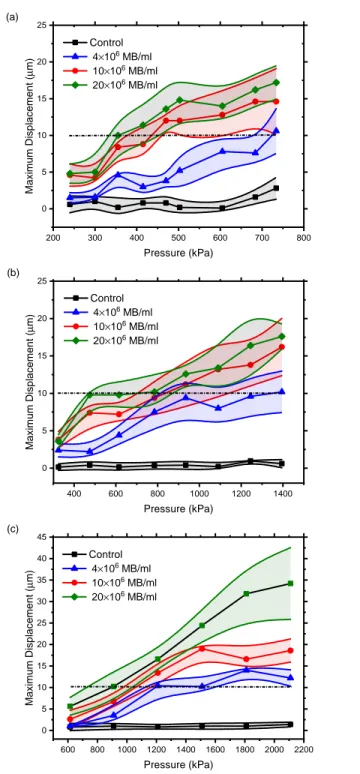
2 0 0 3 0 0 4 0 0 5 0 0 6 0 0 7 0 0 8 0 0 0 5 1 0 1 5 2 0 2 5 C o n t r o l 4 ×1 06 M B / m l 1 0 ×1 0 6 M B / m l 2 0 ×1 0 6 M B / m l ( a ) M a x im u m D is p la c e m e n t ( µ m ) P r e s s u r e ( k P a ) 4 0 0 6 0 0 8 0 0 1 0 0 0 1 2 0 0 1 4 0 0 0 5 1 0 1 5 2 0 2 5 C o n t r o l 4 ×1 0 6 M B / m l 1 0×1 0 6 M B / m l 2 0×1 0 6 M B / m l M a x im u m D is p la c e m e n t ( µ m ) P r e s s u r e ( k P a ) F r e q u e n c y = 3 . 5 M H z ( b ) 6 0 0 8 0 0 1 0 0 0 1 2 0 0 1 4 0 0 1 6 0 0 1 8 0 0 2 0 0 0 2 2 0 0 0 5 1 0 1 5 2 0 2 5 3 0 3 5 4 0 4 5 C o n t r o l 4×1 06 M B / m l 1 0×1 06 M B / m l 2 0×1 06 M B / m l ( c ) M a x im u m D is p la c e m e n t ( µ m ) P r e s s u r e ( k P a )
FIG. 4. Maximum displacement over acoustic pressure. The maximum displacement of the wall in each excitation is calculated and then averaged for five consecutive pulses. Values are reported for the experiments (diamonds, circles and triangles) with and (squares) without microbubbles. (a) 1 MHz transducer, (b) 3.5 MHz transducer, (c) 5 MHz transducer. MB: microbubble, Control: without microbubbles. The displacement threshold of 10 µm is shown by the dashed lines.
520 kPa for 1 MHz, 930 kPa for 3.5 MHz, and 1,210 kPa for 5 MHz transducer). However, 263
at higher pressures, the maximum displacement occurred within a few milliseconds and was 264
followed by lower displacements thereafter. Additionally, it was observed that the deforma-265
tion values did not increase linearly with microbubble concentration or acoustic pressure. 266
267
IV. DISCUSSION
268
We evaluated a range of ultrasound center frequencies, acoustic pressures, and microbub-269
ble concentrations that can produce elasticity imaging-relevant deformations using APP. 270
A minimum axial resolution in the orders of tens of microns is required for correlation 271
based tracking techniques according to Cramer-Rao lower band (??). The displacement of 272
about 10 µm was observed using 20 × 106 microbubbles ml−1 by applying acoustic pressures 273
of 350, 470 and 910 kPa for 1, 3.5 and 5 MHz transducers respectively. Thus APP re-274
quires lower acoustic pressures to displace tissue when compared to conventional ultrasound 275
only ARF-based methods (?). The magnitude of displacement can be increased by using 276
higher acoustic pressures and microbubble concentrations, which may be necessary for stiffer 277
materials. For soft materials, small detectable displacements are enough for elasticity mea-278
surement purposes because the correlation between the pre- and post-compression signals 279
tracked by ultrasound, is reduced for large strains as a result of large displacements. 280
The displacement was not constant during a single pulse (Fig. ?? and Fig. ??). At low 281
pressures, the displacement increased slowly. However, at high acoustic pressures, a high 282
displacement was produced in the beginning of the pulse and was followed by a quick de-283
0 . 2 0 . 4 0 . 6 0 . 8 1 . 0 0 2 4 6 8 1 0 1 2 1 4 1 6 1 M H z 3 . 5 M H z 5 M H z ( a ) M a x im u m D is p la c e m e n t ( µ m ) M I 0 . 2 0 . 4 0 . 6 0 . 8 1 . 0 0 5 1 0 1 5 2 0 2 5 1 M H z 3 . 5 M H z 5 M H z ( b ) M a x im u m D is p la c e m e n t ( µ m ) M I 0 . 2 0 . 4 0 . 6 0 . 8 1 . 0 0 5 1 0 1 5 2 0 2 5 3 0 3 5 4 0 4 5 1 M H z 3 . 5 M H z 5 M H z ( c ) M a x im u m D is p la c e m e n t ( µ m ) M I
FIG. 5. Maximum displacement over mechanical index (MI). The maximum displacement value in each pulse is averaged for five consecutive pulses. The values are shown for different ultrasound exposure conditions which are center frequencies (squares: 5 MHz, circles: 3.5 MHz and triangles: 1 MHz) and acoustic pressures. The reported displacement values were obtained using microbubble concentrations of (a) 4 × 10⁶ microbubbles ml−1, (b) 10 × 106 microbubbles ml−1 (c) 20 × 106
crease that stabilized over time. This behavior became more dramatic at higher acoustic 284
pressures and microbubble concentrations. We believe that the sudden decrease of the 285
displacement during an excitation was due to microbubbles being pushed away from the 286
ROE or destroyed within a few microseconds or milliseconds. Previous studies have shown 287
that high acoustic pressures can destroy microbubbles or divide them into smaller particles 288
(?). The lower displacement values in the following frames of each pulse could be a result 289
of a subpopulation of microbubbles that have not been destroyed. It should be noted that 290
the microbubble solution was infused into the tunnel at a velocity of 23 mm s−1, which is 291
similar to the blood flow velocity in small arterioles (??). The pulse repetition frequency 292
was 200 ms to ensure that unsonicated bubbles replenished the tunnel between consecutive 293
pulses and to establish a constant microbubble concentration for all experiments. However, 294
since the blood velocity depends on the size of the vessel, the effect of flow rate will be 295
considered in future studies. 296
The amplitude of the deformations could be higher than what was measured in the ex-297
periments. The temporal resolution of the camera was limited to 0.83 milliseconds, so the 298
maximum displacement, which could have occurred between frames, may not have been 299
captured. A camera with a higher time resolution is suggested for future work. 300
For the three center frequencies tested (1, 3.5 and 5 MHz) and with a microbubble con-301
centration of less than 20 × 106 microbubbles −1, a displacement of about 10 microns was 302
obtained with mechanical indices lower than 0.4, which is defined as a potential damage 303
threshold (?). Since the three center frequencies tested generated almost the same amount 304
of displacements for a given MI (Fig. ??), different depths of diagnosis can be measured 305
by the careful selection of center frequencies. For example, using a low center frequency 306
transducer could enable a high depth of elasticity imaging. Although only three center 307
frequencies were tested in this study, other frequencies may be usable. Additionally, it was 308
not possible to determine the optimal center frequency to use, because of the polydispersed 309
size distribution of the microbubbles. The use of more uniformly sized microbubbles could 310
improve the APP-induced deformation magnitude. Future work will include designing mi-311
crobubbles based on their size and persistence for APP imaging. 312
Different microbubble concentrations were used to palpate the phantom. In general, higher 313
microbubble concentrations produced greater displacements. However, this rise in displace-314
ment with microbubble concentration was not linear. This nonlinear relationship may be 315
due to the translational displacement of bubbles changing as the pushed microbubbles be-316
come increasingly dense. In other words, as the microbubbles are displaced towards the 317
distal wall, the separation distance between bubbles reduces (?) and secondary radiation 318
forces become greater. Therefore, the force generated by a population of the microbubbles 319
may not equal to sum of the force applied by individual ones. 320
It was observed that maximum displacement changed sublinearly with MB concentration. 321
As an illustration, maximum displacement values of 0.2, 5.2, 12.8 and 14.8 µm were esti-322
mated using no MB (Control), 4 × 10⁶, 10 × 106 and 20 × 106 microbubbles ml−1 respectively 323
by applying an acoustic pressure of 503 kPa with the 1 MHz transducer (Fig. ??(a)). . 324
Results also showed that maximum displacement changes sublinearly with applied pressure. 325
For instance, maximum displacement values of 4.2, 8.4, 12 and 14.5 µm were obtained by 326
applying 300, 355, 470 and 734 kPa respectively, using a 1 MHz transducer and 10 × 106 327
microbubbles ml−1(Fig. ??(a)). A mathematical model has been recently proposed to 328
investigate bubble displacement and tissue deformation as a result of a primary Bjerknes 329
force on a fluid-tissue interface (?). In the same study, material stiffness dependencies were 330
explored. A similar approach will be considered in a future study to examine the momentum 331
transfer and particle displacement in the presence of the wall for different wall diameter and 332
thickness, as well as for phantoms with different stiffnesses. 333
334
V. CONCLUSION
335
The dependence of APP-induced displacements on acoustic parameters and microbubble 336
concentrations was investigated in this study. Ultrasound-driven microbubbles were shown 337
to apply a force onto a region using lower acoustic pressures than is needed with only ul-338
trasound (control experiment). Deformations at low acoustic pressures and microbubble 339
concentrations were on the order of microns, which is sufficient for elasticity measurements. 340
APP produced elasticity imaging-relevant displacements for different ultrasound center fre-341
quencies and was nearly linear with the mechanical index. Since multiple center frequencies 342
could generate enough displacements, elasticity imaging at different diagnosis depths may 343
be possible. APP produced a unique deformation dynamic that varied spatially and tem-344
porally since microbubbles moved or were destroyed. The deformation curves varied with 345
acoustic pressure, but was broadly classified into two dynamics: slow rise to a steady state 346
deformation, and rapid high deformation followed by a low steady state deformation. In 347
(i) 0 5 10 Time (ms) 2.21 1.81 1.51 Pressure (MPa) 0 10 20 30 (j) 0 5 10 Time (ms) 2.21 1.81 1.51 Pressure (MPa) 0 5 10 15 20 (k) 0 5 10 Time (ms) 2.21 1.81 1.51 Pressure (MPa) 0 5 10 15 (l) 0 5 10 Time (ms) 2.21 1.81 1.51 Pressure (MPa) -2 -1 0 1 2 (e) 0 5 10 Time (ms) 1.39 1.24 1.09 0.93 Pressure (MPa) 0 10 20 30 (f) 0 5 10 Time (ms) 1.39 1.24 1.09 0.93 Pressure (MPa) 0 5 10 15 20 (g) 0 5 10 Time (ms) 1.39 1.24 1.09 0.93 Pressure (MPa) 0 5 10 15 (h) 0 5 10 Time (ms) 1.39 1.24 1.09 0.93 Pressure (MPa) -2 -1 0 1 2 (a) 0 10 20 Time (ms) 0.73 0.68 0.60 0.52 Pressure (MPa) 0 10 20 30 (b) 0 10 20 Time (ms) 0.73 0.68 0.60 0.52 Pressure (MPa) 0 5 10 15 20 (c) 0 10 20 Time (ms) 0.73 0.68 0.60 0.52 Pressure (MPa) 0 5 10 15 (d) 0 10 20 Time (ms) 0.73 0.68 0.60 0.52 Pressure (MPa) -2 -1 0 1 2
FIG. 6. Mean values of deformations for different acoustic pressures and microbubble concentra-tions during an excitation for each transducer. (a) 1 MHz transducer, 20 × 106 microbubbles ml−1.
(b) 1 MHz transducer, 10 × 106 microbubbles ml−1. (c) 1 MHz transducer, 4 × 10⁶ microbubbles
ml−1. (d) 1 MHz transducer, Control. (e) 3.5 MHz transducer, 20 × 106 microbubbles ml−1. (f)
3.5 MHz transducer, 10 × 106 microbubbles ml−1. (g) 3.5 MHz transducer, 4 × 10⁶ microbubbles
ml−1. (h) 3.5 MHz transducer, Control. (i) 5 MHz transducer, 20 × 106 microbubbles ml−1. (j) 5
MHz transducer, 10 × 106 microbubbles ml−1. (k) 5 MHz transducer, 4 × 10⁶ microbubbles ml−1.
conclusion, APP can produce tissue elasticity imaging relevant deformations using a wide 348
range of acoustic parameters and microbubble concentrations. 349
ACKNOWLEDGMENTS
350
This work was supported in part by the Wellcome Trust Institutional Strategic Support 351
Fund to Imperial College London. 352
1She is now with the Department of Biomedical Engineering, Columbia University, New York, NY 10027, 353
USA
354
2Also at: Department of Bioengineering, Imperial College London, London SW7 2BP, United Kingdom 355
356
Apfel, R. E. (1997). “Sonic effervescence: A tutorial on acoustic cavitation,” The Journal 357
of the Acoustical Society of America 101(3), 1227-1237. 358
Bouchard, R. R., Dahl, J. J., Hsu, S. J., Palmeri, M. L., and Trahey, G. E. (2009). “Im-359
age quality, tissue heating, and frame rate trade-offs in acoustic radiation force impulse 360
imaging,” IEEE Trans Ultrason Ferroelectr Freq Control 56(1), 63–76. 361
Chen, C., Robinson, D., Wilson, L., Griffiths, K., Manoharan, A., and Doust, B. (1987). 362
“Clinical sound speed measurement in liver and spleen in vivo,” Ultrasonic Imaging 9(4), 363
221 – 235. 364
Chen, E., Novakofski, J., Jenkins, W., and O’Brien, W. (1996). “Young’s modulus mea-365
surements of soft tissues with application to elasticity imaging,” IEEE Transactions on 366
Ultrasonics, Ferroelectrics and Frequency Control 43(1), 191–194. 367
Chen, H., Brayman, A. A., and Matula, T. J. (2012). “Characteristic microvessel relaxation 368
timescales associated with ultrasound-activated microbubbles.,” Applied physics letters 369
101(16), 163704. 370
Culjat, M. O., Goldenberg, D., Tewari, P., and Singh, R. S. (2010). “A review of tissue 371
substitutes for ultrasound imaging.,” Ultrasound in medicine & biology 36(6), 861–873. 372
Dalecki, D. (2007). “WFUMB Safety Symposium on Echo-Contrast Agents: bioeffects of 373
ultrasound contrast agents in vivo.,” Ultrasound in medicine & biology 33(2), 205–213. 374
Dayton, P., Morgan, K., Klibanov, A., Brandenburger, G., Nightingale, K., and Ferrara, 375
K. (1997). “A preliminary evaluation of the effects of primary and secondary radiation 376
forces on acoustic contrast agents,” IEEE Transactions on Ultrasonics, Ferroelectrics and 377
Frequency Control 44(6), 1264–1277. 378
Dayton, P. A., Allen, J. S., and Ferrara, K. W. (2002). “The magnitude of radiation force 379
on ultrasound contrast agents,” The Journal of the Acoustical Society of America 112(5), 380
2183–2192. 381
Doherty, J. R., Trahey, G. E., Nightingale, K. R., and Palmeri, M. L. (2013). “Acoustic radi-382
ation force elasticity imaging in diagnostic ultrasound.,” IEEE transactions on ultrasonics, 383
ferroelectrics, and frequency control 60(4), 685–701. 384
Duck, F. A. (1990). Physical Properties Of Tissue: A Comprehensive Reference Book (Aca-385
demic Press), pp. 73–165. 386
Erpelding, T., Hollman, K., and O’Donnell, M. (2005). “Bubble-based acoustic radiation 387
force elasticity imaging,” IEEE Transactions on Ultrasonics, Ferroelectrics and Frequency 388
Control 52(6), 971–979. 389
Fung, Y. C. (1993). Mechanical Properties and Active Remodeling of Blood Vessels (Springer 390
New York), pp. 321–391. 391
Fung, Y. C., Zweifach, B. W., and Intaglietta, M. (1966). “Elastic environment of the 392
capillary bed.,” Circulation research 19(2), 441–461. 393
Gefen, A., Gefen, N., Zhu, Q., Raghupathi, R., and Margulies, S. S. (2003). “Age-dependent 394
changes in material properties of the brain and braincase of the rat,” Journal of Neuro-395
trauma 20(11), 1163–1177. 396
Guyton, A. C., and Hall, John E. (John Edward), . (1996). Textbook of medical physiology, 397
9th ed ed. (Philadelphia, PA: Saun- ders), pp. 218–220. 398
Hall, T., Bilgen, M., Insana, M., and Krouskop, T. (1997). “Phantom materials for elas-399
tography,” IEEE Transactions on Ultrasonics, Ferroelectrics and Frequency Control 44(6), 400
1355–1365. 401
Hoskins, P. R. (2007). “Physical properties of tissues relevant to arterial ultrasound imaging 402
and blood velocity measurement,” Ultrasound in Medicine and Biology 33(10), 1527 – 403
1539. 404
Klabunde, R. E. (2005). Cardiovascular physiology concepts (Philadelphia, PA: Saunders), 405
pp. 91–93. 406
Koruk, H., and Choi, J. J. (2018). “Displacement of a bubble by acoustic radiation force 407
into a fluid-tissue interface,” The Journal of the Acoustical Society of America 143(4), 408
2535–2540. 409
Koruk, H., El Ghamrawy, A., Pouliopoulos, A. N., and Choi, J. J. (2015). “Acoustic particle 410
palpation for measuring tissue elasticity,” Applied Physics Letters 107(22), 223701. 411
Krouskop, T. A., Wheeler, T. M., Kallel, F., Garra, B. S., and Hall, T. (1998). “Elastic 412
moduli of breast and prostate tissues under compression,” Ultrasonic Imaging 20(4), 260– 413
274. 414
Leighton, T. G., Walton, A. J., and Pickworth, M. J. W. (1990). “Primary bjerknes forces,” 415
European Journal of Physics 11(1), 47-50. 416
Lindner, J. R. (2004). “Microbubbles in medical imaging: current applications and future 417
directions,” Nat Rev Drug Discov 3(6), 527–532. 418
McDonald, D. A. (1974). Blood flow in arteries (Williams & Wilkins, Baltimore, MD), 419
1–496. 420
Neppiras, E. (1980). “Acoustic cavitation,” Physics Reports 61(3), 159–251. 421
Nightingale, K. (2011). “Acoustic Radiation Force Impulse (ARFI) Imaging: a Review.,” 422
Current medical imaging reviews 7(4), 328–339. 423
Nightingale, K. R., Palmeri, M. L., Nightingale, R. W., and Trahey, G. E. (2001). “On 424
the feasibility of remote palpation using acoustic radiation force,” The Journal of the 425
Acoustical Society of America 110(1), 625–634. 426
Ophir, J., Cspedes, I., Ponnekanti, H., Yazdi, Y., and Li, X. (1991). “Elastography: A 427
quantitative method for imaging the elasticity of biological tissues,” Ultrasonic Imaging 428
13(2), 111 – 134. 429
Parker, K. J., Doyley, M. M., and Rubens, D. J. (2011). “Imaging the elastic properties of 430
tissue: the 20 year perspective,” Phys Med Biol 56(1), R1–R29. 431
Pouliopoulos, A. N., Bonaccorsi, S., and Choi, J. J. (2014). “Exploiting flow to control the 432
in vitro spatiotemporal distribution of microbubble-seeded acoustic cavitation activity in 433
ultrasound therapy.,” Physics in medicine and biology 59(22), 6941–6957. 434
Rooney, J. A., Gammell, P. M., Hestenes, J. D., Chin, H. P., and Blankenhorn, D. H. (1982). 435
“Velocity and attenuation of sound in arterial tissues,” The Journal of the Acoustical 436
Society of America 71(2), 462–466. 437
Sennoga, C. A., Mahue, V., Loughran, J., Casey, J., Seddon, J. M., Tang, M., and Ecker-438
sley, R. J. (2010). “On sizing and counting of microbubbles using optical microscopy.,” 439
Ultrasound in medicine & biology 36(12), 2093–2096. 440
Shi, W. T., Forsberg, F., Tornes, A., Østensen, J., and Goldberg, B. B. (2000). “Destruc-441
tion of contrast microbubbles and the association with inertial cavitation,” Ultrasound in 442
Medicine & Biology 26(6), 1009–1019. 443
Unger, E. C., Porter, T., Culp, W., Labell, R., Matsunaga, T., and Zutshi, R. (2004). 444
“Therapeutic applications of lipid-coated microbubbles.,” Advanced drug delivery reviews 445
56(9), 1291–314. 446
Varghese, T. (2009). “Quasi-Static Ultrasound Elastography.,” Ultrasound clinics 4(3), 323– 447
338. 448
Walker, W., and Trahey, G. (1995). “A fundamental limit on delay estimation using par-449
tially correlated speckle signals,” IEEE Transactions on Ultrasonics, Ferroelectrics and 450
Frequency Control 42(2), 301–308. 451
Woodard, H. Q., and White, D. R. (1986). “The composition of body tissues,” The British 452
Journal of Radiology 59(708), 1209–1218. 453
Yoon, S., Aglyamov, S. R., Karpiouk, A. B., Kim, S., and Emelianov, S. Y. (2011). “Estima-454
tion of mechanical properties of a viscoelastic medium using a laser-induced microbubble 455
interrogated by an acoustic radiation force.,” The Journal of the Acoustical Society of 456
America 130(4), 2241–2248. 457
Zhang, X., Qiang, B., and Greenleaf, J. (2011). “Comparison of the surface wave method 458
and the indentation method for measuring the elasticity of gelatin phantoms of different 459
concentrations.,” Ultrasonics 51(2), 157–164. 460