STATISTICALLY GUIDED ARTIFICIAL BEE COLONY ALGORITHM
1Barış KOÇER
1Selcuk University, Department of Computer Engineering, Campus, Selcuklu, Konya, TURKEY 1[email protected]
(Geliş/Received: 09.01.2017; Kabul/Accepted in Revised Form: 25.02.2017)
ABSTRACT: Artificial Bee Colony algorithm is one of the naturally inspired meta heuristic method. As usual, in a meta heuristic method, intuitively appealing way to have better results is extending calculation time or increasing the fitness evaluation count. But the desired way is acquiring better results with less computation. So in this work a modified Artificial Bee Colony algorithm which can find better results with same computation is developed by benefiting statistical observations.
Key Words: Swarm intelligence, Meta heuristic algorithms, Artificial bee colony algorithm.
İstatistiksel Olarak Yönlendirilen Yapay Arı Kolonisi Algoritması
ÖZ: Yapay Arı Koloni algoritması, doğadan ilham alan meta sezgisel yöntemlerinden biridir. Meta sezgisel yöntemle, daha iyi sonuçlar elde etmek için akla ilk gelen çözüm hesaplama süresini arttırmak veya uygunluk hesaplama sayısını arttırmaktır. Ancak istenilen yol, daha az hesaplama ile daha iyi sonuçlar elde etmektir. Bu çalışmada, istatistiksel gözlemlerden yararlanarak, aynı uygunluk hesaplama sayısı ile daha iyi sonuçlar bulunabilen Yapay Arı Koloni Algoritması, geliştirilmiştir.
Anahtar Kelimeler: Sürü zekası, Meta sezgisel algoritmalar, Yapay arı kolonisi algoritması.
INTRODUCTION
Genetic algorithms (GA) (Holland, 1975) had marked an era in the solution of NP hard problems. It is one of mostly used population based algorithm but in recent years, swarm intelligent is also used in population based algorithms and has attracted huge attention among the researchers. Swarm intelligence algorithms are inspired from collective behavior of animal groups like ant colonies, flocks of birds or bee swarms. This special type of the population based algorithms are referred as swarm intelligence. The secret of the success of the swarm intelligence is “self organization”. In a self organization, individuals in the population are specialized to fulfill a special task without under control of a centralized authority to accomplish a global task. Swarm intelligence mostly used to solve non linear functions with multi local optimum and combinational optimization tasks. Particle swarm optimization (PSO) which was introduced by (Kennedy and Eberhart, 1995) is another popular swarm intelligence based method. PSO have been inspired from collective behavior of bird or fish groups while moving together. Ant colony algorithm (ACO) (Dorigo et al., 1991) which simulates the behavior of ants to find best route to carry foods from source to home is another popular swarm intelligence method. Bee colonies are also good examples for swarm intelligence. In a bee colony there are specialized bee types for specialized task. For example, employee bees fly to food sources and dances in the hive according to position and the amount of the food. Onlooker bees watch the dance of the employee bees and decide
which food resource to go so they can select the food sources which they can gather more food with less energy consumption. (Drias et al., 2005) have introduced a bee colony inspired algorithm and referred as “Bees Swarm Optimization” and have tested the algorithm on MAX-W-SAT (the maximum weighted satisfiability) problem. Yang introduced another bee oriented algorithm and called as Virtual Bee Algorithm and tested it with two dimensional problems under one agent and multi-agent conditions (Yang, 2005). Teodorovic proposed bee swarm intelligence based algorithm and tested to solve complex traffic and transportation problems (Teodorovic´, 2003; Lucic and Teodorovic´ 2002).
The main motivation of this work is Artificial bee colony (ABC) algorithm which simulates the foraging behavior and collective work of different kinds of bees by (Karaboğa, 2005). The algorithm tested on multimodal and multi-dimensional numerical optimization problems. ABC was firstly developed to solve numerical optimization problems and the performance compared to GA and particle swarm inspired evolutionary algorithm (PS-EA) (Basturk and Karaboga, 2006; Karaboga and Basturk, 2007). Performance of differential evaluation (DE), PSO and evolutionary algorithm (EA) on basic numerical functions are also tested against ABC (Karaboga and Akay, 2008; Karaboga and Basturk, 2008). ABC algorithm is also used to train artificial neural network weights (Karaboga and Akay, 2007; Karaboga et al., 2007), classify medical patterns, clustering (Karaboga et al., 2008; Ozturk and Karaboga, 2008) and solving travelling salesman problem (Shrivastava et al., 2015).
In this work our goal was improving the performance of the ABC algorithm without increasing the maximum fitness evaluation count. Performance of the proposed method is investigated for real-parameter optimization on both basic and composite functions presented at the Congress of Evolutionary Computation 2005 (CEC05). In Section 2 ABC algorithm was introduced. In Section 3 proposed modifications on ABC algorithm are introduced. In Section 4 test results for different dimensions of CEC05 problems are presented and in Section 5 test results are discussed.
ARTIFICIAL BEE COLONY ALGORITHM
Metaheuristic algorithms are developed to solve combinational optimization problems like travelling salesman problem or vehicle routing problem but today they are also used to solve real parameter estimation problem which can be described as finding best parameter values of a function which minimizes or maximizes the function. For example in equation 1 if it is wanted to find the best x and y values which minimizes the function under circumstances of -3<x<5.5 and y>12 then this problem can be described as a real parameter optimization problem.
xy
x
y
x
f
(
,
)
2
2
y
2
(1)In this work the proposed method tested on real parameter optimization problem. ABC algorithm searches the global search space to find suitable parameter values by three types of bees (or agents) which are listed below.
Employee Bee: A food source (or possible solution) is assigned to an employee bee. The mission of an employee bee is giving information about the particular food source which it is assigned to onlooker bees. This information is the food amount (quality of the solution). After a food source has not enough resources anymore then the employee bee which assigned to that source become scout bees.
Onlooker Bee: This type of bees search better food sources around the employee bees. The idea behind is better solutions should be around the best solutions. At this point employee bees guide to onlooker bees to better solutions.
Scout Bee: Scout bees are assigned to find new food sources that are not found by employee bee. So they fly to far away that are not visited yet. After they found a new source they become employee bees.
STATISTICALLY GUIDED ARTIFICIAL BEE COLONY ALGORITHM
A weak point of the ABC algorithm is that it searches a better solution near the current solution by modifying only one parameter at a time. But some of the other metaheuristic algorithms changes more than one parameter to speed up the convergence. However it is tried to modify more than one parameters in an ABC variant (Akay and Karaboga, 2010) but the algorithm uses another parameter which decides to make modification more than one parameter. The idea behind the proposed method finding value which is very close the optimal value to use on all agents as the second parameter modification. The problem is calculating that kind of near optimal value? At this point statistical methods come to help. Proposed method detects the near optimal values in three steps:
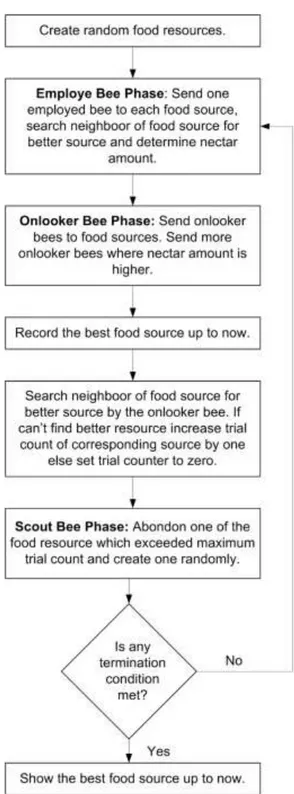
Figure 1. Flowchart of the ABC algorithm.
First step is detecting first 10 best fitness valued solutions. We use 100 as population count and 50 for food sources count. Solutions (food sources) are sorted by their fitness values and parameter values of first 10 solutions are reserved for further steps.
At the second step standard deviation (SD) values of the each parameter are calculated from the best fitness valued solutions that are detected and reserved in step 1. SD is a measurement technique to understand how much an array of variable are different from each other. SD is calculated in 3 steps. In first step average value of the array is calculated by equation 2. In second step variance of the array is calculated by equation 3 and in last step SD is calculated as square root of the variance in equation 4.
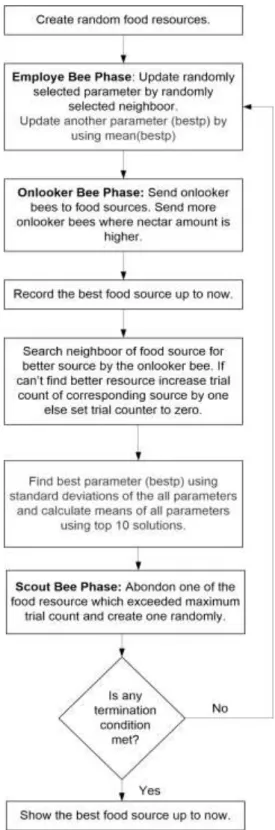
Flowchart of the proposed algorithm is presented in figure 2 and pseudo code is presented in figure 4. Changed parts are written in red.
Figure 2. Flowchart of proposed ABC algorithm
n i ia
n
M
11
(2)
N i iM
a
N
VAR
1 2)
(
1
(3)VAR
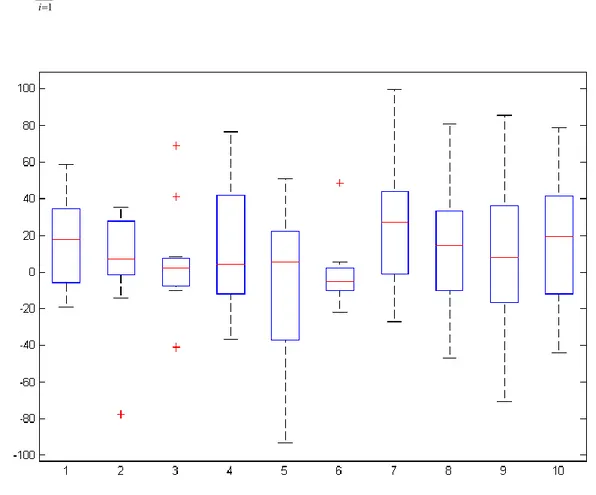
(4)SD values are calculated for each dimension of the food sources to find the parameter which is closer to optimum value. But how can it be decided that mean value of a parameter is near the optimum value only by looking the SD value of the parameter? Solution of that problem can be shown by an example. The box-plot representation in figure 3 is acquired by the parameter values of first 10 best solutions in 11.cycle of ABC for the 10 dimensions sphere function which is described by Equation 5.
D i ix
x
f
1 2)
(
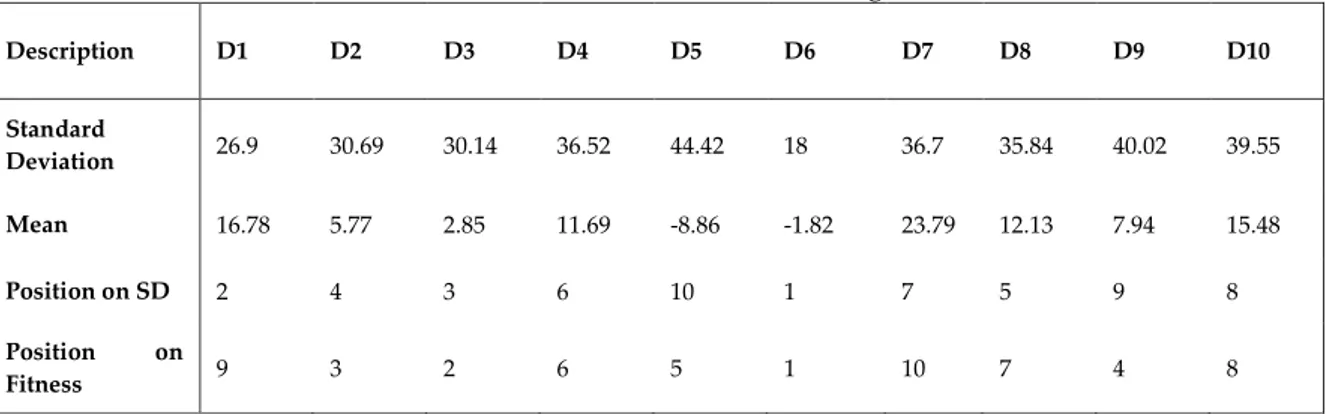
(5)Figure 3. Box-plot representation of first 10 best solutions of the sphere function in 11.cycle. Each box represents a parameter (or dimension). Short box represent small SD values and tall box represents big SD values. Values in figure 2 are summarized in Table 1. Columns in Table 2 represent the parameters and first two rows represent SD values, mean values of the first 10 best solutions respectively. The row referred as “Position on SD” represents the parameter’s position when the parameters sorted by their SD values in ascending order and the row referred as “Position on Fitness” represents the parameter positions when the parameters are sorted by their distance of means values to optimum values. For example parameter 6 (D6) has a SD value 18 and when the parameters are sorted by the SD it’s position is 1 because it has the lowest SD value among the parameters. The mean value of the D6 -1.82 and its optimum value for sphere function in equation 5 is zero. So the distance to optimum
value is -1.82 and its “Position on Fitness” value is also 1. The same relation can be seen other dimensions. So at this point it can be said that “Position on SD” values are related to “Position on Fitness” values. More clearly it can be said that mean value of the minimum SD valued parameter is very close to its optimum value. This assumption is the key concept of the proposed method. So we detect the best parameter in every cycle by SD values and use its value for second parameter modification.
Table 1. Summarized values for figure 3.
Description D1 D2 D3 D4 D5 D6 D7 D8 D9 D10 Standard Deviation 26.9 30.69 30.14 36.52 44.42 18 36.7 35.84 40.02 39.55 Mean 16.78 5.77 2.85 11.69 -8.86 -1.82 23.79 12.13 7.94 15.48 Position on SD 2 4 3 6 10 1 7 5 9 8 Position on Fitness 9 3 2 6 5 1 10 7 4 8
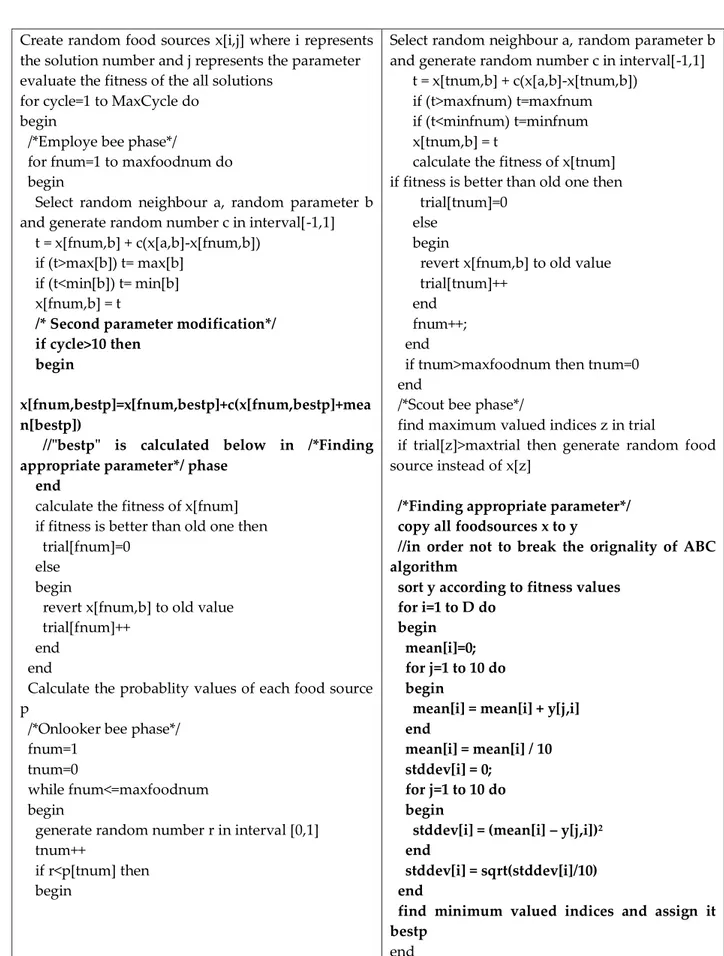
Modified parts of the algorithm are shown bold. In modified part “/*Finding appropriate parameter*/” best fitness valued solutions are sorted and first 10 of them are used to calculate SD values of the parameters. Minimum SD valued parameter number is assigned to “bestp” variable. The other modified part of the algorithm is “/* Second parameter modification*/” where the bestpth parameter of each employee bee is modified by the mean value of the bestpth parameter. Second parameter modification is similar to standard parameter modification in ABC except instead of finding a random parameter of a random neighbor it uses mean value of the bestpth parameter. Second parameter modification is used only in in employee bee phase because using it onlooker bee phase causes solutions to bias thought to same value. Second parameter modification is applied after 10 iterations from beginning in order to allow parameters to decide a near optimal value.
EXPERIMENTAL RESULTS
The proposed method tested against to standard ABC algorithm with both basic and composite functions presented at Congress of Evolutionary Computation 2005 (CEC05) in four categories. First category is fitness evaluation tests. In the test proposed fitness values of the proposed method are compared to original ABC under the same conditions. In second test methods are compared by the stability. For this purpose standard deviation of fitness values that are obtained after 30 independent runs are compared. In third test convergence speeds are tested for both methods. Last test was time consumption test. In this test methods are compared by their time consumptions.
We have used 10, 30 and 50 for problem dimensions. For a fair comparison we have used the same parameters for both methods. Population size is set to 100 and food sources size is set to 50. MaxCycle is set according to dimension size. We established 104 fitness evaluations for each dimension by calculating
MaxCycle value in Equation 6.
size
pop
D
MaxCycle
_
10000
(6)where “D” represents the dimensionality and “pop_size” represents population number of the ABC algorithm.
Create random food sources x[i,j] where i represents the solution number and j represents the parameter evaluate the fitness of the all solutions
for cycle=1 to MaxCycle do begin
/*Employe bee phase*/
for fnum=1 to maxfoodnum do begin
Select random neighbour a, random parameter b and generate random number c in interval[-1,1] t = x[fnum,b] + c(x[a,b]-x[fnum,b])
if (t>max[b]) t= max[b] if (t<min[b]) t= min[b] x[fnum,b] = t
/* Second parameter modification*/ if cycle>10 then
begin
x[fnum,bestp]=x[fnum,bestp]+c(x[fnum,bestp]+mea n[bestp])
//"bestp" is calculated below in /*Finding appropriate parameter*/ phase
end
calculate the fitness of x[fnum] if fitness is better than old one then trial[fnum]=0
else begin
revert x[fnum,b] to old value trial[fnum]++
end end
Calculate the probablity values of each food source p
/*Onlooker bee phase*/ fnum=1
tnum=0
while fnum<=maxfoodnum begin
generate random number r in interval [0,1] tnum++
if r<p[tnum] then begin
Select random neighbour a, random parameter b and generate random number c in interval[-1,1] t = x[tnum,b] + c(x[a,b]-x[tnum,b])
if (t>maxfnum) t=maxfnum if (t<minfnum) t=minfnum x[tnum,b] = t
calculate the fitness of x[tnum] if fitness is better than old one then trial[tnum]=0
else begin
revert x[fnum,b] to old value trial[tnum]++
end fnum++; end
if tnum>maxfoodnum then tnum=0 end
/*Scout bee phase*/
find maximum valued indices z in trial
if trial[z]>maxtrial then generate random food source instead of x[z]
/*Finding appropriate parameter*/ copy all foodsources x to y
//in order not to break the orignality of ABC algorithm
sort y according to fitness values for i=1 to D do
begin mean[i]=0; for j=1 to 10 do begin
mean[i] = mean[i] + y[j,i] end
mean[i] = mean[i] / 10 stddev[i] = 0;
for j=1 to 10 do begin
stddev[i] = (mean[i] – y[j,i])2
end
stddev[i] = sqrt(stddev[i]/10) end
find minimum valued indices and assign it bestp
end
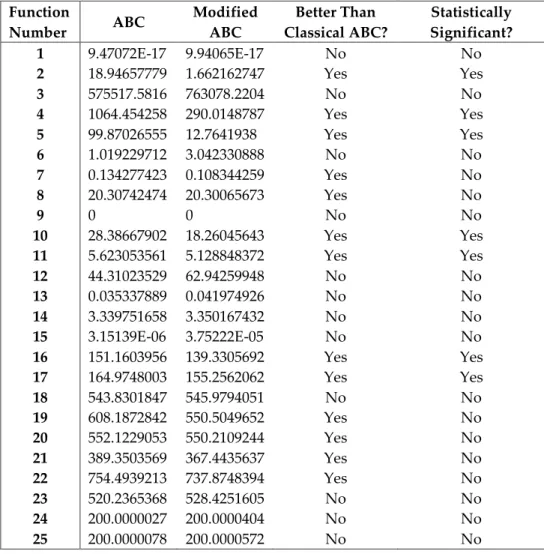
Fitness Evaluation Test:
Fitness evaluation test results are obtained by the results of 30 independent runs. In “Function Number” column, corresponding function numbers in CEC05 are presented, in “ABC” column mean fitness value of the 30 independent runs are presented. Similarly in “Modified ABC” column mean fitness value of 30 independent runs are presented for proposed modified ABC algorithm. In “Better Than Classical ABC” column represents the comparison result of the mean of original ABC and Modified ABC test results. If Modified ABC is better than the original one then the column value is set to “Yes” otherwise column value is set to “No”. “Statistically Significant” column represents paired t test results of the 30 independent runs at the 5% significance level. If difference between the results is statistically significance then column value is set to “Yes” otherwise the column value is set to “No”.
Table 2. Test Results for 10 dimensions problems. Function Number ABC Modified ABC Better Than Classical ABC? Statistically Significant? 1 9.47072E-17 9.94065E-17 No No 2 18.94657779 1.662162747 Yes Yes 3 575517.5816 763078.2204 No No 4 1064.454258 290.0148787 Yes Yes 5 99.87026555 12.7641938 Yes Yes 6 1.019229712 3.042330888 No No 7 0.134277423 0.108344259 Yes No 8 20.30742474 20.30065673 Yes No 9 0 0 No No 10 28.38667902 18.26045643 Yes Yes 11 5.623053561 5.128848372 Yes Yes 12 44.31023529 62.94259948 No No 13 0.035337889 0.041974926 No No 14 3.339751658 3.350167432 No No 15 3.15139E-06 3.75222E-05 No No 16 151.1603956 139.3305692 Yes Yes 17 164.9748003 155.2562062 Yes Yes 18 543.8301847 545.9794051 No No 19 608.1872842 550.5049652 Yes No 20 552.1229053 550.2109244 Yes No 21 389.3503569 367.4435637 Yes No 22 754.4939213 737.8748394 Yes No 23 520.2365368 528.4251605 No No 24 200.0000027 200.0000404 No No 25 200.0000078 200.0000572 No No
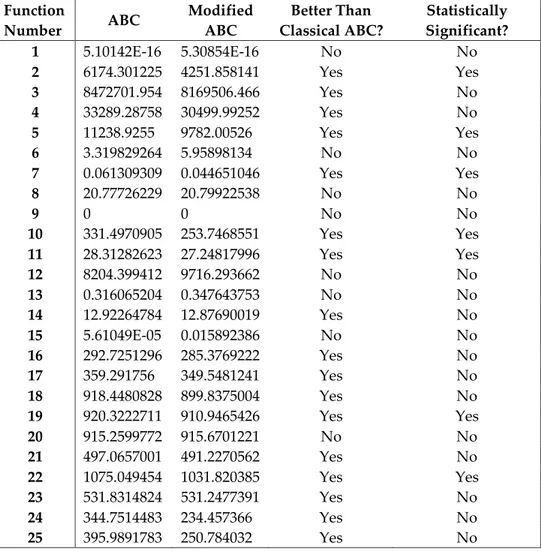
Table 3. Test Results for 30 dimensions problems. Function Number ABC Modified ABC Better Than Classical ABC? Statistically Significant? 1 5.10142E-16 5.30854E-16 No No 2 6174.301225 4251.858141 Yes Yes 3 8472701.954 8169506.466 Yes No 4 33289.28758 30499.99252 Yes No 5 11238.9255 9782.00526 Yes Yes 6 3.319829264 5.95898134 No No 7 0.061309309 0.044651046 Yes Yes 8 20.77726229 20.79922538 No No 9 0 0 No No 10 331.4970905 253.7468551 Yes Yes 11 28.31282623 27.24817996 Yes Yes 12 8204.399412 9716.293662 No No 13 0.316065204 0.347643753 No No 14 12.92264784 12.87690019 Yes No 15 5.61049E-05 0.015892386 No No 16 292.7251296 285.3769222 Yes No 17 359.291756 349.5481241 Yes No 18 918.4480828 899.8375004 Yes No 19 920.3222711 910.9465426 Yes Yes 20 915.2599772 915.6701221 No No 21 497.0657001 491.2270562 Yes No 22 1075.049454 1031.820385 Yes Yes 23 531.8314824 531.2477391 Yes No 24 344.7514483 234.457366 Yes No 25 395.9891783 250.784032 Yes No
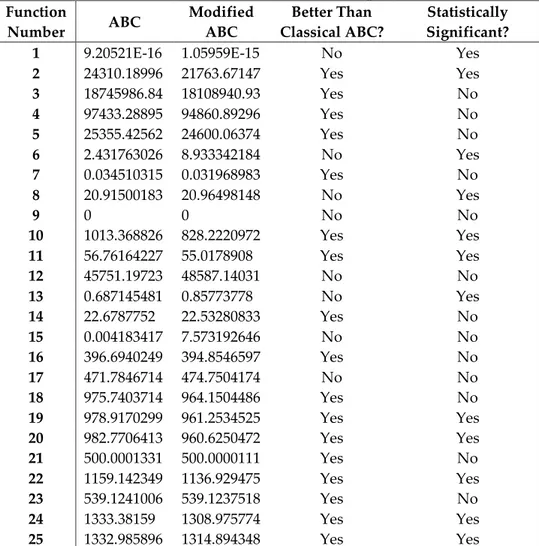
Table 4. Test Results for 50 dimensions problems. Function Number ABC Modified ABC Better Than Classical ABC? Statistically Significant?
1 9.20521E-16 1.05959E-15 No Yes
2 24310.18996 21763.67147 Yes Yes 3 18745986.84 18108940.93 Yes No 4 97433.28895 94860.89296 Yes No 5 25355.42562 24600.06374 Yes No 6 2.431763026 8.933342184 No Yes 7 0.034510315 0.031968983 Yes No 8 20.91500183 20.96498148 No Yes 9 0 0 No No 10 1013.368826 828.2220972 Yes Yes 11 56.76164227 55.0178908 Yes Yes 12 45751.19723 48587.14031 No No 13 0.687145481 0.85773778 No Yes 14 22.6787752 22.53280833 Yes No 15 0.004183417 7.573192646 No No 16 396.6940249 394.8546597 Yes No 17 471.7846714 474.7504174 No No 18 975.7403714 964.1504486 Yes No 19 978.9170299 961.2534525 Yes Yes 20 982.7706413 960.6250472 Yes Yes 21 500.0001331 500.0000111 Yes No 22 1159.142349 1136.929475 Yes Yes 23 539.1241006 539.1237518 Yes No 24 1333.38159 1308.975774 Yes Yes 25 1332.985896 1314.894348 Yes Yes
The fitness evaluation test results are a bit complicated so we summarized all the test tables above in Table 5.
Table 5. Summarized fitness evaluation test results. Dimensions
Proposed method is better than the Classical ABC
Statistically Significant?
Proposed method is worse than the Classical ABC Statistically Significant? 10 13 7 12 0 30 17 7 8 0 50 17 8 8 4
Fitness evaluation test results are encouraging. In most of the tests, proposed method is better than ABC in most cases and also when it is worse than the original ABC, the results are not statistically significance.
Standard Deviation Test
SD test are done in order to measure the stability of the methods. If two different methods compared with the same test functions by 30 independent runs it can be said that the smaller SD valued function is more stable than the other one. SD test results are presented in Table 6.
Table 6. SD test results D=10 D=30 D=50 Function Number ABC Modified ABC Better Than Classical ABC? ABC Modified ABC Better Than Classical ABC? ABC Modified ABC Better Than Classical ABC?
1 1.18E-17 1.25E-17 No 5.55E-17 6.09E-17 No 1.32E-16 1.09E-16 Yes
2 14.83463 1.238683 Yes 1856.119 1387.997 Yes 3997.128 2726.737 Yes
3 297920.5 514213.6 No 2764282 2388461 Yes 4605850 5586789 No
4 648.3193 173.9363 Yes 5957.668 5570.806 Yes 12543.29 9729.833 Yes
5 121.8133 53.2 Yes 1527.727 1456.137 Yes 1948.405 2047.314 No 6 1.955067 7.789525 No 4.327962 9.071855 No 3.73836 13.4603 No 7 0.050566 0.051547 No 0.018554 0.017983 Yes 0.007188 0.014279 No 8 0.070881 0.080921 No 0.079209 0.082064 No 0.048878 0.039768 Yes 9 0 0 No 0 0 No 0 0 No 10 5.400138 5.343894 Yes 49.31465 42.80711 Yes 98.77225 108.6589 No 11 0.744279 0.800136 No 1.680044 1.458333 Yes 2.737719 2.497108 Yes 12 37.10748 71.9975 No 4491.794 4741.499 No 15669.93 18980.61 No 13 0.016922 0.020334 No 0.103545 0.109501 No 0.141407 0.274759 No 14 0.225732 0.226375 No 0.282256 0.251902 Yes 0.216866 0.350755 No 15 1.02E-05 0.000141 No 0.000188 0.053657 No 0.022268 35.91271 No 16 15.14174 14.37557 Yes 35.33667 40.476 No 7.913829 13.1236 No 17 18.33895 17.91638 Yes 45.07728 49.80905 No 10.30309 10.30978 No 18 101.8693 95.0339 Yes 4.319544 92.88999 No 30.22302 22.35548 Yes 19 144.8556 114.7886 Yes 4.497828 21.23954 No 20.42147 21.63619 No 20 99.95363 105.9822 No 21.73962 2.925873 Yes 28.11129 19.13792 Yes 21 77.05258 99.30221 No 15.80195 26.32415 No 0.000654 1.43E-05 Yes 22 120.5941 144.6947 No 29.30139 40.16287 No 32.73313 39.21758 No 23 52.49604 46.2016 Yes 5.988237 6.586686 No 0.000999 0.000916 Yes
24 1.38E-05 0.000215 No 325.6949 183.2311 Yes 28.38805 26.49105 Yes
25 3.5E-05 0.000308 No 362.1658 201.2555 Yes 28.57924 25.10953 Yes
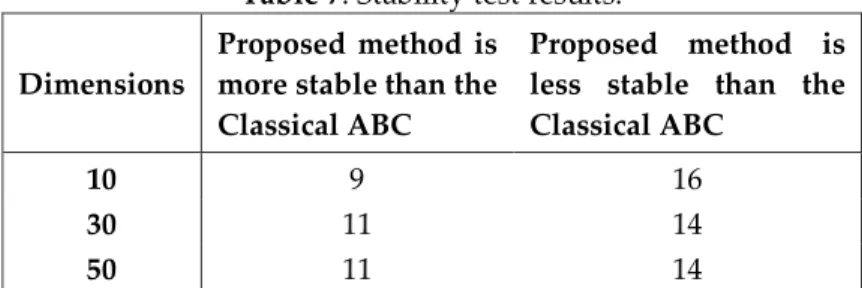
The SD test results are a bit complicated so we summarized all the test tables above in Table 7. Table 7. Stability test results.
Dimensions
Proposed method is more stable than the Classical ABC
Proposed method is less stable than the Classical ABC
10 9 16
30 11 14
50 11 14
In stability test it can’t be said that original ABC is more stable than the proposed method for all situation. Especially test results are close for the problems which have 30 and 50 dimensions.
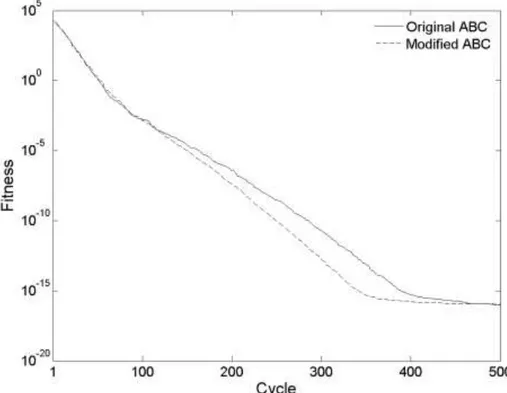
Convergence Speed test:
Convergence speed are illustrated in figure 5-10 in order to present which method can find better results with less fitness evaluations.
Figure 5. Convergence graphics for function 1 and dimension 10
Figure 7. Convergence graphics for function 2 and dimension 10
Figure 9. Convergence graphics for function 3 and dimension 10
Figure 10. Convergence graphics for function 3 and dimension 50
In convergence test it can be said that proposed method find better solutions with less fitness evaluations in lower dimension sizes. When dimension sizes get larger the advantage of the proposed method is lost.
Time Consuming Test:
Developing a better method over the original one always has some additional cost. These costs may be additional fitness evaluations, additional computations or additional memory consumption. However the important rule in swarm intelligence methods is finding better fitness values with less or the same fitness evaluation counts. So proposed method uses the same fitness evaluation count and needs a little additional computation to find better fitness values. The additional computation cost is presented by a time consuming test for “Rosenbrock” function by the different dimension sizes in Table 8.
Table 8. Time consuming test results for Rosenbrock function. Dimensions Original ABC
Proposed
Method Increment (%)
10 9.53166 9.56286 0.327330182
30 29.7494 29.8586 0.367066227
50 51.1215 51.2931 0.335670902
When Table 8 evaluated, it can be said that proposed method needs less than 1% additional computation according to original one and this is not a significance difference.
CONCLUSIONS
According to experimental results it can claimed that proposed method has found better result with same fitness evaluations. The proposed method needs only %0.5 additional computation and this cost can be tolerated. Some of the other modified methods also can find better results than original ABC algorithm but they need additional parameters and the values of the parameters should be set properly by the user, otherwise method may find worse results. In this perspective proposed method is a parameter-less method and can work without user interactions. Stability and fitness performance of the method can be improved method by additional modifications.
REFERENCES
Akay, B., Karaboga, D., 2012 “A Modified Artificial Bee Colony Algorithm for Real-Parameter Optimization”, Information Sciences, Vol. 192, pp. 120-142. doi:10.1016/j.ins.2010.07.015
Basturk, B., Karaboga, D., “An Artificial Bee Colony (ABC) Algorithm for Numeric Function Optimization”, IEEE Swarm Intelligence Symposium, Indianapolis, Indiana, USA, May 2006. Dorigo, M., Maniezzo, V., Colorni, A., Positive Feedback as a Search Strategy, Technical Report 91-016,
Politecnico di Milano, Italy, 1991.
Drias, H., Sadeg, S., Yahi, S., “Cooperative Bees Swarm for solving The Maximum Weighted Satisfiability Problem”, Computational Intelligence and Bioinspired Systems. in: 8th International Workshop on Artificial Neural Networks IWANN 2005, Vilanova, Barcelona, Spain, June 8–10 2005.
Holland, J.H., 1975, Adaptation in Natural and Artificial Systems, University of Michigan Press, Ann Arbor, MI.
Karaboga, D., 2005, An Idea Based on Honeybee Swarm for Numerical Optimization, Technical Report TR06, Erciyes University, Engineering Faculty, Computer Engineering Department.
Karaboga, D., Basturk, B., 2007, “A Powerful and Efficient Algorithm for Numerical Function Optimization: Artificial Bee Colony (ABC) algorithm”, Journal of Global Optimization, Vol. 39 (3), pp. 459–471.
Karaboga, D., Akay, B., “Solving Large Scale Numerical Problems Using Artificial Bee Colony Algorithm”, in: Sixth International Symposium on Intelligent and Manufacturing Systems Features, Strategies and Innovation, Sakarya, Türkiye, 14–17 October 2008.
Karaboga, D., Akay, B., “An Artificial Bee Colony (ABC) Algorithm on Training Artificial Neural Networks”, in: 15th IEEE Signal Processing and Communications Applications, SIU 2007, Eskisehir, Türkiye, pp. 1–4, June 2007.
Karaboga, D., Basturk, B., 2008, “On The Performance of Artificial Bee Colony (ABC) Algorithm”, Applied Soft Computing, Vol. 8 (1), pp. 687–697.
Karaboga, D., Akay, B., Ozturk, C., 2007, “Modeling Decisions for Artificial Intelligence, Artificial Bee Colony (ABC) Optimization Algorithm for Training Feed-Forward Neural Networks”, LNCS 4617/2007, Springer-Verlag, pp. 318–329.
Karaboga, D., Ozturk, C., Akay, B., “Training Neural Networks with ABC Optimization Algorithm on Medical Pattern Classification”, in: International Conference on Multivariate Statistical Modelling and High Dimensional Data Mining, Kayseri, TURKEY, 19–23 June 2008.
Kennedy, J., Eberhart, R.C., in: “Particle Swarm Optimization”, 1995 IEEE International Conference on Neural Networks, Vol. 4, pp. 1942–1948, 1995.
Lucic, P., Teodorovic´, D., “Transportation Modeling: An Artificial Life Approach”, 14th IEEE International Conference on Tools with Artificial Intelligence ( ICTAI, 2002), pp. 216–223, 4-6 November 2002.
Ozturk, C., Karaboga, D., “Classification by Neural Networks and Clustering with Artificial Bee Colony (ABC) Algorithm”, in: Sixth International Symposium on Intelligent and Manufacturing Systems Features, Strategies and Innovation, Sakarya, Türkiye, 14–17 October 2008.
Shrivastava A., Gupta M., Swami S., “Enhanced Artificial Bee Colony Algorithm with SPV for Travelling Salesman Problem”, 2015 International Conference on Computing Communication Control and Automation, Pune, pp. 887-891, 2015.
Teodorovic´, D., 2003, “Transport Modeling by Multi-Agent Systems: a Swarm Intelligence Approach”, Transportation Planning and Technology, Vol. 26 (4), pp. 289-312.
Yang, X.S., “Engineering Optimizations via Nature-inspired Virtual Bee Algorithms”, in: Artificial Intelligence and Knowledge Engineering Applications: A Bioinspired Approach, LNCS, vol. 3562/2005, pp. 317– 323, June 2005.