Monitoring Excimer Formation of Perylene dye molecules within
PMMA-based Nanofiber via FLIM Method
Mehmet Naci Inci*
a, Sabriye Acikgoz
b, Mustafa Muammer Demir
ca
Department of Physics, Bogazici University, 34342 Istanbul, Turkey ;
bDepartment of Material
Science and Engineering, Karamanoğlu Mehmetbey University, 70100 Karaman, Turkey;
cDepartment of Materials Science and Engineering, Izmir Institute of Technology, 35430 Izmir,
Turkey
ABSTRACT
Confocal fluorescence lifetime imaging microscopy method is used to obtain individual fluorescence intensity and lifetime values of aromatic Perylene dye molecules encapsulated into PMMA based nanofibers. Fluorescence spectrum of aromatic hydrocarbon dye molecules, like perylene, depends on the concentration of dye molecules and these dye molecules display an excimeric emission band besides monomeric emission bands. Due to the dimension of a nanofiber is comparable to the monomer emission wavelength, the presence of nanofibers does not become effective on the decay rates of a single perylene molecule and its lifetime remains unchanged. When the concentration of perylene increases, molecular motion of the perylene molecule is restricted within nanofibers so that excimer emission arises from the partially overlapped conformation. As compared to free excimer emission of perylene, time-resolved experiments show that the fluorescence lifetime of excimer emission of perylene, which is encapsulated into NFs, gets shortened dramatically. Such a decrease in the lifetime is measured to be almost 50 percent, which indicates that the excimer emission of perylene molecules is more sensitive to change in the surrounding environment due to its longer wavelength. Fluorescence lifetime measurements are typically used to confirm the presence of excimers and to construct an excimer formation map of these dye molecules.
Keywords: PMMA, nanofibers, perylene, excimer emission, FLIM
1. INTRODUCTION
The versatility of the fluorescence lifetime method allows its application to diverse areas of study, including but not limited to materials science, arts, aeronautics, agriculture, forensics, biology, and medicine. It is known that the presence of dielectric interfaces influences the radiative transition frequencies and decay rates. According to the studies on the spectroscopic characteristics of an atom surrounding with a cavity, fluorescence lifetime of atom depends on the dimensions of the cavity. If the dimensions of the cavity are larger than or comparable to the radiation wavelength, the spontaneous emission rate of the atom changes considerably due to resonant modes (whispering gallery modes) [1]. However, in the case of nanocavities, whose dimensions are much smaller than the radiation wavelength, surface curvature and quadruple transitions as well as the plasmon resonances become effective on the spontaneous decaying rates. It is predicted by Purcell that an atom in a smaller wavelength-size cavity can radiate much faster than in the free space [2]. Photonic structures with wavelength-scale dimensions offer interesting opportunities to engineer the photophysical properties of embedded emitters such as decay rate, quantum yield and photobleaching rate [3]. It is hard to produce a sustainable host with exactly the same dimensions all the time during fabrication to accommodate dye molecules for enhancement of spontaneous emission rate. The electrospinning is a straightforward and cost-effective method to produce novel fibers with diameters in the range of nano to micrometer [4]. The electrospinning process and the resulting fiber morphology depend on the solution properties (e.g., viscosity, conductivity, surface tension, permittivity, and boiling point) and operating conditions (e.g., applied voltage, spinneret-to-collector distance, and flow rate) [5]. These properties of electrospun nanofibers make them suitable for a wide range of applications such as medicine, tissue engineering, drug delivery control, filtration, sensors, energy and environmental protection [6-11]. Recently, polymer nanofibers are attracting an increasing interest in nanophotonic applications due to their
sub-Nanophotonics VI, edited by David L. Andrews, Jean-Michel Nunzi, Andreas Ostendorf, Proc. of SPIE Vol. 9884, 988413 · © 2016 SPIE · CCC code: 0277-786X/16/$18 · doi: 10.1117/12.2225899
Proc. of SPIE Vol. 9884 988413-1
wavelength dimensions. Lots of hybrid light emitter/polymer nanofiber composites are prepared using organic dye molecules, rare earth elements and semiconductor quantum dots [12-14]. In the case of the organic dye impregnated nanofibers, the nanoconfined organic dyes undergo a charge or energy transfer, resulting in the enhancement of the fluorescence signal [13,15]. Additionally, fluorescent nanofibers have potential use in chemical and bio-sensing applications [16,17].
Perylene is a brown crystalline polycyclic aromatic hydrocarbon with the chemical formula C20H12. These dye molecules
form a characteristic excimer in excited state; therefore, they are widely used as fluorescent probe in different research fields [18]. Excimer formation processes of perylene molecules have been studied for a long time under various conditions; in solution, in crystalline, in thin polymer film, in polymer matrix, in LB film [19-25]. In this work, we studied excimer formation of perylene molecules within three-dimensional cylindrical nano-fibers (NFs). The modification of the spontaneous emission rate of perylene dye molecules embedded in Polymethyl methacrylate (PMMA) based NFs is experimentally demonstrated and excimer formation map of perylene molecules within NFs is obtained via confocal fluorescence lifetime imaging microscopy (FLIM) method.
2. EXPERIMENT
2.1 Polymerization of MMA and Electrospinning of PMMA/perylene nanofibers
Methyl methacrylate (MMA) stabilized with 10 – 20 ppm hydroquinone monomethyl ether is obtained from Fluka. It is freshyl distilled under vacuum prior to polymerization. Benzoyl peroxide (BPO) is also provided from Fluka and used as initiator. BPO is recrystallized from methanol. Perylene dye is bought from Fluka. Dimethyl formamide (DMF) and tetrahydrofurane (THF) are obtained from Riedel Haen and used as they are without further purification. MMA is distilled under vacuum. The round bottom flask containning equimolar MMA-DMF mixture is placed into a preheated bath at 60 C. BPO is used as radical source. The weight average molecular weight of PMMA was found to be 673±144 and 420±48 kDa, respectively. The mixture is subjected to freeze-thaw process three times and polymerization is carried out under vacuum for 5 h. After then, it is quenched to room temperature and polymerization is stop when the reactor is opened. For purification, PMMA is dissolved in THF and the solution is precipitated in methanol. The precipitated polymer is dried under vacuum at room temperature. PMMA is dissolved in DMF at a concentration of 2 % (w/w). Perylene dye is codissolved in the same solution with different concentrations ranging from 0.1, 0.2, 0.3, 0.4, and 0.5 %(w/w). The polymer/perylene solutions were subjected to electrospinning using a classical horizontal electrospinning set up [26]. As a counter electrode where fibers are collected, continious Al foil or a parallel positioned two metal strips with an air gap are used. Depending on geometry of the electrode, different arrangements of fibers are obtained. Instrumental parameters in electrospinning are as follows: flow rate: 3 mL/h, applied potential difference: 12 kV, and spinning distance: 10-15 cm. Weight average molecular weight of PMMA is obtained by dynamic light scattering (DLS, Nano ZS Malvern Worcestershire). The morphology of the fiber mats (diameter and shape of fibers, arrangement of fibers) is studied using scanning electron microscopy (SEM, FEI Quanta 250, Oregon). Average fiber diameter (AFD) is obtained from statistical treatment of SEM images by measuring the diameter of typically not less than 50 fibers with the help of Image J.
2.2 Time-Resolved Lifetime and Fluorescence Intensity Measurements
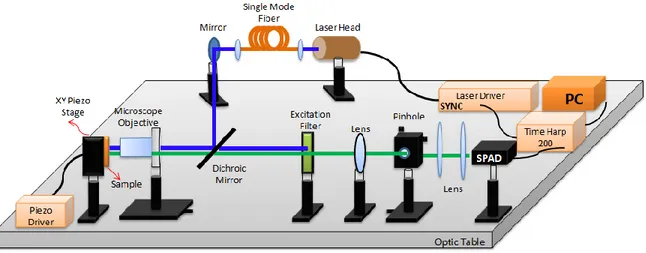
Time resolved fluorescence lifetime and fluorescence intensity measurements are performed using a TimeHarp 200 PC-Board system (Picoquant, GmbH) and a fibre optic spectrometer (USB4000-VIS-NIR Ocean Optics), respectively (see Figure 1). The excitation source used in the experiment is an ultraviolet pulsed diode laser head with a wavelength of 405 nm (LDH-C-D-405 Picoquant, GmbH). In order to obtain a Gaussian beam illumination, a single mode optical fiber is used as a waveguide (Thorlabs, S405-HP). The excitation light is focused onto the sample using a microscope objective
Proc. of SPIE Vol. 9884 988413-2
Single Mode Fiber Mirror r Head Excitation Filter
1
Pinhole Laser Driver SYNC Lens Optic Tableof 0.55 numerical apertures with a working distance of 10.1 mm (Nikon, ELWD 100X). A pinhole, which has a diameter 75 μm, is placed to focal plane, in order to increase the resolution of the FLIM images. In the confocal FLIM setup, a xy piezo scanner from Piezosystem Jena, which allows a scan range of 100×100 μm2 (NV40-3CLE), and SCX 200
(Picoquant, GmbH) fluorescence lifetime imaging controller are used for NFs surface scanning. Fluorescence lifetimes are calculated pixel-by-pixel using SymPho Time software (Picoquant, GmbH).
Fig 1. Fluorescence lifetime imaging microscopy setup
3. RESULTS AND CONCLUSION
PMMA/perylene solutions at different concentrations were subjected to electrospining at 1 kV∙cm–1. Figure 2 presents overview SEM images of nonwoven perylene-doped PMMA fibers. Average fiber diameter (AFD) range from 0.3 µm to 0.4 µm. It was found to be independent of perylene concentration in PMMA at least in the concentration range we employed in this study. The fibers were also imaged by fluorescence microscope (FM, panel a of Fig. 3) and confocal fluorescence lifetime imaging microscope (FLIM, panel b of Fig. 3).
Figure 2. SEM images of fibers electrospun from PMMA/perylene dye solutions. Dye content in PMMA is given wt% as the inset of each image.
Proc. of SPIE Vol. 9884 988413-3
(a)
20
Um,
.,
` ti.ii
90000 80000 70000 60000 50000 40000 30000 20000 10000 0-%0.1
Perylene-%0.2
Concentration -%0.3 in Nanofibers -%0.4-%0.5
400 450 500 550 600 650 Wavelenght (nm) 700 750 800Figure 3. Representative FM (a) and FLIM (b) images (12.2×9.0 μm) of perylene doped NFs
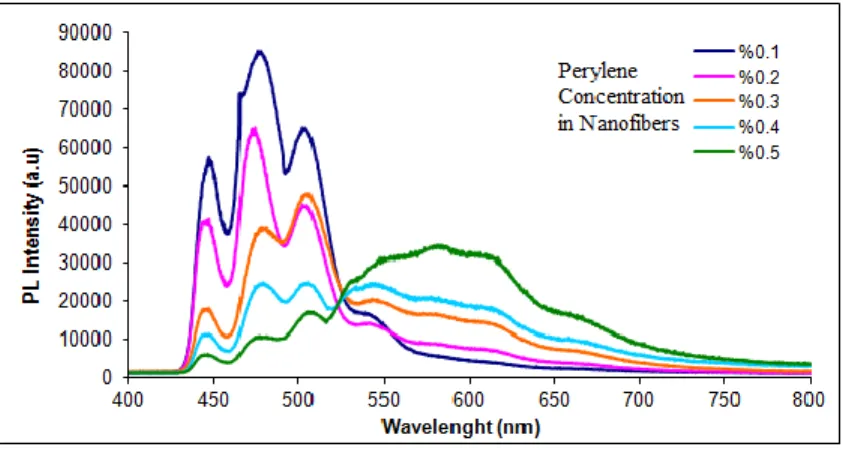
Nanofibers shown in Figure 2 are functionalized by aromatic perylene dye molecules. The fluorescence intensity and spontaneous emission rate of perylene are studied in the optical setup shown in Figure 1. Perylene molecules are uniformly distributed within and along the nanofibers. Fluorescence spectra of perylene in PMMA based nanofiber at five different concentrations are shown in Figure 4. The fluorescence emission spectrum of a dilute perylene solution is characterized by an ensemble of three major vibronic bands with well defined peaks at 450, 480 and 510 nm, respectively. This spectrum is essentially a structured mirror image of the absorption spectrum, as would be expected for relaxation from the excited singlet states of isolated molecules. Fluorescence spectrum of aromatic hayrocarbon dye molecules, like perylene, depends on the concentration of dye molecules. In many cases, concentration quenching of the molecular fluorescence is accompanied by the appearance of a new emission band which is red-shifted compared to the fluorescence of the uncomplexed molecules. Excimer is an excited state dimer and results from the interaction between an excited singlet state and an unexcited molecule. Excimer emission spectrum is broad and structureless with the peak around 580 nm. Under increasing concentrations of perylene, the fluorescence spectra are red-shifted. Unstructured emission is observed at concentrations of 0.3, 0.4 and 0.5 mol % perylene doped nanofibers.
Figure 4. Fluorescence spectra of perylene in PMMA based nanofiber at different concentrations
The time-resolved fluorescence lifetime of the perylene dye molecule is performed using the PCI-Board system (TimeHarp 200, PicoQuant). The measurement of the fluorescence lifetime is based on the time correlated single photon counting (TCSPC) method. In this method, the time between the detected single photon of the fluorescence (start signal) and the excitation laser pulse (stop signal) is measured. The measured data is plotted as a fluorescence lifetime
Proc. of SPIE Vol. 9884 988413-4
histogram. For multi-exponential fluorescence decay fitting, FluoFit computer program (Picoquant, GmbH) is used.
The fluorescence intensity decays is recovered from the frequency-domain data in terms of a multiexponential model, (1) where Ai is the amplitude of each component and τi is its lifetime. The fractional contribution of each component to the
steady-state intensity is described by
. (2)
The intensity weighted average lifetime is represented as
(3) and the amplitude-weighted lifetime is given by
. (4)
In order to measure the decay parameters of free perylene dye molecules, they are doped on a microscope slide at two different concentrations: highly concentrated and dilute. At high concentration, perylene exhibits excimer formation and the intensity weighted fluorescence lifetime of perylene monomer band is measured as 4.133 ns, while that of excimer band emission is 12.201 ns as seen in Figure 5. The excited state lifetime of the excimer species is significantly longer than that of the monomer, therefore; fluorescence lifetime measurements are typically used to confirm the presence of excimers.
To observe the wavelength dependent photonic interactions between dye molecules and nanofibers, nanofiber diameter is specially fabricated fixed around 330 nm. For fiber diameters below ~300 nm, the size is hard to determine due to diffraction and the resolution of our confocal microscope is not enough to obtain FLIM images of these types of nanofibers. Therefore, we have performed all the time resolved fluorescent lifetime experiments for such nanofibers. While the monomer emission is observed at a wavelength about 400 nm for 0.1 and 0.2 mol perylene doped nanofibers, the excimer emission appears at a wavelength about 600 nm for concentrated (0.3, 0.4 and 0.5 mol) perylene doped nanofibers. Time resolved experiments show that, the average fluorescence lifetime of perylene monomer emission remains almost the same for the fiber diameter about 330 nm. The fluorescence lifetime decay curves of perylene molecules on PMMA based NFs and microscope slides are given in Figure 5. The perylene monomer fluorescence decay curves are also analyzed using Fluo-Fit software and calculated decay parameters are given in Table 1. It is observed that the average lifetime values of monomer emission are centered about 4.0-4.3 ns. Because of the fact that the dimension of a nanofiber is comparable to the monomer emission wavelength, the presence of nanofibers does not become effective on the decay rates of a single perylene molecule. On the other hand, the time resolved experiments reveal a significant modification of the decay rate of excimer emission of perylene molecules for diameters (~300 nm) below the wavelength of radiation (~600 nm). The fluorescence lifetime of perylene molecules decreases from 12.201 ns to 6.125 ns. In Figure 5, the fluorescence lifetime decay curves are given and calculated decay parameters are summarized in Table II. The great decrease in the fluorescence lifetime of the concentrated perylene doped NF is likely due to much longer wavelength of excimer emission. Particularly, for dimensions below the wavelength of light, the associated strong modification of the local photonic density of states alters the photophysical properties of the emitters.
n i i it
A
t
I
1)
exp(
j j j i i iA
A
f
i i if
i i i i iA
A
Proc. of SPIE Vol. 9884 988413-5
15.0 13.5 12,0 ÿ 10.5 0 U 9.0
e
1 7.5 6.0 45 30 15Excimer Emission of perclene on G! ,i
(z)- 12 ns
Monomer Emission on Glass ` Excimer Emission of .= and mol perviene on NF
(r)-- 4ns (r),- 6ns
Monomer Emission of 0.1 and 0.2 mol pervlene on NF
(z)» 4ns
070 88.5 90.0 91,5 93.0
Time (ns)
94.5 96.0 97.5
Figure 5. Fitting and calculation of decay parameters of Perylene. (─) indicates multi-exponential fitting curve.
Table 1. Decay parameters of Perylene dye molecules
Emission
Type
Sample
A
1(au)
τ
1(ns)
A
2(au)
τ
2(ns)
(ns)
𝝌
𝟐 Monomer Emission Glass 7746 4.483 3492 1.182 4.133 3.458 1.147 NF +0.1 Pery. 8956 4.302 2820 1.198 4.052 3.559 1.249 NF +0.2 Pery. 7857 4.535 2718 1.138 4.264 3.662 1.098 Excimer Emission Glass 16100 11.683 -2658 6.285 12.201 12.751 1.527 NF +0.3 Pery. 8138 6.687 3753 1.619 6.179 5.088 1.113 NF +0.4 Pery. 8121 6.709 3774 1.627 6.194 5.097 1.112 NF +0.5 Pery. 8277 6.435 1928 2.159 6.125 5.627 1.127 ) (ns a
b(ns)Proc. of SPIE Vol. 9884 988413-6
(c)
6 ns IIs 4 ns 3 ns
Fluorescence lifetime imaging microscopy (FLIM) is an imaging technique for producing an image based on the differences in the exponential decay rate of the fluorescence from a fluorescent sample. FLIM is quite an innovation because it allows fluorescence lifetime sensitivities to be monitored in a spatially distinct manner in living cells as well as for other chemical processes. Moreover, FLIM can probe the local environments of fluorophores such as the local pH, refractive index, ion and oxygen concentration without the need for ratio metric measurements. FLIM can be performed with two distinct methods. In the first method, the fluorescence intensity for each pixel is determined after a short time interval via time-gated experiments and an intensity map is produced. This method offers the potential to eliminate background fluorescence and enhance imaging contrast. The other method is performed by measuring the fluorescence lifetime for each pixel and generating a lifetime map of the object. Three-dimensional information can be obtained by FLIM technique and FLIM lifetime maps are generally used to monitor the functional changes due to environmental factors.
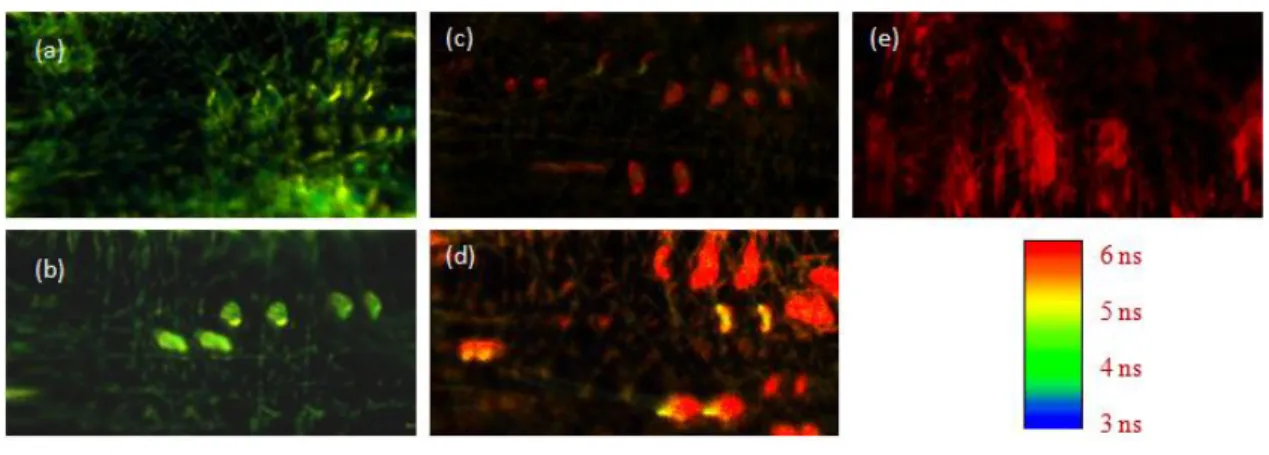
FLIM method is used to obtain individual lifetime values of aromatic Perylene dye molecules encapsulated into PMMA based nanofibers and to construct an excimer formation map of these dye molecules. The confocal FLIM images of Perylene dye molecules encapsulated into three dimensional polymer based NFs are given in Figure 6. FLIM images are displayed using a continuous pseudocolor scale ranging from 3 to 6 ns (from blue to red). In other words, color of the images represents fluorescence lifetime of Perylene dye molecules within NFs. Moreover, the size of every FLIM figure is 500 × 250 pixel (12.2 × 6.1 μm). Our picosecond time resolved experiments show that the fluorescence lifetime of perylene monomer and excimer emission within a confined environment (NFs) are about 4 and 6 ns, respectively. In FLIM images, the green color represents monomer emission lifetimes of about 4 ns and the red color excimer emission lifetimes of about 6 ns. For dilute perylene concentration, green color is dominant as seen in Figure 6 (a) and (b). When the concentration of perylene dye molecules within NFs is increased, excimer formation starts and the color distribution in the FLIM image shifts from green to red. The resolution of our home-made and open frame FLIM microscope is about 200 nm. Therefore, a single nanofiber is clearly observed in dilute perylene dye doped FLIM images. When the dye concentration is increased, the adhesion of nanofibers occurs and the resolving power of our FLIM images reduces. In Figure 6(e), it is observed that the fluorescence lifetime of perylene excimer emission in a single nanofiber and in the adhesive nanofibers have the same value. Consequently, the adhesion of nanofiber is not effective on the fluorescence lifetime values.
Figure 6. Confocal FLIM images of (a) 0.1 mol (b) 0.2 mol (c) 0.3 mol (d) 0.4 mol (e) 0.5 mol Perylene doped nanofibers
Proc. of SPIE Vol. 9884 988413-7
The existence of perylene excimer in NFs is confirmed for the first time by observing the difference between the decay times of excimer and monomer fluorescence with fluorescence lifetime imaging method. Monomer emission of perylene is unaffected by NF which has a diameter ofabout 330 nm and its lifetime remains unchanged. However, when these nanofibers are doped with more concentrated perylene, in addition to monomer excitation, an excimer excitation is generated. Thus causes observation of the Purcell effect in the three-dimensional nano-cylindrical photonic fiber geometry. This work ensures that the fluorescence characteristics of an excimer can be modified due to the Purcell effect and electrospun NFs are such suitable materials for investigating the effects of different local photonic environments. Conversely, FLIM technique is used to record high resolution optical images of the electrospun NFs and to obtain excimer formation map of perylene molecules within NFs.
REFERENCES
[1] Braginsky, V.B., Gorodetsky, M.L., Ilchenko, V.S., “Quality-factor and nonlinear properties of optical whispering-gallery modes,” Phys. Lett. A 137, 393 (1989).
[2] Purcell, E.M., “Spontaneous emission probabilities at radio frequencies,” Phys. Rev. 69,681 (1946).
[3] Tomczak, N., Gu, S., Han, M., Hulst, N.F., Vancso, G. J., “Single light emitters in electrospun polymer nanofibers: Effect of local confinement on radiative decay” Eur. Polym. J. 42, 2205 (2006).
[4] Reneker, D.H., Yarin, A.L., Zussman, E., Xu, H., “Electrospinning of Nanofibers from Polymer Solutions and Melts” Adv. Appl. Mech. 41,43 (2006).D.H.
[5] Matsumoto. H., Tanioka. A., “Functionality in Electrospun Nanofibrous Membranes Based on Fiber’s Size, Surface Area, and Molecular Orientation” Membranes 1(3), 249 (2011).
[6] Liu, W., Thomopoulos, S., Y, Xia., “Electrospun nanofibers for regenerative medicine” Adv. Healthcare Mater. 1,10 (2012).
[7] Vasita, R., Katti, D.S., “Nanofibers and their applications in tissue engineering” Int. J. Nanomed. 1(1), 15 (2006).
[8] Yu, D.G., Zhu, L.M., White, K., White, C.B., “Electrospun nanofiber-based drug delivery systems” Health 1(2), 67 (2009)
[9] Qin, X. H., Wang, S.Y., “Filtration properties of electrospinning nanofibers” J. Appl. Polym. Sci. 102, 1285 (2006).
[10] Ding, B., Wang, M., J. Yu., Sun, G., “Gas Sensors Based on Electrospun Nanofibers” Sensors 9, 1609 (2009). [11] Thavasi, V., Singh, G., Ramakrishna, S., “Electrospun nanofibers in energy and environmental applications”
Energy Environ. Sci. 1, 205 (2008).
[12] A. Camposeo, A., Di Benedetto, F., Stabile, R., Cingolani, R., Pisignano, D., “Electrospun dye-doped polymer nanofibers emitting in the near infrared”Applied Physics Letters 90, 143115, 2007.
Proc. of SPIE Vol. 9884 988413-8
[13] Yu, H., Wang, H., Li, T., Che, R., “Preparation and luminescent properties of YBO3:Eu nanofibers by
electrospinning” Appl. Phys A 108, 223, (2012).
[14] Meng, C., Xiao, Y., Wang, P., Tong, L., “Quantum-Dot-Doped Polymer Nanofibers for Optical Sensing” Advanced Materials 23(33), 2011.
[15] Lee, K.J., Oh, J.H., Y, Kim., Jang, J., “Fabrication of Photoluminescent-Dye Embedded Poly(methyl methacrylate) Nanofibers and Their Fluorescence Resonance Energy Transfer Properties” Adv. Mater. 18, 2216 (2006)
[16] Liu, X., Zhang, X., Lu, R., Xue, P., Xu, D., Zhou, H., “Low-dimensional nanostructures fabricated frombis(dioxaborine)carbazole derivatives as fluorescent chemosensors for detecting organic amine vapors” J. Mater. Chem. 21, 8756 (2011)
[17] Law, B., Weissleder, R., Tung, C.H., “Protease-Sensitive Fluorescent Nanofibers” Bioconjugate Chem. 18, 1701, (2007).
[18] Nelson, K.A., Dlott, D.D., Fayer, M.D., Excited state dynamics in pure molecular crystals: perylene and the excimer problem Chem. Phys. Lett. 64(1), 88 (1979).
[19] Katoh, R., Sinha, S., Murata, S., Tachiya, M., Origin of the stabilization energy of perylene excimer as studied by fluorescence and near-IR transient absorption spectroscopy J. Photochem. Photobiol. A;145, 23 (2001). [20] Auweter, H., Ramer, D., Kunze, B., Wolf, H.C., “The dynamics of excimer formation in perylene crystals”
Chem. Phys. Lett. 85(3), 325 (1982).
[21] Nishimura, H., Matsui, A., Iemura, M., “Luminescence and Exciton Lattice Interaction in α-Perylene Crystals” J. Phys. Soc. Jpn. 51, 1341 (1982).
[22] Tachikawa, H., Faulkner, L.R., “Anomalous luminescence from perylene in thin polymer films” Chem. Phys. Lett. 39, 436 (1976).
[23] Salamon, Z., Bassler, H., “Fluorescence properties of perylyne aggregates in a polymer matrix (PMMA)” Chem. Phys. 100, 393 (1985).
[24] Weiss, D., Kietzmann, R., Mahrt, J., Tufts, B., Storck, W., Willing, F., “E-excimer and Y-type luminescence of perylene dimers in a Langmuir-Blodgett film at 1.5 K” J. Phys. Chem. 96, 5320 (1992).
[25] Akimoto, S., Ohmori, A., Yamazaki, I., “Dimer Formation and Excitation Relaxation of Perylene in Langmuir−Blodgett Films” J. Phys. Chem. B 101, 3753 (1997).
[26] Demir, M.M., Yilgor, I., Yilgor, E., Erman, B., “Electrospinning of polyurethane fibers” Polymer 43(11), 3303 (2002).
Proc. of SPIE Vol. 9884 988413-9