ÇANKAYA UNIVERSITY
GRADUATE SCHOOL OF SOCIAL SCIENCE
DEPARTMENT OF INTERNATIONAL TRADE AND FINANCE
MASTER’S THESIS
THE RELATIONSHIP BETWEEN TURKEY’S OLIVE OIL EXPORT INCOME AND ECONOMIC GROWTH FIGURES: OLIVE OIL SECTOR
PROBLEMS AND SOLUTIONS PROPOSALS IN TURKEY
ABSTRACT
THE RELATIONSHIP BETWEEN TURKEY‟S OLIVE OIL EXPORT INCOME AND ECONOMIC GROWTH FIGURES: OLIVE OIL SECTOR PROBLEMS
AND SOLUTIONS PROPOSALS IN TURKEY
ALTUNTAġ, SĠNAN CAN
M.Sc. International Trade and Finance
Thesis Supervisor: Assoc. Prof. Dr. Dilek TEMĠZ DĠNÇ
September 2018, 172 Page
The purpose of this study is to provide information about the agricultural product sector and the olive and olive oil products sector. Also the main purpose of this study is the demonstration of relationship between Turkey‟s olive oil export income and economic growth figures. This relationship is examined by using the quarterly data in between 1999:Q1 and 2017:Q1. In addition another aim is to find solutions on the existing problems and to provide recommendations about the sector. For people who to continue their lives must consume processed and unprocessed foodstuffs derived from agricultural, vegetal and animal products. Due to the diversity of geographical shapes in the World, different climate types are formed. Naturally this different type of climate enables the cultivation of various agricultural, herbal and animal products. Some of consumer products provide to meet people‟s needs and they are cultivated or grown in many countries of the world; but some of them are cultivated or grown in limited geographical areas. An example of
this situation is the olive crop, which has the potential to grow only where Mediterranean climate features dominate.
Olive and olive oil are the products that are produced, consumed and traded by since long years. Olive and olive oil, one of the symbolic products of the Mediterranean climate, are increasing own importance every day because of its positive effects on human health. The increasing importance of the olive and olive oil sector in the world that is economically important for the countries and companies which produce and trade these products. Spain, Italy, Greece which are members of the European Union (EU), have a high share in the world table olive and olive oil sector. Also Turkey is one of the important countries in the world‟s olive and olive oil sector. Turkey‟s table olive and olive oil sector has a potential returns in terms of economics and employment. Despite that, this sector has some production and commercial problems. The public or state institutions and private sectors continue to work on resolving these problems. Turkey‟s 2023 commercial target has also table olive and olive oil sector. Its aim is 3.8 billion USD as revenue from exports of these products. In order to increase the economic growth figures in our country, it is necessary for the institutions and enterprises that are operating on the commercial field to increase the production amounts and then the export revenues. Olive oil products contribute to Turkey's economy with net export revenues. Because of some reason, olive oil activity area is assessing the scope of this thesis.
ÖZET
TÜRKĠYE‟DE ZEYTĠNYAĞI ĠHRACATI GELĠRLERĠ VE EKONOMĠK BÜYÜME RAKAMLARI ARASINDAKĠ ĠLĠġKĠ: SEKTÖRDEKĠ PROBLEMLER
VE ÇÖZÜM ÖNERĠLERI
ALTUNTAġ, SĠNAN CAN
Uluslararası Ticaret ve Finansman, Yüksek Lisans Tezi (M.Sc.)
DanıĢman: Doç. Dr. Dilek TEMĠZ DĠNÇ
Eylül 2018, 172 Sayfa
Bu çalıĢmanın amacı; tarım ürünleri sektörü, zeytin ve zeytinyağı ürünleri sektörü hakkında bilgi vermektir. Ayrıca, Türkiye‟ nin zeytinyağı ihracat gelirleri ve ekonomik büyüme rakamları arasındaki iliĢkinin analizinin gerçekleĢtirilmesi temel amacımızdır. AraĢtırması ve ekonometrik analizi yapılan bu konuda zaman aralığı olarak 1999:Q1-2017:Q1 dönemi ele alınmıĢtır. Bu duruma ek olarak, sektörde yaĢanan problemlerin belirlenmesi, bu problemlere çözüm oluĢturulması ve üzerinde çalıĢılmıĢ olan sektörlere yönlik önerilerde bulunulması çalıĢmanın diğer hedefleri arasındadır. Ġnsanlar yaĢamlarına devam edebilmesi için tarımsal, bitkisel ve hayvansal ürünlerden elde edilen iĢlenmiĢ ve iĢlenmemiĢ besin maddelerini tüketmesi gerekmektedir. Dünyadaki coğrafi Ģekillerin çeĢitlilik göstermesi dolayısıyla farklı iklim tipleri oluĢmakta bu durum ise değiĢik tarımsal, bitkisel ve hayvansal ürünlerin yetiĢtirilmesine olanak sağlamaktadır. Ġnsanların ihtiyacını karĢılayan bazı tüketim ürünleri dünyanın birçok ülkesinde yetiĢirken bazıları ise
kısıtlı bir coğrafi alanda yetiĢme imkânı bulabilmektedir. Sadece Akdeniz iklim özelliklerinin egemen olduğu yerlerde yetiĢebilme imkânı bulan zeytin ürünü de bu duruma örnek olarak gösterilebilir.
Zeytin ve zeytinin iĢlenmiĢ hali olan zeytinyağı geçmiĢten günümüze kadar uzun yıllardır üretimi, tüketimi ve ticareti yapılan ürünlerin baĢında gelmektedir. Akdeniz iklimini sembolize eden bitkisel ürünlerden olan zeytin ve zeytinyağı insan sağlığına olumlu etkileri dolayısıyla önemini her geçen gün arttırmaktadır. Dünyada zeytin ve zeytinyağı sektörünün öneminin artması bu ürünleri üreten ve ticaretini yapan ülkeler ve firmalar için ekonomik açıdan önem arz etmektedir. Avrupa Birliğine mensup ülkelerden olan Ġspanya, Ġtalya, Yunanistan Dünya zeytin ve zeytinyağı sektöründen yüksek oranda pay almaktadır. Türkiye‟de bu sektörde kendinden söz ettiren önemli ülkelerdendir. Türkiye açısından zeytin ve zeytinyağı sektörü ekonomik getiri potansiyeline sahip iĢ alanlarındandır. Zeytin ve zeytinyağı sektöründe üretim ve ticari konularda problemler yaĢanmaktadır. Bu problemlerin çözüme kavuĢturulması için hem kamu hem özel kesim çalıĢmalarını sürdürmektedir. Türkiye‟nin 2023 yılı ticari hedefleri arasında zeytin ve zeytinyağı sektörü de bulunmakta ve bu ürünlerin ihracatından 3,8 milyar Amerikan Doları gelir elde edilmesi amaçlanmaktadır. Ülkemizde ekonomik büyüme rakamlarının artıĢ gösterebilmesi için ticari alanda faaliyet gösteren kurum ve iĢletmelerin üretim ve akabinde ihracat gelirlerini arttırması gerekmektedir. Türkiye‟nin ekonomisine ihracat gelirleri ile pozitif etki yaratmakta olan zeytinyağı ürünü de bu tez kapsamında değerlendirmektedir.
ACKNOWLEDGEMENTS
I kindly present my thanks to my valuable thesis consultant Associate Professor Doctor Dilek TEMĠZ DĠNÇ who approached to me with patience from the beginning till the end of my thesis, who did not spare her help and who was with me with his knowledge and experience.
I endlessly thank to my dear wife Attorney Alev KOÇ ALTUNTAġ who patiently waited for my thesis to finish and who obdurately helped me and whom I want to be with me through all my life. And of course I thank too much to my dear family who gave me all material and moral supports.
Also, i thank to my colleague Instructor Tugay ÜSTÜN who helped me when i prepared this thesis.
TABLE OF CONTENTS
STATEMENT OF NON-PLAGIARISM ... Hata! Yer iĢareti tanımlanmamıĢ.
ABSTRACT ... iv
ÖZET ... vi
ACKNOWLEDGEMENTS ... viii
TABLE OF TABLES ... xii
TABLE OF FIGURE ... xiv
LIST OF ABBREVIATIONS ... xv
INTRODUCTION ... 1
CHAPTER I ... 5
ONE OF THE IMPORTANT SECTORS WHICH AFFECT THE ECONOMIC GROWTH OF TURKEY: AGRICULTURAL PRODUCTS SECTOR ... 5
1.1 The World‟s Agricultural Products Sector ... 5
1.1.1 Agricultural Production in the World ... 7
1.1.2 Economic Structure of the World Agriculture Sector and Foreign Trade ... 9
1.2 The Effects of Multilateral Commercial Agreements on the World Agricultural Sector ... 14
1.3 The Leader Countries in the World Agriculture Sector ... 16
1.3.1 International Organizations Operates in the World Agricultural Sector ... 16
1.3.2 International Companies Operates in the World Agricultural Sector ... 17
1.4 The Foreign Trade Problems in the World Agricultural Sector ... 18
1.5 Agricultural Products Sector in Turkey ... 19
1.5.1 Developments in the Field of Agriculture after 1980s in Turkey ... 22
1.6 The European Union's Common Agricultural Policy‟s (CAP) Importance for Turkey23 1.7 Agricultural Production in Turkey ... 24
1.9 A Sub-Sector of Industrial Products Industry: Processed Products Sector Based on
Agriculture ... 36
1.9.1 Food Products Sector ... 38
1.9.2 Agricultural Raw Material Products Sector ... 39
1.10 Economic Position and Importance of Agricultural Sector in the Turkey ... 41
1.11 The Amount of Export and Import in the Agricultural Products Sector in Turkey and the Commercial Gain of Sector ... 45
1.11 The Applied Policies and Supports to Turkey‟s Agricultural Sector ... 50
CHAPTER II ... 52
THE OLIVE and OLIVE OIL SECTOR IN THE WORLD AND IN TURKEY ... 52
2.1 The Definitions of Olive and Olive Oil and Their Properties ... 52
2.1.1 The Definition of Olive ... 52
2.1.2 General Information about the Olives ... 53
2.1.3 The Place of Olive in the World ... 54
2.1.4 The Place of Olives in Turkey ... 56
2.1.5 The Definition of Olive Oil ... 58
2.1.6 The General Informations about the Olive Oil ... 59
2.1.7 The Types of Olive Oil ... 59
2.1.8 The Place of Olive Oil in the World ... 62
2.1.9 The Place of Olive Oil in the Turkey ... 62
2.2 The General Informations about Customs Tariff Statistics Position Numbers in Foreign Trade ... 63
2.2.1 The Customs Tariff Statistics Position Numbers of Olive Oil in Foreign Trade .. 64
2.3 The Olive and Olive Oil Sector in the World ... 65
2.3.1 The Production of Olive and Olive Oil in the World ... 68
2.3.2 The World Olive and Olive Oil Consumption ... 75
2.3.3 The World Olive and Olive Oil Import ... 81
2.3.4 The World Olive and Olive Oil Export ... 86
2.4 The Olive and Olive Oil Sector in Turkey ... 91
2.4.1 The Olive and Olive Oil Production in Turkey ... 94
2.4.2 The Olive and Olive Oil Consumption in Turkey ... 97
2.4.3 The Olive and Olive Oil Import in Turkey ... 98
2.4.4 The Olive and Olive Oil Export in Turkey ... 99
2.4.5 The Economic Contribution of Olive Oil Export in Turkey ... 103
2.6 The Agricultural Policies Implemented in the Olive and Olive Oil Sector in Turkey 109 2.6.1 The Government Supports and Incentives Applied in the Olive Oil Sector in
Turkey ... 111
2.7. The Benefits of the Olive Oil to People‟s Health ... 112
CHAPTER III ... 115
ECONOMETRIC ANALYSIS OF THE RELATIONSHIP BETWEEN TURKEY’S OLIVE OIL NET EXPORT INCOME AND ECONOMIC GROWTH FIGURES IN TURKEY ... 115
3.1 The Review of Sectoral Studies ... 115
3.2 The Econometric Method ... 128
3.3 The Data and Empirical Findings ... 129
3.4 Evaluation of Research Results and Recommendations ... 140
REFERENCES ... 147
TABLE OF TABLES
Table 1: The World Cereals, Fruit, Vegetable Production Amount (Million Tonnes) 8 Table 2: The World Agricultural Goods and Products Export Value (Billion US $) 12 Table 3: The World Agricultural Goods and Products Import Value (Billion US $) 13
Table 4: The World Trade Summary (Billion US $) ... 14
Table 5: The Selected Countries Supply and Demand Share in the World Agriculture Sector (%) ... 16
Table 6: The World's Largest Commodity Trading Companies ... 18
Table 7: The ABCD Company Group in the World Cereal Trade ... 18
Table 8: The Agricultural Area are used in Turkey (Hectar) ... 21
Table 9: The Shares and Areas in Agricultural Production of Agricultural Products are grown in Turkey (%) ... 26
Table 10: The Shares in Agricultural Production of Animal Products are grown in Turkey (%) ... 26
Table 11: The List of Grain and Plantation Products are grown in Turkey ... 28
Table 12: The List of Fruits are grown in Turkey ... 29
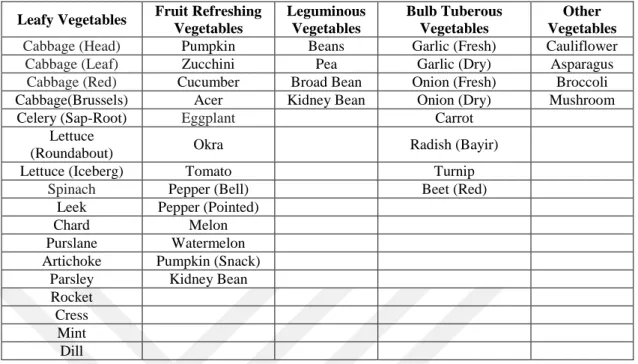
Table 13: The List of Vegetables are grown in Turkey ... 30
Table 14: The Export Value of Herbal Products in Turkey (1,000 US $) ... 32
Table 15: The Amount of Live Animals in Turkey (Per Unit or Head) ... 32
Table 16: The Production Amount of Animal Products in Turkey (Tonnes) ... 33
Table 17: The Export Value of Animal Products in Turkey (1,000 US $) ... 34
Table 18: The Export Value of Wood and Forest Products in Turkey (1,000 US $). 36 Table 19: The Export Value of Processed Products Sector Based on Agriculture in Turkey (1.000 USD $) ... 37
Table 20: The Food Commodities Foreign Trade Value (1.000 US $) ... 39
Table 21: The Agricultural Raw Material Products Foreign Trade Value (Million US $) ... 40
Table 22: The Rate of Change in Turkey‟s Total GDP and in the Total Agriculture Sector‟s GDP (%) ... 43
Table 23: The Sectors or Product Groups in the Agricultural Foreign Trade in accordance with SITC Rev.3 Form... 46
Table 24: The Turkey‟s Total Export and Import Values and Agricultural Sector Export and Import Values by Years (Million US $) ... 47
Table 25: The Share of Agricultural Foreign Trade in Turkey‟s Total Foreign Trade (%) ... 48
Table 26: The Turkey‟s Top 10 Export Products in the Agriculture and Food Sector
in 2016 Source: TURKSTAT, 2016. ... 49
Table 27: The Olive Trees Area in Turkey (1,000 Hectare) ... 57
Table 28: The Amount of Olive Trees in Turkey (1.000 Pieces)... 57
Table 29: Customs Tariff Statistics Position Numbers of Olive Oil in Foreign Trade ... 65
Table 30: The World Table Olive Production Amount (1.000 Tonnes) ... 70
Table 31: The EU Table Olive Production Amount (1.000 Tonnes) ... 71
Table 32: The World Olive Oil Production Amount (1.000 Tonnes) ... 72
Table 33: The EU Olive Oil Production Amount (1.000 Tonnes) ... 73
Table 34: The World Table Olive Consumption Amount (1.000 Tonnes) ... 76
Table 35: The EU Table Olive Consumption Amount (1.000 Tonnes) ... 77
Table 36: The Wold Olive Oil Consumption Amount (1.000 Tonnes) ... 78
Table 37: The EU Olive Oil Consumption Amount (1.000 Tonnes) ... 80
Table 38: The World Table Olive Import Amount (1.000 Tonnes) ... 82
Table 39: The EU Table Olive Import Amount (1.000 Tonnes)... 83
Table 40: The World Olive Oil Import Amount (1.000 Tonnes) ... 84
Table 41: The EU Olive Oil Import Amount (1.000 Tonnes)... 85
Table 42: The World Table Olive Export Amout (1.000 Tonnes) ... 87
Table 43: The EU Table Olive Export Amount (1.000 Tonnes)... 88
Table 44: The World Olive Oil Export Amount (1.000 Tonnes) ... 89
Tablo 45: The EU Olive Oil Export Amout (1.000 Tonnes) ... 90
Table 46: The List of the Biggest Exporters is in the Turkish Olive and Olive Oil Sector ... 100
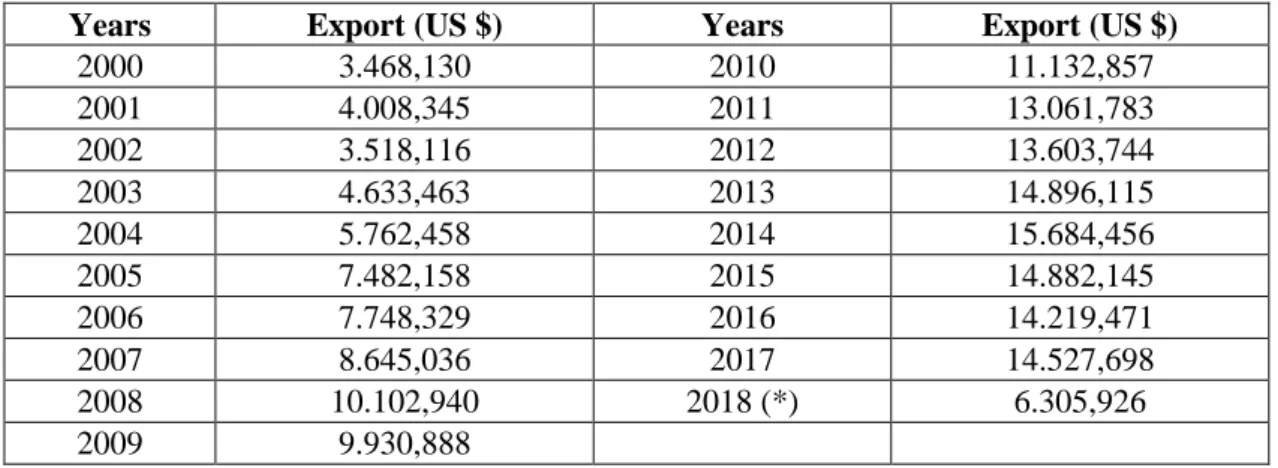
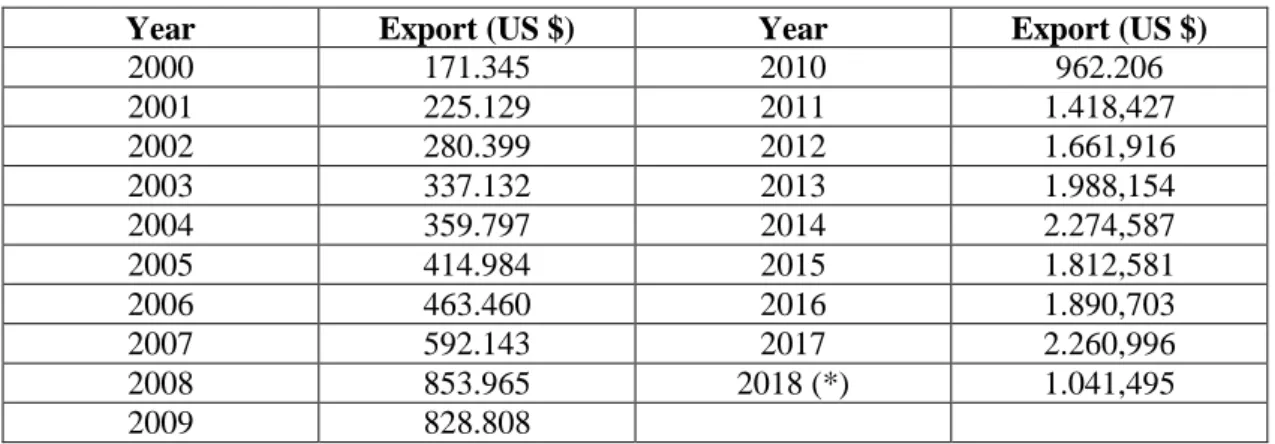
Table 47: The Economic Contribution of Olive Oil Export in Turkey (1,000 US $) ... 103
Table 48: ADF and PP Unit Root Test Results ... 131
Table 49: VAR Determination of the Delay Length (Series: NX-Y) ... 132
Table 50: Inverse Roots of AR Characteristic Polynomial ... 133
Table 51: Unrestricted Co-integration Rank Test (Trace) ... 134
Table 52: Unrestricted Co-integration Rank Test (With Dummy) ... 135
Table 53: Error Correction Model Test Results ... 137
TABLE OF FIGURE
Figure 1: The Herbal Production Volume in Turkey (Million Tonnes)... 28
Figure 2: The Estimation of Herbal Production Statistics in Turkey ... 30
Figure 3: The Herbal Products Production Value in Turkey (Billion TRY)... 31
Figure 4: The Production Value of Live Animals and Animal Products in Turkey (Billion TRY) ... 34
Figure 5: Turkey's Total GDP Value (Billion TRY)... 42
Figure 6: The Turkey's Agriculture Sector GDP Value (Billion TRY) ... 42
Figure 7: The Turkey‟s Agricultural Sector Share in the Total Turkey‟s GDP (%) .. 44
Figure 8: The Foreign Trade Balance of the Agricultural Sector in Turkey (Million US $) ... 48
Figure 9: The Distribution Map of Olive Production in the World ... 55
Figure 10: The Map shows the Olive‟s Production Areas in Turkey ... 56
Figure 11: The Table Olive Production Amount in Turkey (1.000 Tonnes) ... 95
Figure 12: The Olive Oil Production Amout in Turkey (1.000 Tonnes) ... 96
Figure 13: The Table Olive Consumption Amout in Turkey (1.000 Tonnes) ... 97
Figure 14: The Olive Oil Consuption Amout in Turkey (1.000 Tonnes) ... 98
Figure 15: The Table Olive Export Amout in the Turkey (1.000 Tonnes) ... 102
Figure 16: The Olive Oil Export Amount in the Turkey (1.000 tonnes) ... 102
Figure 17: Time Line Charts for NX and Y Series ... 130
LIST OF ABBREVIATIONS
EU: European Union
USD: United States‟ Dollar TSI: Turkish Statistical Institute
TURKSTAT: Statistics of Turkish Statistical Institute R & D: Research and Development
GDP: Gross Domestic Product
FAOSTAT: Statistical Institution of the Food and Agriculture Organization of the United Nations
USA: United State of America UK: United Kingdom
T.C.:Republic of Turkey ADM: Archer Daniels Midland LDC: Louis Dreyfus Company
FAO: The Food and Agriculture Organization of the United Nations OECD: The Organisation for Economic Co-operation and Development WTO: The World Trade Organization
GATT: General Agreement on Tariffs and Trade TIM: Turkish Exporters Assembly
Ha: Hectare Q: Quarter
KG (kg): Kilogram
TSE: Turkish Standards Institution
UNESCO: United Nations Educational, Scientific and Cultural Organization EEC: European Economic Community
HS: Customs Tariff Statistics Position WCO: World Customs Organization IOC: International Olive Council UK: United Kingdom
TARIS: Agricultural Sales Cooperatives Union UZZK: National Olive and Olive Oil Council
EZZIB: Aegean Olive and Olive Oil Exporters' Association EIB: Aegean Exporters‟ Association
SME: Small and Medium-sized Enterprises
SWOT: Strengths, Weaknesses, Opportunities, Threats NX: Net Export of Olive Oil
Y: Gross Domestic Product or Income ADF: Augmented Dickey–Fuller Test PP: Phillips-Perron
JJ: Johansen-Juselius
VAR: Vector Auto-Regression Model AR: Auto Regressive
ECT: Error Correcting Terms SIC: Schwarz Information Criterion VECM: Vector Error Correction Model
INTRODUCTION
Today developments in the fields of trade, social, cultural, political and technology are removing the countries from a closed economy. Countries have turned to implement an open economy model in their system. One of the characteristics of the open economy policy is export and import transactions. Export which is an easy and risk-free way of opening up to foreign markets is important to gain to the country's economy and their businesses. The olive and olive oil are important agricultural product in the World and Turkey. They create economic contribution to the countries‟ budget from the production stage to the consumption stage.
Rapid industrialization has been experienced in our country since 1980's. As a result of this, the importance of agriculture has decreased distressingly. Applied unstability agricultural policies and macro-based production planning can not be realized on our country. For these reasons, it is necessary to import some agricultural products from foreign countries to Turkey. Although, some agricultural products are imported, the export made in the agricultural products sector contributes to the Turkey‟s economy.
The olive oil sector is a business area that has economic importance and operates in many countries of the World. Special attention has been paid to the olive oil sector and its products within the scope of the common market organization in the EU. The EU's olive oil sector has a solid structure in terms of applied policies. Turkey is among the countries manufacturers and exporters in this sector. This situation provides an important position to the Turkey. Turkey has an important position in the sector but it has some problems in the production and marketing
Olive oil is a product that increases its importance in the World because there are more positive effects on human health. For this reason, many countries of the World open their local markets to this product. In this case, if Turkey wants to retain its position in the olive and olive oil sector, consistent and modern policies must be applied to the sector. Additionally, Turkey must reach the same level with World and EU‟s standards in production and product quality for to talk about our identity in World olive oil markets.
Turkey which has a separate importance of growing olives in oil production has an important position in olive oil producing and exporting countries. Olive cultivition and production are made in 37 countries in the World and total of 7.5 million hectares are reserved or allocated for olive farming in terms of economic gain.The most appropriate region for the World olive growing is the Mediterranean Region. Approximately, 95% of the World olive production area is located in the Northern Mediterranean Region. In this direction, the countries where olive production is made in Turkey, Greece, Italy, Spain, Southern of France, North Africa and the some of Middle East countries. It is understood that geographical distribution and the countries are experienced in the Mediterranean climate that affect their olive production potential. In this case, Turkey has appropriate geography for olive production in terms of climate and soil properties (Ayanoğlu and friends, 1998. Yavuz, 2000).
The human body needs adequate and balanced energy from nutritions. Because of this reason, the human should consume olive oil that is the nutritious food and energy store. This phenomenon is accepted in the World day by day and this situation increases the consumption of olive oil by human.
Some countries in the EU are at the forefront of production and trade in the World olive and olive oil sector. And also these countries are leading this sector. Turkey is an important country in the World olive and olive oil sector. Also, the olive oil sector is supported by state of Turkey. However, Turkey‟s production, export and consumption amounts are not at the desired level. If Turkey wants to become a full member of the EU in the course of the proceeding, we must update our agricultural strategy that will similar to the EU‟s. And we should closely follow up the developments especially in its olive oil sector.
This thesis study is prepared and named is “The Relationship Between Turkey‟s Olive Oil Export Income And Economic Growth Figures, Olive Oil Sector Problems And Solutions Proposals In Turkey‟‟. The first chapter of this thesis informs about basic characteristics and structural state of agriculture sector in the World and Turkey. In the following sub-section includes; the share, importance and location of agriculture sector in Turkey's economy. And the impact of agricultural activities on the economic growth figures for Turkey by examined with secondary data. In the second chapter of the thesis informs general information about olive and olive oil products and sector. Also these products‟ productions, consumptions, imports, exports and economic value amounts tabulated and interpreted according to the World‟s, EU‟s and Turkey‟s official statistics. And then in the same section contains sector‟s problems, current strategies and policies in the agricultural field in Turkey. The benefits of olive oil to human health are also among the subheadings of the second chapter. In the third chapter of the study includes Turkish Statistical Institute‟s (TSI) published secondary datas which relevants to economic growth figures and olive oil‟s net export incomes contain limited time interval is 1999:1stQuarter-2017:1stQuarter to make an econometric analysis. In addition to this division, econometric analysis has been evaluated and interpreted. Literature review, general results of the research, recent reviews and suggestions about the subject exist in the last past of the chapter.
Olives have the potential to grow in areas where Mediterranean climate is available. Also, the olive product is known as an agricultural and herbal product. For this reason, the inclusion of the World‟s agricultural products sector in the thesis content and to give information about it is important for the better understanding of the subject.
As everyone knows, two kinds of products are obtained from the grown raw olives. One of them is table olive and the other is olive oil. Usually in Turkey, a majority of grown olives are used into olive oil production.
olive oil product and its economic impact taken up as a main thesis topic and a detailed examination and research about it were carried out.
The main aim of this thesis is making economic analysis in between Turkey‟s olive oil export income and Turkey‟s economic growth figures. Also the result of this econometric analysis interprets. Furthermore, examination of the problems experienced in the olive and olive oil sector and suggestions for solving these problems carve out the content of the study.
Other general objectives of the work are listed below;
To share general informations about the World‟s and Turkey‟s agricultural products sector,
To explain the structural features of the Turkey‟s agricultural products sector, relation of agricultural products sector to other sectors in Turkey and interpretation of economic data of this industry,
To give informations about the current situation of table olive and olive oil sector in the World, in the EU and in the Turkey and to examine the datas in this industry, To determine the problems are experienced in the table olive and olive oil sector in
Turkey and to make assessments for solving these sector problems,
To provide informations about the current applications of the authorized institutions and organizations in the table olive and olive oil sector in Turkey. And to examine its support policies and the consequences of these situations,
To suggest some points to do for to be in a better position in the table olive and oil olive sector of Turkey in the World.
This thesis is prepared because; to guide for researchers who want to learn about olive and olive oil sector in the World and in Turkey and to olive and olive oil producers or manufacturers who want to take a part of this sector and exporters who want to trade olive oil products. Also the guidance is giving information to economists about relationship between olive oil sector's export revenues and its contributions to the Turkey's economy. In addition, the guidance of this thesis is making some recommendations and suggestions to the public and private sectors for the development of Turkey‟s olive and olive oil sector. Additionally, the academic community can be benefited from this thesis.
CHAPTER I
ONE OF THE IMPORTANT SECTORS WHICH AFFECT THE ECONOMIC GROWTH OF TURKEY: AGRICULTURAL PRODUCTS SECTOR
1.1 The World’s Agricultural Products Sector
The impact of globalization is felt more and more every day since from 1980s. Liberalization and competition in trade of goods, services, financial instruments and capital are increasing with globalization. It is only possible to have sustainable economic development and high competitiveness for countries in which should work at the maximum level in all sectors. For this reason, firms‟ relationship should be established between sectors in the developed economies strongly. Actually, it is necessary to establish a production process in which the sectoral activities are intertwined. At this point, the agricultural sector is one of the key sectors in among economic sectors (Peker, 2014:79).
The agricultural products sector remains its characteristic as an independent and sensitive sector. In the agricultural sector, state intervention and regulation is intensified in developed countries. The greater share of the agricultural sector is in the national income of a country and how fast the growth rate of the agricultural sector is in a country so the higher contribution of the agricultural sector to the economic development of that country (Kazgan, 1966).
Agriculture sector interacts with many sectors and it provides to supply many raw materials to the agriculture based industry. Also the agricultural sector contributes to the economy by purchasing goods and services from other sectors.
Global market unstability, economic crisis, animal diseases and climate changes negatively affect the agriculture sector. In addition, population growth increases the concern of insufficient supply of food situation. It is expected that the World population will be more than 9 billion people in the 2050. Because of this situation, to feed the World population in 2050, food production has to be increased by 70% in developed countries and 100% in developing countries (Ege et al., 2006: 9). Even if the agricultural sector has been lost its commercial and economic significance, it is a strategic sector in terms of to meet human nutrition needs and to provide raw materials to other sectors.
There are many academic and scientific studies about on the agricultural sector and agricultural production in the World and Turkey. It will be appropriate to explain the terms of agriculture and agricultural production before the World agriculture sector begins.
Agriculture is the production and evaluation of plant and animal products. Agricultural production is described as the art of obtaining crops and animal products by using land and seeds. Also it is processing and commercializing these products as semi-finished or finished products (Ġnan, 1992).
There are three forms of agricultural production: (Bilgen, 2014:36-37).
1. Herbal Production is to obtain crops such as vegetables and fruits using seeds and lands. Herbal production is also divided into subgroups;
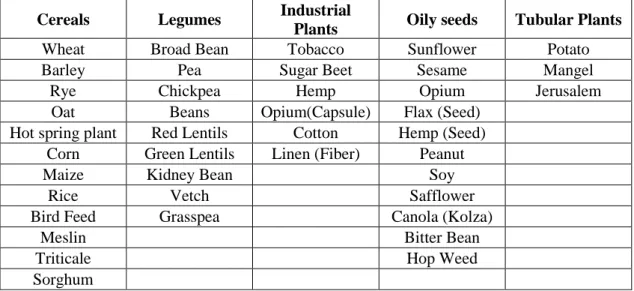
a. Field Crop
i. Grains (wheat, barley, corn, rice, etc.)
ii. Legumes (beans, chickpeas, lentils, vetch, etc.) iii. Industrial Plants (beet, cotton, tobacco, etc.) iv. Tuber Plants (potatoes, onions, etc.)
b. Vineyard and Garden Farming
i. Fruits (hard and soft seedy, citrus fruit, etc.)
ii. Vegetables (leaf, lump, flower and fruit-eaten vegetables, etc.) iii. Viticulture or Vinegrowing
iv. Olive Cultivation
c. Cultivation of Ornamental Plants i. Hall Plants
2. Animal Production is to raise animals and obtain animal products from them. Animal production is also divided into subgroups;
a. Cattle Breeding (milk, meat cattle, etc.)
b. Small Cattle Breeding (sheep, goat breeding, etc.) c. Poultry Farming (poultry, livestock, etc.)
d. Beekeeping
e. Alternative Animal Farming (horse, silkworm, fur, etc.)
3. Agricultural Arts - Processing of Agricultural Product is to process vegetable and animal products into semi-finished or full products and add new value to the this product. Agricultural Arts - Processing of Agricultural Product is also divided into subgroups;
a. Food Arts (flour industry, sugar industry, oil industry, fruit and vegetable processing industry, etc.)
b. Liquor Arts (beer, wine, yeast, etc.) c. Village handicrafts (weaving, paint, etc.)
1.1.1 Agricultural Production in the World
Many academic publications mention that countries are more becoming dependent on each other in agricultural products. Also, this situation is evidenced by shared official data. It is expected that agricultural products dependency will reach even higher levels in the coming periods. Because it is predicted the human population will be 9 billion in 2050. In addition to this, the amount of arable land is decreasing due to climate and urbanization features. This indicates that the need of agricultural products will be a critical factor. The economic, social and geographical changes on the global scale are affecting the agricultural sector. Contraction will occur in water resources and climate change that will affect to limit food production amount. Because of these conditions are happening now, the importance of research and development (R & D) in agriculture field is increasing (BüyükekĢi, 2016:2).
South East Asia and South American countries stand out as the places where the highest production level and the increasing production amount in the World agricultural products sector. The share of North America and Europe in the World production and in the World trade is decreasing. In the last quarter of the century there have been two major events in the foreign trade of agricultural products. World agriculture-food trade has grown by an average of 5% per year in real terms from 1990's onwards. Developing countries are on the export and import side of this high rate of growth. South American countries are in the export side with increasing production volumes and African countries are in the import side with increasing commercial income (Çakmak and Kasnakoğlu, 2016:16).
Many of the information about agriculture, olive and olive oil sectors which are contained in this study are supported and proven by the official tables and figures. The informations in tables and figures guide us to better understand the subject. Because of this reason, table 1 that is in the below and provides a better understanding of the agriculture sector with data and informations.
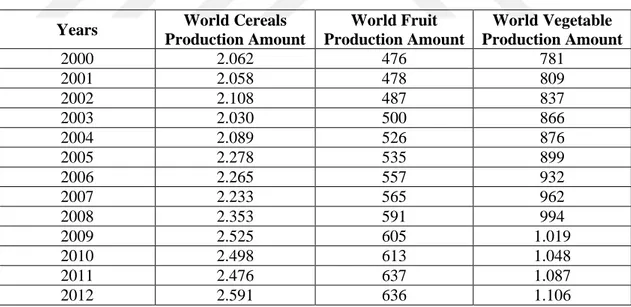
Table 1: The World Cereals, Fruit, Vegetable Production Amount (Million Tonnes) Source: FAOSTAT, 2012.
Years World Cereals Production Amount World Fruit Production Amount World Vegetable Production Amount 2000 2.062 476 781 2001 2.058 478 809 2002 2.108 487 837 2003 2.030 500 866 2004 2.089 526 876 2005 2.278 535 899 2006 2.265 557 932 2007 2.233 565 962 2008 2.353 591 994 2009 2.525 605 1.019 2010 2.498 613 1.048 2011 2.476 637 1.087 2012 2.591 636 1.106
When Table 1 is examined; the production of cereals was 2.062 million tonnes in 2000; it was reach to 2.591 million tonnes in 2012. The production of fruit was 476 million tonnes in 2000; it was reach to 636 million tonnes in 2012. Also, the production of vegetable was 781 million tonnes in 2000; it was reach to 1.106 milyon tonnes in 2012. The World production amount of agriculture products has generally increased therefore there has been a few decline in production amount for some years.
1.1.2 Economic Structure of the World Agriculture Sector and Foreign Trade
The first economic and commercial activity has been carried out by people in the field of agriculture. In recent years, the agricultural products sector has received a low share from the total World trade of goods and services. However, the agriculture sector is one of the important issues in foreign trade negotiations. Because a person‟s basic food and consumption source is provided from agricultural products. Today, the share of agricultural sector in the developed countries‟ GDP is between 2% or 3%. This situation indicates that the agricultural sector is declining in the developed countries. In developing countries such as Turkey, impacts of export in agricultural products are decreasing over the years on the total economy. Nevertheless, the sector remains its importance and long-lasting features.
When the economic growth processes of developed countries are examined, it is seen that these countries are first agricultural countries and then industrial countries. As the development levels of the countries rise, the share of the industry, trade and finance sectors increase in the economy while the share of the agricultural sector is decreasing inside that. This shows us that; there is an inverse relationship between the level of development of the countries and the agricultural sector.
Economic development and upgrade the level of the country's welfare which is the main objective of the countries. If countries want to achieve their stated economic goals, they must realize the necessary conditions for economic growth.
What is this economic growth?
Economic growth can be defined as an increase in national income or per capita income over a limited period of time.
In other words of economic growth that increases in the capacity of the country‟s production in the goods and services sector also is measurable numerically (Berber, 2004:10).
If a country succeeds to provide about stable economic growth issue; country reduces the unemployment rate, increases purchasing power and consumption
When the countires economic growth figures are examined, it is seen that the high increase rates are trended towards the developing countries. Classical industrialized countries such as; USA, Japan, Germany, United Kingdom (UK), France, Italy, Canada, Netherlands, Belgium, Sweden are gradually decreasing their importance in the World economy. The completely reverse; developing countries such as; China, India, South Korea, Indonesia, Turkey, Malaysia, Thailand and Egypt are gradually increasing their importance in the World economy (T.C. Kalkınma Bakanlığı, 2013:17).
In the last 40 years, the World's total foreign trade volume has increased about 60 times. Nevertheless, the World agricultural products sector's foreign trade volume has increased by 25 times. Decreasing transportation costs, diversification and acceleration of logistics activities have a positive effect on commercial life. In addition, trade agreements that are signed by between countries improve the global trade. The agricultural sector has also taken its share from the changes that have taken place in recent years (BüyükekĢi, 2016:2).
The value added is created by agricultural products constitutes 3%-6% of the World GDP. In Turkey 1970, this rate was 30% but now this rate has fallen to 8%. 20 countries are producing 78% of the World total GDP and they constitute 56% of the World agricultural GDP. Turkey has the 18th largest economy in the World and also Turkey has the 9th position in the creation of value-added in terms of agricultural products. There is a decrease rate in the importance of agricultural products in Turkey‟s total foreign trade. The reason for this situation is transfer of foreign trade and value added from unprocessed agricultural products classified as agricultural exports to processed agricultural products. Indeed, in Turkey exports of agricultural products has increased 5.5 times in the last 25 years (Çakmak and Kasnakoğlu, 2016:17).
The basic policy is that countries should implement it. That is selling the agricultural goods and services to abroad as it is in all sectors. Exporting the raw materials with a low unit price and importing the intermediate or final goods with a high unit price damages the country's economy. Importing the raw materials and processing and then selling these products from our country are a good situation for economic growth and economic development.
Today's industrialized and developed countries have come to the position where they have been using the agricultural sector at the most appropriate level. Some countries have benefited from the financial strength which is gained from the sales activity of agricultural products when building their heavy industries. When the economic development processes are examined for industrialized countries, it can be seen that the contribution of agriculture sector to economy decreases day by day. But, the agricultural sector has an important part in the newly industrialized and developing countries‟ economy.
USA, Netherlands, Germany, Brazil and China are the World's largest exporters in the agricultural products sector. The share of these 5 countries exceeds 30% the World‟s total export of agricultural products. China, USA, Germany, Japan and France are the World‟s largest importers. These 5 countries realize the 40% of World total imports. In shortly; USA, Germany, Holland, France, China, India and Brazil which are dominating the World‟s agricultural sector. Also Indonesia, Turkey, Canada, Russia follow the leader countries in the sector. According to these situations, approximately half of the World supply and demand of agricultural products is carried out by these countries.
The Archer Daniels Midland (ADM) Company, the Bunge Company, the Cargill Company and the Louis Dreyfus Company (LDC) which are referred to ABCD Group and all of them are originated in developed countries. These four international businesses (ABCD Group) realize 75%-90% of the World cereal trade (Çakmak and Kasnakoğlu, 2016:17).
Between 2002 and 2013, agriculture-food sectors‟ foreign trade has increased approximately 3 times in the World. The source of this movement in the markets is occurred by developing countries. According to the OECD and FAO estimate that USA will increase owns export quantity and its value dominantly. Also USA‟s export is supported by its south. The export amount of Western Europe will not increase and its position as a net importer will continue. Import demand will rise because of increasing population and rise of income in Africa and Asia (OECD, 2014:61).
In the last decade, the increase in global trade has contributed by the agricultural product exports of developing countries. Between 2004 and 2013, the increase in the total agricultural product exports of developing countries was 199% that of developed countries was 135%. In this sense, global agricultural foreign trade has undergone radical changes (Çakmak and Kasnakoğlu, 2016:66).
According to the OECD‟s and FAOSTAT‟s agricultural sector reports; it is stated that the markets react to the prices of agricultural products. Because of products price are high and there is a fluctuating in the World market. As a result of this situation, the price of agricultural products will be reduced but if the demand amount to agricultural products continues strongly and if the costs of some agricultural inputs increase, it is stated that prices of agricultural products will rise to a higher level (OECD and FAOSTAT, 2014).
In 2014, the World's total foreign trade volume was 19 trillion US dollar. Agriculture-originated product export volume (agriculture, food and textiles) had created a value that was over the 2.5 trillion US dollar. This export value was equivalent to 15% of total global foreign trade. 40% of the World total exports, which was approximately 19 trillion US dollars, had been made by China, USA, Germany, Japan and Netherlands. In 2014, Turkey was ranked on 30th with a share of 1% in the World total export list (Çakmak ve Kasnakoğlu, 2016:36).
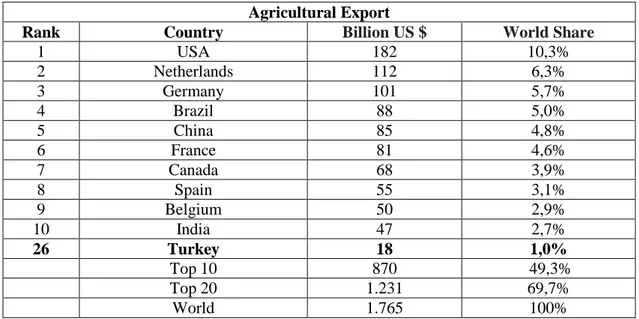
Table 2: The World Agricultural Goods and Products Export Value (Billion US $) Source: WTO, 2016.
Agricultural Export
Rank Country Billion US $ World Share
1 USA 182 10,3% 2 Netherlands 112 6,3% 3 Germany 101 5,7% 4 Brazil 88 5,0% 5 China 85 4,8% 6 France 81 4,6% 7 Canada 68 3,9% 8 Spain 55 3,1% 9 Belgium 50 2,9% 10 India 47 2,7% 26 Turkey 18 1,0% Top 10 870 49,3% Top 20 1.231 69,7% World 1.765 100%
When table 2 is examined; USA, Netherlands, Germany, Brazil and China are among the World's largest agricultural exporters countires. The share of these five countries is 32% in the total exports of agricultural products. Turkey is ranked on 26th with a share of 1% in among the exporter countries of agricultural products. The share of the top 10 largest exporters has 50%. And also the share of the top 20 largest countries reaches to 70%. The World's largest importer countries are China, USA, Germany, Japan and the UK. These five countries make 40% of the World's total imports. Turkey has 1.3% share and its rank is 17th among the World importer countries.
Table 3: The World Agricultural Goods and Products Import Value (Billion US $) Source: WTO, 2016.
Agricultural Import
Rank Country Billion US $ World Share
1 China 201 10,7% 2 USA 157 8,4% 3 Germany 119 6,3% 4 Japan 82 4,4% 5 Netherlands 76 4,0% 6 United Kingdom 75 4,0% 7 France 71 3,8% 8 Italy 63 3,4% 9 Belgium 47 2,5% 10 Russia 43 2,3% 25 Turkey 18 1,0% Top 10 933 49,8% Top 20 1.225 65,4% World 1.873 100%
When table 3 is examined; the largest agricultural importer countries are China, USA, Germany, Japan, Netherlands and UK. These six countries make approximately 38% of the World's total agricultural imports. The share of the top 10 largest and the top 20 largest importer countries respectively are 50% and 65% in agriculture imports. Turkey is ranked on 25th with a share of 1% in among the importer countries of agricultural products. Turkey is located within the first 10 countries in the World agricultural production. But Turkey remains outside the top
Table 4: The World Trade Summary (Billion US $) Source: WTO, 2016.
Country Total Export Total Import
Export of Agricultural Product Import of Agricultural Product Turkey 158 242 18 18 China 2.868 2.571 85 201 Top 5 6.881 7.019 568 565 World 18.995 19.104 1.765 1.873
When table 4 is examined; USA, China, Brazil, Germany and Netherlands are the five largest exporter countries in the World agricultural products sector. At the same time, these countries are among the largest agricultural importer countries in the sector.
1.2 The Effects of Multilateral Commercial Agreements on the World Agricultural Sector
The principles of trade agreements has started with the General Agreement on Tariffs and Trade (GATT) were based on the 1950s. Until the mid-1960s, negotiations on the necessity of applying customs tax only in industrial goods were made. Moreover, other countries joined the aggrements. The treaty renewed seven times and liberalization in the trade of industrial goods had been achieved. The Uruguay Round Trips started in the mid-1980s and this round was continued for 10 years. At the end of 10 years of negotiation, the content of the agreement or its name is round had been expanded and for the first time, the agriculture sector had been involved in multilateral trade negotiations. Protection is being implemented by developed and developing countries to agricultural commodities in the foreign trade. From the 1950s to the 1990s, developed countries supported their agriculture sector with various measures such as producer subsidies, high customs duties and non-tariff restrictions on imports. As a result of effective policies, it is necessary to sell the goods to foreign markets due to the growing agricultural sector and increasing production in USA and EU. In contrast, developing countries have taxed on export goods indirectly by adding extra taxes, by intervening in sales prices and by appling exchange rate policies. They also tried to apply low prices in agricultural and food sector in the country.
The World Trade Organization (WTO) is established in place of the GATT. WTO has carried out some actions on the agricultural sector. The WTO‟s main aim is to achieve to create an equitable and market-friendly agricultural-trade system by the general agricultural treaty.
Countries earn foreign currency from foreign trade of agriculture products. Foreign currency entry to country is provided in three ways. The first of these is agricultural products of countries are exported for to provide foreign currency to the country, the second of these is the creation of import substitution and thus to prevent the outflow of foreign currency to abroad, the third of these is as a result of the development of the industrialization based on agriculture, foreign currency entry into the country that is provided by export of raw materials and consumption goods (Deran, 2005:20).
With the work of developed countries such as the USA and the EU provide some exemptions in each area to developing countries for to accepted their general agricultural agreements. And then these countries have accomplished their aims. Now, the World has taken great steps to liberalize in the agricultural trade. With the 1990s reforms, developing countries have reduced their barriers to agricultural trade. Protectionism practices have begun to decrease with these reforms in agricultural subsidies in developed countries (Aksoy, 2005:61).
Despite the fact that many countries of the World are negotiating about on the agricultural sector, there is no clear result from these negotiations. Main reasons for not making clear decisions from negotiations are; the WTO‟s Agricultural Agreement is not able to take advantages of the level that is expected to have in the developing countries in the market. Other is the requirement of liberalization in other sectors in order to ensure that developed countries can easily access agri-food markets. Against to these situations, some countries make preferential and free trade agreements with each other, thus they increase their trade economies.
The policies that are effective governments have implemented them in the agricultural sector. Since the 20th century developed countries have protected their
1.3 The Leader Countries in the World Agriculture Sector
The leader countries are USA, EU (Germany, Netherlands, and France), China, India and Brazil in the World agricultural sector. Indonesia, Turkey, Canada and Russia are followed them. These big countries are affecting the supply and demand structure of the World agricultural sector market.
Table 5: The Selected Countries Supply and Demand Share in the World Agriculture Sector (%) Source: TIM, Agricultural Report, 2016.
Share (%) USA Germany Netherlands China India Brazil Indonesia Turkey
Agricultural GDP 5 0,7 0,5 21 8 3 3 2 Agricultural Employment 0,3 0,1 0 35 25 2 5 1 Food Agriculture Exports 10 6 6 5 3 5 3 1 Total GDP 16 4 0,1 16 7 3 4 1 Food Agriculture Import 8 6 4 11 1 0,8 1 1
When table 5 is examined; China, India and USA are the important countries in the World agriculture sector. Turkey has ranked as a last among the countries in the table. However, the economic benefits created by the agricultural sector to keep Turkey in a better position than many other countries.
1.3.1 International Organizations Operates in the World Agricultural Sector
The organizations that organize internationally also affect to the structure of the World agriculture sector. The names of the organizations that guide the World agriculture sector are given below. Turkey is situated in the collaboration with these institutions and organizations.
1) The Food and Agriculture Organization of the United Nations (FAO), 2) World Food Programme (WFP),
3) International Fund for Agricultural Development (IFAD), 4) World Trade Organization (WTO),
5) World Health Organization (WHO), 6) World Bank Group (WBG),
1.3.2 International Companies Operates in the World Agricultural Sector
The leader countries that guide the World agriculture sector are shown in table 5. Also, large firms are operating in this sector. According to the producers‟ giro in the World agriculture sector, the top 10 commercial companies are given in table 6. Giro of these top 10 companies which are in table 6 are in between 60 - 300 billion US $ in the year of 2012. Also, the total giro of these top 10 companies is 1.34 trillion US $.
These big firms work to trade in the herbal oil, mining, energy, grain, oilseed and sugar sectors. The Archer Daniels Midland Company (ADM) and Cargill Company are the World's largest agro-food trading companies among these companies. Also the Bunge Company and the Louis Dreyfus Company (LDC) which are members of the "ABCD Group" are working in the global grain trade sector. It is estimated that these four companies (Archer Daniels Midland, Bunge, Cargill and Louis Dreyfus Company) make 75%-90% of the World grain trade. ABCD group's main activity is unprocessed product trade. In other words, these companies supply raw materials to agriculture sector rather than consumption goods production. The ABCD group does not only trade agricultural products. Also the ABCD group provides inputs to food chain, it has landowner, it makes animal breeder, it produces foods, it is financiers and carriers in the sector. There are commercial activities in many countries around the World. They have 250 thousand employees and their giro exceeds 300 billion US dollar. They also gain approximately 3 billion US dollars profit. These oligopoly companies also affect market prices (Çakmak and Kasnakoğlu, 2016:19).
Table 6: The World's Largest Commodity Trading Companies Source: Szala, 2013.
Name of Company 2012 Revenue
(Billion US $) Commodities
Orijin of Company
Vitol 303 Petroleum, Gas, Mine, Sugar,
Grain, Agriculture Products
Swiss, Netherlands Glencore 236 Coal, Mineral, Petroleum, Grain Swiss
Cargill 134 Energy, Food, Biofuels, Steel, Salt USA
Trafigura 120 Energy, Mine Swiss
Koch 115 (2011) Coal, Petroleum, Petrochemical,
Forest Products and Paper USA
Mercuria 98 Energy, Natural Gas, Mine,
Biofuels Swiss
Noble 94 Energy, Mine, Grain, Oil Seed Hong Kong
Gunvor 93 Petroleum Products, Biofuels, Grain Cyprus Archer Daniels
Midland Co (ADM) 89
Oil Seeds, Corn, Wheat, Cocoa,
Transportation, Storage USA Bunge 61 Grain, Oil Seed, Sugar, Ethanol,
Seed USA
Table 7: The ABCD Company Group in the World Cereal Trade Source: Murphy, 2012. Company 2011 Sales (Billion US $) 2011 Profit (Billion US $) Working Staff Number Operational Number of Countries ADM 81 2.04 30.000 75 Bunge 59 0.94 32.000 40 Cargill 120 4.2 120.000 66 Dreyfus 60 ? 34.000 55
Another characteristic of these companies are mentioned in table 7 is the closeness to the lands. These companies are engaged in contracted agriculture and agricultural goods purchasing. In addition to these jobs, they are engaged in production activities at the some places. These firms are influencing the agro-food industry in the countries with their lobbying activities.
1.4 The Foreign Trade Problems in the World Agricultural Sector
Businesses which are dealing with foreign trade of agricultural products are bringing up sector problems on various platforms. These problems are high costs of raw materials, low returns from trade, internal savings that can be under the control of the enterprises, external savings that can not be under the control of the firms. In addition, some of the situations that are said to be problems sourced by nationally and some of them sourced by internationally.
These problems can vary the between businesses. And each problem is not as important as for every firm. Current problems in foreign trade are; uncertainty and unstability in the markets, unfair competition, non-tariff barriers, high freight, tax and transaction costs, high raw material and intermediate goods cost, not to produce products at competitive unit price, marketing and financing problems and also incentives inadequacies as known. In order to solve these problems, agricultural policies and foreign trade legislation needs to be updated.
The agricultural sector is in interaction with trade, transportation, finance, industry sectors directly and indirectly. In addition, all sectors are affected by many factors such as interest rate, exchange rate, inflation, gross wage, tax base etc.
1.5 Agricultural Products Sector in Turkey
Geographically Turkey has mountainous terrain. Because of this reason, there is a strong relationship between Turkey‟s climates feature and earth‟s shape. 24.5% of the total land which is in Turkey has 1st, 2nd and 3rd class of soil. In these three classes of soil structure, the share of agricultural land is 90% in these three classes of soil structure. 77.9 million hectares (ha) of land asset is located in Turkey. 26.3 million hectares of this land is as an agricultural area. Turkey‟s agricultural structure is based on private property and also this structure is dominated by small family businesses. The total population of Turkey has increased nevertheless there is a decrease in the population who operate in the agriculture sector. This situation shows that there is urban migration from rural areas. In the same way, the employment amount in the agricultural sector has decreased, although general employment has increased. In the last 13 years, about 2 million farmers have left their lands. The income which is gained from agriculture has increased to 62 billion TRY, but the share of agriculture has decreased in the national income. In this time period, the contribution of the agricultural sector to the national economy or income has decreased from 10.3% to 7.1%. According to the TURKSTAT‟s employment data; in 2002, the number of farmers who are gained reveneu from agriculture was 7 million
In 2012, distribution of Turkey‟s total planting area was; cereal planting area was 65.43% that was equal to 15.47 thousand hectares. Fruit planting area was 13.49% that was equal to 3.21 thousand hectares. Vegetable planting area was 3.49% that was equal to 0.83 thousand hectares. And fallow area was 17.95%. When the distribution of cultivation areas is examined; it is observed that most cereal sowing was carried out in Turkey (TURKSTAT, 2013).
Agricultural production is affected by natural conditions. Also, the agricultural sector is influenced by many external factors. These factors are; weather conditions, climate structure, size of planted area, use of technology, irrigation conditions, training and experience of employment.Demand for agricultural products is increasing due to population growth. This situation increases the production of agricultural products and agricultural-based industrial products obligatory. This indicates that the agricultural sector is a strategic sector.
The producer determines the plant and animal production plan and diversity of them according to the natural conditions. In the agricultural sector in our country, the production technique is backward, capital is limited and organization is insufficient. These conditions affect the diversity, quantity and quality of the production.
The quantity and quality of the product are important in the agriculture sector. In Turkey the efficiency is low in the production of agricultural products. Because of this reason, the country‟s needs are not supplied in the desired amount. Therefore, this product deficit is closed by import. Some factors affect productivity and sustainable production in the agricultural sector. These are socio-economic structure, education and climatic conditions (Yıldız et al., 2017:48).
The agriculture sector in Turkey is important because it meets the population's nutritional needs, provides raw materials to all of indusrty, creates big employment potential and avoids food dependency to other countries and positive contributions on the country‟s balance of payments.
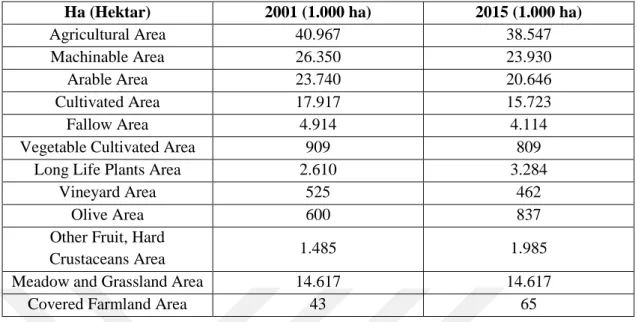
Table 8: The Agricultural Area are used in Turkey (Hectar) Source: TURKSTAT, 2016.
Ha (Hektar) 2001 (1.000 ha) 2015 (1.000 ha)
Agricultural Area 40.967 38.547
Machinable Area 26.350 23.930
Arable Area 23.740 20.646
Cultivated Area 17.917 15.723
Fallow Area 4.914 4.114
Vegetable Cultivated Area 909 809
Long Life Plants Area 2.610 3.284
Vineyard Area 525 462
Olive Area 600 837
Other Fruit, Hard
Crustaceans Area 1.485 1.985
Meadow and Grassland Area 14.617 14.617
Covered Farmland Area 43 65
Table 8 includes data about the agricultural area that are used in Turkey. According to the data; there has been no major change in agricultural area since from 2001. Areas are used for agricultural production since from 2001 to 2015, 2 million hectares declined to 38.5 million hectares. During the same period, the meadow and rangeland statistics did not change. There was a small decrease in the fallow area. The increase in fruit and olive fields attracted attention. A decline of more than 2 million hectares in the cultivated area has been compensated with an increase in fruit fields.
In 2002, planted and cultivated area in Turkey had 26 million hectares of agricultural land. It can be stated that the total agricultural area was 41 million hectares with meadow and grassland. In 2014, planted and cultivated area in Turkey had 23 million hectares of agricultural land. It can be stated that the total agricultural area was 38 million hectares with meadow and grassland. In 12 years approximately 10% of agricultural land which was planted and cultivated area disappeared, 6.4% of total agricultural land along with meadows and grassland area disappeared (TURKSTAT, 2015).
1.5.1 Developments in the Field of Agriculture after 1980s in Turkey
After 1980, in Turkey had significant improvements in the agricultural field with the decisions taken by the government. And the structure of the industry was affected by improvements. Abandonment of import substitution is important development for Turkey‟s all of sectors. In this period as well as in every sector, growth of open economy policy was implemented in agriculture sector. In this globalizing environment, countries have adopted some liberal policies to open their economies to foreign capital and investment. It was aimed to upgrade the level of development of the country with the free and open economy model that is known as ''24 January Decisions''. The decisions of January 24, 1980 were aimed to pay foreign debts and make economic growth with exports. In Turkey's economy after 1980, the most important change has been taken place in the area of foreign economic relations with other countries.
The objectives of the Decisions of January 24 were liberalization in imports and foreign trade transactions, open economy applications, entry of foreign products into the domestic market, directing international competition pressure to foreign markets, export promotion and competition of domestic products in the outer market.
Agricultural products export owned the biggest share in the total export of Turkey until 1981. However, with the January 24 Decisions, the share of non-agricultural product sectors export started to increase in the total exports. This case shows that the Decisions of the January 24 affected to the Turkey‟s agriculture sector negatively. While these situations were happening, agricultural incomes decreased because the prices of the products had been kept low in order to increase the exports.
The agricultural sector has a dependency on the natural conditions and due to the free competition approach of the market system; the agricultural sector is not included in the market conditions in any country of the World. However the free market conditions in the agricultural sector were released in 1980 in the Turkey.
There were some big differences about policies in the Turkey‟s agriculture sector between 1980s and 1990s. In the 1990s, Turkey was trying to implement the Common Agricultural Policy (CAP) principles in there which were applied in European countries. As a result of lengthy negotiations, Turkey has been joined the Customs Union on 1 January 1996. Within the scope of the Customs Union, only industrial products and processed agricultural products are exempted from customs
duties and taxes. However, traditional and unprocessed agricultural and herbal products are excluded. In the later process, Turkey continued to bring their work to fulfill the Customs Unions‟ and the European‟s CAP obligations in the field of its agriculture. However, economic problems had been encountered in Turkey. In order to solve these economic problems, ''Agricultural Reform Project'' was started with the contributions of the World Bank in Turkey. The main purpose of the implementation of the Agricultural Reform Project was to find a place in the European Agricultural Development Agreement and to get more shares from the World agricultural trade.
Also, as a result of Uruguay Round Negotiations, 125 countries agreed on the "Agricultural Agreement of World Trade Organization" which has included the standards, characteristics and future of the World agricultural sector. As a continuation of these negotiations; Seattle Conference, Doha Talks were done.
1.6 The European Union's Common Agricultural Policy’s (CAP) Importance for Turkey
The CAP of EU is important because the agricultural products sector is directly linked to nutrition and a large part of the EU‟ budget is allocated to the CAP. The CAP aims to prevent possible food shortages within the EU, to create efficiency, healthy and environmentally friendly production infrastructure and to remove the EU‟s external dependence on food sector. However, the CAP is a policy that disputes the EU countries and has the most debate among the union countries. Because of the EU‟s countries views, policies and systems are different from each other about the agricultural sector. The main objective of the EU‟s CAP is the free movement or circulation of agricultural products as well as industrial products in the union (Dinler, 1996:50).
As a result of these reforms, supports and purposes, the union members signed the Agreement on the CAP. Turkey also needs to adapt to the EU with established and concrete reforms in agriculture field. In these circumstances, various
Size of the sector, a significant portion of the Turkish society is interested in this sector and the reform process is in the CAP in the EU afftect the Turkey. Therefore, people who interested in the Turkish agricultural sector necessary to follow the practices and policies of the EU‟s agricultural sector (Bilgen, 2014:18).
1.7 Agricultural Production in Turkey
Agricultural activities are important for the survival of human beings and healthy nutrition.Agricultural products have never lost their importance because they are the main source of food that people need. And agricultural production has been one of the important fields of activity throughout history. Especially, since from the middle of the 20th century the World population has increased. Depending on this situation, the increases in food demand that shows the strategic importance of the agricultural sector for food supply. The agricultural sector is an economic sector that interests the producers and consumers (Fakıbaba, 2017:2).
The agricultural sector is separated from other sectors due to the demand characteristics of production and produced goods features. The high level of uncertainty that may occur on the production side that happan negatively affects small-scale producers.
Demands to the agricultural products are often not flexible. Unstable markets, high risks and low returns affect the market operations negatively. In addition to cover the basic food needs of the population, it is inevitable for governments to intervene in the agricultural market.
Agricultural production in Turkey exhibits a double or triple structure. There are small and large sized commercial enterprises which with high share in production and with contribution to exports.Also there are subsistence or semi-subsistence small businesses in the domestic market. They have a chance to live together in this field.
Because of the diversity of climatic and ecologic conditions provide a wide range of agricultural production in Turkey. In production, field crops such as wheat, sugar beet, barley, cotton and corn are dominant. Most of the grain products are self-sufficiency in Turkey. The production of legumes, rice, cotton and oilseeds generally does not meet domestic demand. Vegetables and fruits constitute the main items of agriculture-food exports due to excess supply. Table 9 includes the share of various agricultural commodities in the machinable area and agricultural production value.