DOI 10.12738/estp.2015.4.2514
Copyright © 2015 EDAM • http://www.estp.com.tr
Educational Sciences: Theory & Practice • 2015 August • 15(4) • 981-996
Received | April 5, 2014 Accepted | April 17, 2015 OnlineFirst | August 7, 2015
Esra Omeroglu
a Gazi UniversitySener Buyukozturk
b Hasan Kalyoncu UniversityGulumser Gultekin Akduman
g Gazi UniversityYasemin Aydogan
c Abant Izzet Baysal UniversityYunus Gunindi
h Aksaray UniversityMehtap Cakan
d Gazi UniversityOmer Kutlu
i Ankara UniversityEbru Kilic Cakmak
e Gazi UniversityAysel Coban
j Hacettepe UniversityOzlem Yurt
kKaradeniz Technical University
Arzu Ozyurek
fKarabuk University
Hakan Kogar
l Baskent UniversitySeda Karayol
mMugla Sitki Kocman University
Abstract
This study aimed to determine and interpret norms of the Preschool Social Skills Rating Scale (PSSRS) teacher form. The sample included 224 independent preschools and 169 primary schools. The schools are distributed among 48 provinces and 3324 children were included. Data were obtained from the PSSRS teacher form. The validity and reliability evidence was re-obtained from the norm sample, and it was concluded that the sample preserved the structure comprising 4 factors and 49 items. The alpha coefficient obtained from the PSSRS for the whole norm sample was determined at 0.96. PSSRS norm values were obtained for four factors and the total scale at each age. Children’s social development skills are interpreted in accordance with the percentile norms pie charts, which include the total scores from the full scale score and sub-scales. Findings obtained with regard to the validity and reliability of PSSRS scores indicated that the scale can be used as an auxiliary tool in determining children’s social skill levels. Consequently, children’s PSSRS scores should be recorded and compared to future results, and the degree of improvement should be assessed. Furthermore, each child should be evaluated individually. It is important to consider children’s ages and other developmental characteristics when interpreting the results of the scale.
Keywords: Social skill • Validity • Reliability • Norm study
Determination and Interpretation of the Norm Values of
PreSchool Social Skills Rating Scale Teacher Form
*
That a child is raised to exhibit behaviors as expected
by the society depends on social development. In
this respect, children’s social development in their
early years constitutes the basis of their future social
behaviors (Çubukçu & Gültekin, 2000). Social and
emotional development is the process of learning
the skills, approaches, and values that individuals
develop to gain social and emotional competence
(Elias et al., 1997).
The most important person in teaching social skills
is the teacher, who uses various strategies to teach
the skills necessary for establishing and maintaining
relationships with peers, self-control, adaptability
to the environment, maintaining work in a group,
coping with aggressive behaviors and stress, devising
plans, and problem solving. Teachers achieve success
in helping children internalize rules using positive
guidance techniques and becoming models of
inspiration themselves (Wortham, 1998). Furthermore,
teachers who undertake new professional roles and
responsibilities brought about by changing and
developing educational processes around the world not
only teach but also develop values, conduct research,
overcome challenges, establish interdisciplinary
relations, question, produce, and attach importance
to communication and advice. However, overall,
instructors should first engage in self-development to
teach children social skills (Çivitçi & Çivitçi, 2009).
Developing children’s personal and social as well as
academic skills is among the fundamental goals of
teachers who potently interact with children and
are responsible for teaching them basic knowledge,
skills, behaviors, and habits (Akkök, 2006).
In this process, the teacher determines objectives
with regard to social skills, checks learning groups,
determines necessary special skills for children
working together to solve problems, obtains children’s
opinions to be able to develop group work, lists social
skills to be taught in each group, and analyzes required
social skills in a particular subject. Furthermore, the
teacher observes and records children’s social skills.
Teacher behaviors constitute the basis of behavioral
examples of children with their friends in preschool
education institutions. Teachers also mold the
experiences for children to develop their speaking
skills, respect others’ rights, wait in a queue, conflict
* This study is a part of TUBİTAK KAMAG project (project number 109G047) and project coordinator is Prof.Esra Ömeroğlu.
a Prof. Esra Omeroglu (PhD), Gazi Faculty of Education, Gazi University, Ankara Turkey Email: [email protected]
b Prof. Sener Buyukozturk (PhD), Faculty of Education, Hasan Kalyoncu University, Gaziantep Turkey Email: [email protected]
c Assoc. Prof. Yasemin Aydogan (PhD), Faculty of Education, Abant İzzet Baysal University, Bolu Turkey Email: [email protected]
d Prof. Mehtap Cakan (PhD), Gazi Faculty of Education, Gazi University, Ankara Turkey Email: [email protected]
e Assoc. Prof. Ebru Kilic Cakmak (PhD), Gazi Faculty of Education, Gazi University, Ankara Turkey Email: [email protected]
f Assoc. Prof. Arzu Ozyurek (PhD), Health High School , Karabük University, Karabük Turkey Email: [email protected]
g Assoc. Prof. Gulumser Gultekin Akduman (PhD), Gazi Faculty of Education, Gazi University, Ankara Turkey Email: [email protected]
h Assist. Prof. Yunus Gunindi (PhD), Faculty of Education, Aksaray University, Aksaray Turkey Email: [email protected]
i Assist. Prof. Omer Kutlu (PhD), Faculty of Educational Sciences, Ankara University, Ankara Turkey Email: [email protected]
j Assoc. Prof. Aysel Coban (PhD), Faculty of Education, Hacettepe University, Ankara Turkey Email: [email protected]
k Assoc. Prof. Ozlem Yurt (PhD), Fatih Faculty of Education, Karadeniz Technical University, Trabzon Turkey Email: ozlemyuı[email protected]
l Corresponding author
Hakan Kogar (PhD), Faculty of Education, Başkent University, Bağlıca Kampusü Eskişehir Yolu 20. Km. An-kara 06530 Turkey
Research areas: Measurement theories; Scale development; Multivariate statistics Email: [email protected]
m Seda Karayol, Faculty of Education, Muğla Sıtkı Koçman University, Muğla Turkey Email: [email protected]
resolution, to solve social problems, and develop
empathy in oneself (Beaty, 2006, cited in Kamaraj,
2008; Şimşek, Doymuş, & Şimşek, 2008).
According to Sanders and Rivers (1996), teacher
qualifications include professional capability,
knowledge of the state of education, field knowledge,
teaching experiences, and social capabilities. In
addition, organizational planning and teaching
approaches, occupational professionalism, and social
skills have come to the fore in recent years as skills
that teachers must possess (as cited in Seven & Yoldaş,
2007). Teachers are expected to be emotionally and
socially sensitive while handling children’s social
problems and concerns (Yüksel, 2001).
Many studies have determined that social skills
training in preschool education has positive
effects on children’s social skills. In social skill
training programs, the use of modeling, guidance,
behavioral repetitions, participating, feedback,
and reinforcement skills are among behavioral
strategies for developing special social skill
reactions (Gresham, 1981, 1985; McIntosh, Vaughn,
& Zaragoza, 1991; Verduyn, Lord, & Forrest, 1990).
In addition, social skills and the quality of social
capabilities can be increased through studies aimed at
increasing social capabilities. At the preschool stage,
assessment of social skills has particular importance.
Many methods such as direct behavioral observation,
grading scales, self-assessment, and sociometry are
used in assessment of social skills (Kapıkıran, İvrendi,
& Adak, 2006). After assessment, it is possible to
try different solutions to eliminate children’s social
deficiencies and develop their social skills.
Because preschool years are the most productive time
for providing children training in social skills, the
development and effective use of measuring tools that
provide data required by instructors and educators
to guide their studies on supporting children’s social
skills gain great importance. Starting from these
necessities, the Preschool Social Skills Rating Scale
(PSSRS) was developed within the scope of the
“Preschool Social Skills Support Project” supported
by the Scientific and Technological Research Council
of Turkey (TUBITAK), and the scale was aimed to
expand its utility. The PSSRS was, in fact, developed
as two different scale forms—parent and teacher. This
research aims to reflect studies on the teacher form.
The Preschool Social Skills Rating Scale (PSSRS) was
developed for preschool children in accordance with
the Turkish culture.
This study’s objective is to discover Turkish norms
for the teacher form of the Preschool Social Skills
Rating Scale (PSSRS), developed to assess social
skills of 36–72-month-old children. With Turkish
norm values, the scale will provide information
about social skill levels by comparing children’s
development with those of peers of the same age
and gender. Thus, the PSSRS will provide valuable
data for adults and researchers.
Method
Research Group
To collect data required for the PSSRS Turkish norm
study, stratified sampling was used, and schools
were the sample units. A framework was provided
only for the pre-units (schools) through a
two-Table 1
Distribution of the Provinces and School Numbers Included in the Sample by NUTS1
Region Code Included in Provinces the Sample Sample School Number Number of Schools that Performed an Applica-tion TR1: ISTANBUL İstanbul 27 27 TR2: WESTERN MARMARA Edirne, Tekirdağ, Balıkesir 17 17 TR3: AEGEAN İzmir, Aydın,Muğ-la, Afyon, Kütahya, Uşak 53 54 TR4: EASTERN MARMARA Bursa, Bolu, Kocaeli, Eskişehir 35 35 TR5: WESTERN
ANATOLIA Ankara, Konya 32 31
TR6: MEDITERRA-NEAN Antalya, Isparta, Adana, Mer-sin, Hatay, Kahraman-maraş 47 48 TR7: CENTRAL ANATOLIA Kırıkkale, Kayseri, Niğde, Sivas, Yozgat 31 32 TR8: WESTERN BLACK SEA Karabük, Zonguldak, Amasya, Samsun 28 28 TR9: EASTERN BLACK SEA Trabzon, Ordu, Art-vin, Giresun 30 30 TRA: NORTH-EASTERN ANATOLIA Erzincan, Erzurum, Ardahan 17 17 TRB: MIDDLE EASTERN ANA-TOLIA Elazığ, Malatya, Bitlis, Van 25 25 TRC: SOUTHEAST-ERN ANATOLIA Gaziantep, Diyarbakir, Şanlıurfa, Batman, Mardin, Siirt 51 51 TOTAL 48 393 395
stage sampling method to decrease labor and cost.
Indeed, two-stage sampling is more advantageous
than other sampling methods even in estimation
results with low sensitivity (Tryfos, 1996). Schools
were grouped as independent preschools and
primary schools with nurseries. Accordingly, the
total number of schools in the research for the
2011–2012 school year is 23653, of which 22195
are primary schools and 1458 are independent
preschools. Sample size was first determined as
378 with a sensitivity of 5% and a confidence level
of 95%. Then, sample size was determined as 393,
with 15 extra schools, considering practice risks.
Schools in the sample were chosen through simple
random sampling from the school list, so that 224
are independent preschools, and 169 are primary
schools. The schools are distributed among 48
provinces. A practice was performed in all schools
included in the sample. The distribution of schools
where NUTS1 conducted the practice is shown in
Table 1. The practices began on 18 April 2012, and
ended on 8 June 2012.
The practice was performed in 168 of the planned
primary schools, but it could not be performed
in one school because of a permission problem.
The practice was applied in all 224 independent
preschools as planned, and also in three extra,
independent primary schools, considering the
risks of practice problems and that there are not
enough children at schools. Hence, the practice was
performed in 227 independent preschools in total
and 395 educational institutions in general.
A larger sample than planned was achieved thanks to
managers and teachers’ support at schools included
in the sample, and the fact that they allowed the
practice to be performed in all classes. Consequently,
2541 preschool children were reached with 450
teacher forms for 3-year-olds, 851 teacher forms for
4-year-olds, and 1240 teacher forms for 5-year-olds.
Data for 3324 children in total were obtained, with,
additionally, 738 teacher forms in preschools within
primary schools for 5-year-olds.
Of 3324 children for whom PSSRS teacher forms were
completed, 1650 are female (1264 from preschools,
386 from primary schools) and 1674 are male (1227
from preschools, 397 from primary schools).
Some items in certain forms were left blank. The
data on children for whom 10% or more of the scale
items were not completed were excluded from the
dataset. It is known that estimated values deviate
from real data at a certain rate no matter through
which method allocation is made for lost data
(Akbaş, 2014). Lost data allocation was not needed
in this study, however, because of the large sample.
Besides, frequency distributions were examined
to determine children’s change by gender and age
variables by excluding 229 children due to lost data
from the practice sample.
Table 2
Frequency Distributions of the Sample According to Age and Gender
Variable Category Whole sample(n = 3324) Last sample(n = 3095)
f % f %
Gender FemaleMale 16501674 49.650.4 15421553 49.850.2 Age
3 years 453 13.6 428 13.8
4 years 901 27.1 850 27.5
5 years 1970 59.3 1817 58.7
Table 2 demonstrates that frequency distributions
by gender and age of the sample subject to analysis
obtained by excluding lost data and the frequency
distribution of all children included in the
sample are close to each other, so the respondent
profile does not change. According to this result,
individuals excluded due to lost data do not lead to
bias related to sample profile change.
Besides, whether 229 children excluded from the
sample due to lost data cause bias in the dataset’s
findings was additionally examined using
two-way ANOVA. In the analysis, the significance
of the mutual effects of the group variable
(sub-groups with lost data and the lost data extracted)
with gender and age factors on scale scores were
observed. Two-factor ANOVA results for group*age
and group*gender are shown in Table 2.
Table 3
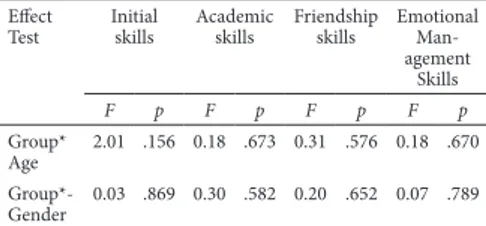
Examination of Sample Bias by Age and Gender Using ANOVA Effect
Test Initial skills Academic skills Friendship skills Emotional Man-agement Skills F p F p F p F p Group* Age 2.01 .156 0.18 .673 0.31 .576 0.18 .670 Group*-Gender 0.03 .869 0.30 .582 0.20 .652 0.07 .789
Table 3 shows that the mutual effects of
group-gender and group-age variables on all factor scores of
the PSSRS teacher form were not significant. In other
words, children excluded did not cause a difference
in gender and age levels on scale scores. Accordingly,
exclusions due to lost data did not lead to bias.
Data Collection Tools
The five-factor structure of the PSSRS teacher form,
of which the corporate framework is defined and
supported by expert opinion, was examined using
Confirmatory Factor Analysis (CFA). According
to CFA results, the five-factor structure does
not sufficiently conform to the data collected.
Examination of modification data revealed that the
fifth factor “self-control skills” and the fourth factor
“emotion management skills” are not differentiated,
and three factors (38, 39, and 42) yield a high level of
relationship among many items within factor and in
other factors. Based on expert opinion, it was decided
to re-define the item “expressing one’s emotions” (37)
in the managing emotions factor as the initial skills
factor, the “listening” skill in the initial skills factor
as “Academic Support Skills,” and the fourth and fifth
factors as “Emotion Management Skills.” Thus, a
four-factor structure with 39 items was repeated for model
data compatibility. That (χ
2/sd) among compliance
statistics remains below 5 (Sümer, 2000), that RMSEA
and RMR values are lower than .08 (Sümer, 2000), and
that even this value remains below .10 (Anderson &
Gerbing, 1984; Cole, 1987; Marsh, Balla, & McDonald,
1988) means the structure is deemed acceptable for
model data compliance. On the other hand, that CFI,
NFI, and GFI values remain above .90 is also regarded
as good compliance (Anderson & Gerbing, 1984;
Cole, 1987; Marsh, Balla, & McDonald, 1988). When
analysis results (Table 4) are examined, the RMSEA
value for the four-factor model is just above .08, which
is the acceptance limit for model data compliance,
relatively low when compared to GFI level; however
(χ
2/sd) is below 5, the RMR value is below .08, and
CFI and NFI levels are above .90. According to these
results, data compliance of the model scale consisting
of a four-factor structure is at an acceptable level,
despite not being good.
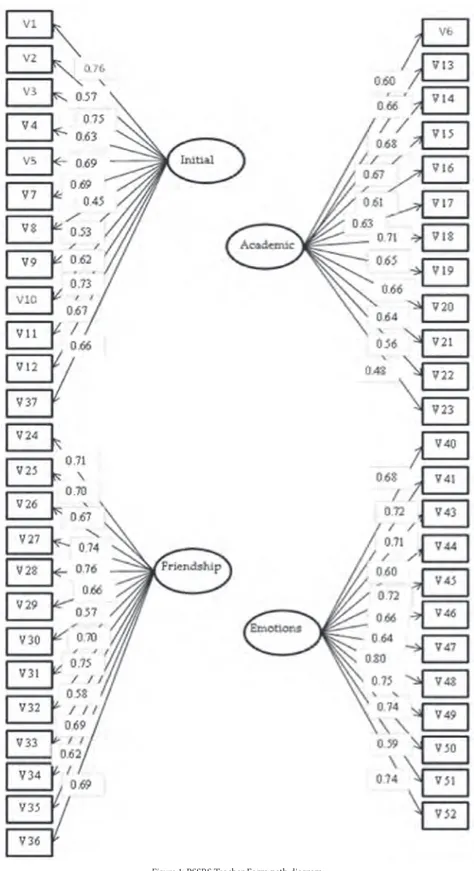
The path diagram on PSSRS four-factor structure
is shown in Figure 1, where all standardized
coefficients showing items’ relationship with their
factors are above .45. Standardized coefficients
showing the relationship between factors are shown
in Table 5.
Table 5
PSSRS Teacher Form Relationship Between Factors: Standard-ized Coefficients Factors 1 2 3 4 1. Initial -2. Academic Support .79 -3. Friendship .75 .85 -4. Managing Emotions .57 .72 .79
-Table 5 reveals a middle and high level of relationship
between factors. This result shows that the four basic
skills defined as social skills’ sub-dimensions are not
independent of one another. In this study, the scale’s
four-factor structure was re-examined based on data
obtained from the norm sample.
The scale’s psychometric properties were
re-examined using data obtained from the norm
sample. In the norm sample, the number of teacher
forms filled in is 3324. If 10% or more of scale items
were not completed, those forms were excluded
from the dataset. A single data file was obtained for
a total of 3095 children.
CFA results of the scale’s four-factor structure are
shown in Table 6.
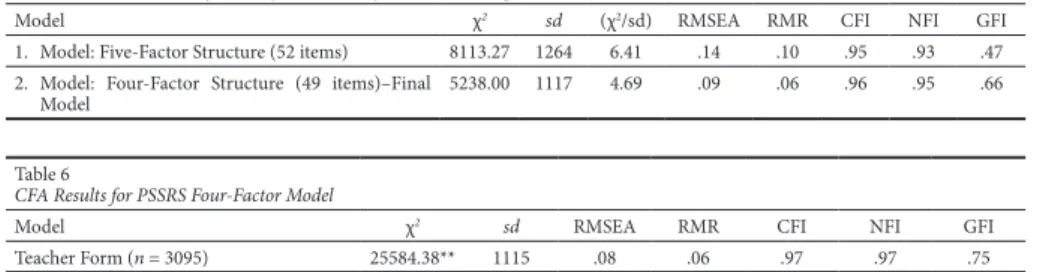
According to Table 6, the chi-square value is quite
high, increasing with increased sample size. Thus,
the calculation and interpretation of the chi-square
and accordingly calculated “χ
2/sd” value are not
meaningful, especially in very large samples.
While the GFI value in compliance statistics is low,
that RMSEA and RMR values in particular are at
acceptable limits, and that CFI and NFI values are
high shows that model data compliance is ensured
in the four-factor structure.
Table 7 displays alpha internal consistency
coefficients calculated for the scale scores’ reliability.
Table 4
PSSRS Teacher Form Confirmatory Factor Analysis Results: Compliance Statistics
Model χ2 sd (χ2/sd) RMSEA RMR CFI NFI GFI
1. Model: Five-Factor Structure (52 items) 8113.27 1264 6.41 .14 .10 .95 .93 .47 2. Model: Four-Factor Structure (49 items)–Final
Model 5238.00 1117 4.69 .09 .06 .96 .95 .66
Table 6
CFA Results for PSSRS Four-Factor Model
Model χ2 sd RMSEA RMR CFI NFI GFI
Teacher Form (n = 3095) 25584.38** 1115 .08 .06 .97 .97 .75
From Table 7, the alpha coefficients calculated from
the norm samples of the 3-year-old group range
from .88 to .96; from .90 to .97 for the 4-year-old
group; from .88 to .96 for the 5-year-old group;
and from .90 to .96 for the whole norm sample.
The PSSRS alpha coefficient obtained for the whole
norm sample was determined at .96. These results
show that the scale is reliable in terms of internal
consistency. A five-point rating scale was used for
answers to scale items, and a high score indicates
that social skills are high.
Data Analysis
PSSRS norm values were obtained for the four
factors and scale total of all ages. Norms were
created for the total score and each sub-dimension
in all age groups. Initially, we considered generating
norms for the gender variable. However, according
to two-factor ANOVA results on basic and mutual
effects of age and gender, there is significant
difference by age in social skills, but no significant
difference by mutual effect of age and gender, and
the eta-square values calculated as the effect size are
as low as .01, although no significant difference was
found between the factor scores by gender. Thus,
gender norms were not generated separately for
each age group, but only for all three age groups.
Children’s social development skills are interpreted by
percentile norm pie charts that include the total scale
score and total scores obtained from sub-dimensions.
The norm study’s objective is to determine Turkish
norm values for the scale score and to assess
children’s social skills by comparing PSSRS raw
scores and children’s norm values. Scores obtained
from the scale represent raw scores of a particular
child. Raw scores are inadequate on their own for
providing information about an individual’s status
on the measured qualification. Thus, an individual
score gains importance when it is compared to the
reference group’s values.
Without doubt, the development speed and level of
each child may differ. But by comparing children’s
raw scores and norm scores, we can consider
strategies for development of that skill and use
these strategies rather than judging the skill alone.
The percentile norm pies calculated at each
dimension for 3-, 4- and 5-year-olds on PSSRS
scores are shown below. The total score shows a raw
score in all social skills, and the score of each
sub-skill dimension shows the raw score of a particular
sub-dimension. The children’s raw scores will be
interpreted by their percentile zone. Percentile pies
will show the percentage of children in the field
of social skills by Turkish norms. The children’s
percentile zone will guide teachers and parents as to
the level of development in a particular area and the
strategies that can be taken to develop their skills.
Findings
Descriptive statistics calculated for the PSSRS total
and four-factor scores of three-year-old children
are shown in Table 8.
Descriptive statistics for the 3-year-old group are
shown in Table 8. Whether the distribution exhibits
a significant deviation from normal distribution
conditions is seen. Alpha reliability coefficients
calculated for the whole scale and its sub-skill
dimensions also look quite high (.88–.96).
Information on the percentile pies and the
interpretation of raw scores corresponding to a
particular percentile pie are provided in Appendix
1. Percentile pies were separately generated for the
total PSSRS score and each sub-skill dimension.
Descriptive statistics calculated for PSSRS total and
four-factor scores for 4-year-old children are shown
in Table 9.
Table 7
Norm Sample PSSRS Teacher Form Alpha Coefficients
Age Group Initial Skills Academic Support
Skills Friendship Skills Management SkillsEmotional Total Teacher Form
3 years (n = 444) .91 .88 .92 .92 .96
4 years (n = 833) .90 .90 .93 .92 .97
5 years (n = 1818) .89 .88 .91 .91 .96
Descriptive statistics of the 4-year-old norm group
are shown in Table 9. Although the distribution
exhibits a certain amount of deviation from normal
distribution conditions, the deviation is considered
tolerable. Alpha reliability coefficients calculated
for the whole scale and its sub-skill dimensions also
look quite high (.90–.97).
In Appendix 2 are the percentile pies of the
4-year-old norm group and the interpretation of raw
scores that correspond to a particular percentile
pie. Percentile pies were generated separately for
the PSSRS total score and each sub-skill dimension.
Descriptive statistics calculated for the PSSRS total
score and four-factor score for 5-year-old children
are shown in Table 10.
Table 8
Descriptive Statistics of the PSSRS Teacher Version Scores for Norm Sample of 3-Year-Old Children
Initial Skills Academic Support Skills Friendship Skills Management SkillsEmotional Total
Mean 44.74 44.23 48,12 38,90 46,12
Confidence interval 43.94-45.55 43.52-44.94 47.29-48.95 38.08-39.73 45.38-46.84
Standard error of the mean .41 .36 .42 .42 .37
Standard Error of Measurement 2.59 2.64 2.51 2.51 1.57
Median 45 45 49 39 47 Mode 48 45 49 36 48 Standard Variance 8.64 7.63 8.89 8.82 7.83 Variance 74.68 58.22 79.10 77.74 61.26 Skewness -.51 -.47 -.47 -.11 -.70 Kurtosis .10 .44 .14 -.35 .39 Range 48 44 49 45 41 Minimum 12 16 16 15 19 Maximum 60 60 65 60 60 Reliability (α) .91 .88 .92 .92 .96 Percentile Pies 25 40 40 43 33 42 50 45 45 49 39 47 75 51 49 54 45 52 Table 9
Descriptive Statistics of the PSSRS Total and Sub-Dimension Scores Obtained by 4-Year-Old Children
Initial Skills Academic Support Skills Friendship Skills Management SkillsEmotional Total
n 833 833 833 833 833
Mean 47.98 47.20 51.74 42.40 48.67
Confidence interval 47.45-48.51 46.69-47.72 51.17-52.32 41.83-42.98 48.21-49.14
Standard error of the mean
Standard error of measurement 2.46.27 2.38.26 2.23.29 2.39.29 1.18.24
Median 48 47 52 43 49 Mode 47 47 53 45 52 Standard Deviation 7.77 7.53 8.42 8.44 6.84 Variance 60.33 56.73 70.87 71.26 46.75 Skewness -.74 -.62 -.55 -.22 -.68 Kurtosis .90 .54 .18 .09 .58 Range 46 44 43 47 40 Minimum 14 16 22 13 20 Maximum 60 60 65 60 60 Reliability (α) .90 .90 .93 .92 .97 Percentile Pies 25 43 43 46 37 44 50 48 47 52 43 49 75 54 53 58 48 54
Descriptive statistics for the 5-year-old norm group
are shown in Table 10. While the distribution’s
sub-dimensions are tolerable, the statistics fail to fulfill
normal distribution conditions when total scale
scores are considered. Alpha reliability coefficients
calculated for the whole scale and its sub-skill
dimensions also look quite high (.88–.96).
In Appendix 3 are the percentile pies of the
5-year-old norm group and the interpretation of raw
scores that correspond to a particular percentile
pie. Percentile pies were generated separately for
the PSSRS total score and each sub-skill dimension.
Discussion
This research aimed to develop a scale that generates
valid and reliable scores for determination of children’s
social skills and to determine norms for those skills.
Findings obtained for the validity and reliability of
Preschool Social Skills Rating Scale (PSSRS) showed
that the scale can be used as an auxiliary tool for
determining children’s social skill levels.
The following aspects of use and interpretation of
results for the Preschool Social Skills Rating Scale
(PSSRS) should be carefully considered:
• PSSRS gives general information on preschool
children’s social skills.
• In application of the PSSRS, certain of its aspects
should be carefully considered.
• Activities aimed at supporting children’s social
skills should be planned by considering total
scores.
• Each child should be assessed independently.
• Paying attention to children’s ages and other
developmental characteristics is important when
interpreting scale results.
• Advancement achieved should be assessed by
recording children’s PSSRS scores and comparing
the practices in later years.
Table 10
Descriptive Statistics of PSSRS Teacher Form Total and Sub-Dimension Scores of Five-Year-Old Children
Initial Skills Academic Support Skills Friendship Skills Management SkillsEmotional Total
n 1818 1818 1818 1818 1818
Average 49.92 49.33 54.33 44.64 71.86
Confidence interval (%95) 49.59-50.25 49.02-49.65 53.99-54.66 44.27-45.01 69.54-74.18
Standard error of the mean .17 .16 .17 .19 1.18
Standard error of measurement
Median 2.3851 2.3650 2.1755 2.4145 10.1053 Mode 60 49 65 46 54 Standard Deviation 7.18 6.81 7.24 8.02 50.51 Variance 51.62 46.34 52.48 64.36 2550.80 Skewness -.78 -.70 -.61 -.32 2.03 Kurtosis .70 .61 .43 .17 2.52 Range 43 48 47 46 223 Minimum 17 12 18 14 22 Maximum 60 60 65 60 245 Reliability (α) .89 .88 .91 .91 .96 Percentile Pies 25 46 45 50 40 48 50 51 50 55 45 53 75 56 54 60 50 58
References
Akbaş, U. (2014). Farklı örneklem büyüklüklerinde ve kayıp
veri örüntülerinde ölçeklerin psikometrik özelliklerinin kayıp veri baş etme teknikleri ile incelenmesi (Doctoral
dissertation, Ankara University, Turkey). Retrieved from https://tez.yok.gov.tr/UlusalTezMerkezi/
Akkök, F. (2006). İlköğretimde sosyal becerilerin geliştirilmesi
(Anne-baba el kitabı). İstanbul: Özgür Yayınları.
Anderson, J. C., & Gerbing, D. W. (1984). The effect of sampling error on convergence, improper solutions, and goodness-of-fit indices for maximum likelihood confirmatory factor analysis. Psychometrika, 49, 155–173. Cole, D. A. (1987). Utility of confirmatory factor analysis in test validation research. Journal of Consulting and
Clinical Psychology, 55, 1019–1031.
Çivitçi, A., & Çivitçi, N. (2009). İlköğretim öğrencilerinde algılanan sosyal beceri ve mantıkdışı inançlar. İlköğretim
Online, 8(2), 415–424. Retrieved from
http://ilkogretim-online.org.tr/
Çubukçu, Z., & Gültekin, M. (2000). İlköğretimde sosyal becerilerin gerçekleşme düzeyi. In IX. Eğitim Bilimleri
Kongresi Bildiriler (Vol. 1, pp. 277–289). Erzurum.
Elias, M. J., Zins, J. E., Weissberg, R. P., Frey, K. S., Greenberg, M. T., Haynes, N. M. … Shriver, T. P. (1997). Promoting social
and emotional learning. Alexandria, VA: ASCD.
Gresham, F. M. (1981). Assessment of children’s social skills. Journal of School Psychology, 19, 120–133.
Gresham, F. M. (1985). Behavior disorder assessment: Conceptual, definitional, and practical considerations.
School Psychology Review, 14, 495–509.
Kamaraj, I. (2008). Erken çocukluk döneminde sosyal becerilerin gelişiminde öğretmenlerin rolü. Çoluk Çocuk
Dergisi, 78, 6-8.
Kapıkıran, N., İvrendi, A., & Adak, A. (2006). Okul öncesi çocuklarında sosyal beceri: Durum saptaması. Pamukkale
Üniversitesi Eğitim Fakültesi Dergisi, 19(1), 20–28.
Marsh, H. W., Balla, J. R., & McDonald, R. P. (1988). Goodness-of-fit indexes in confirmatory factor analysis: The effect of sample size. Psychological Bulletin, 103, 391–410. McIntosh, R., Vaughn, S., & Zaragoza, N. (1991). A review of social interventions for students with learning disabilities. Journal of Learning Disabilities, 24, 451–458. Seven, S., & Yoldaş, C. (2007). Sınıf öğretmeni adaylarının sosyal beceri düzeylerinin incelenmesi. Yüzüncü Yıl
Üniversitesi Eğitim Fakültesi Dergisi, 4(1), 1–18.
Sümer, N. (2000). Yapısal eşitlik modelleri: Temel kavramlar ve örnek uygulamalar. Türk Psikoloji Yazıları,
3(6) 49–74.
Şimşek, Ü., Doymuş, K., & Şimşek, U. (2008). İşbirlikli öğrenme yöntemi üzerine derleme çalışması: II. İşbirlikli öğrenme yönteminin sınıf ortamında uygulanması.
Erzincan Eğitim Fakültesi Dergisi, 10(1), 123–142.
Tryfos, P. (1996). Sampling methods for applied research. New York, NY: John Wiley and Sons.
Verduyn, C. M., Lord, W., & Forrest, G. C. (1990). Social skills training in schools: An evaluation study. Journal of
Adolescence, 13, 3–16.
Wortham, S. C. (1998). Early childhood curriculum. Virginia, VA: Prentice Hall.
Yüksel, G. (2001). Öğretmenlerin sahip olmaları gereken davranış olarak sosyal beceri. Milli Eğitim Dergisi, 150. Retrieved from http://dhgm.meb.gov.tr/yayimlar/dergiler/ Milli_Egitim_Dergisi/150/yuksel.htm
Appendix 1
Norm Pie Percentiles and Score Intervals of the 3-Year-Old Children’s Group, Definitions, and Explanations SkillPie
Per-centile IntervalScore Definition Explanation
Initial Skills
X ≥ 75 51+ The development level of the initial skills of the child is 75% or higher than the group norm.
The development in the social skills of the child is at a sufficient and expected level.
50%≤X<75% 45-50
The development level of the initial skills of the child is less than 75% and greater than or equal to 50% of the group norm. Social skills development of the child is a bit slower than their peers. Although there is no problem in general, new/additional education opportunities should be provid-ed to develop these skills and the child should be period-ically monitored.
25%≤X<50% 40-44
The development level of the initial skills of the child is less than 50% and greater than or equal to 25% of the group norm. Social skills development of the child is slower than their peers, and the development of these skills should be supported with new/additional education opportunities. The child should be constantly monitored.
X < 25% 0-39
The development level of the initial skills of the child is less than 25% of the group norm. Social skills development of the child is quite slower than their peers. Development of these skills should be supported by new and additional education opportunities. Parents should cooperate closely on this subject. The child should be constantly monitored.
Academic Support Skills
X ≥ 75% 49+ The development level of the academic skills of the child is 75% or higher than the group norm.
The development in the social skills of the child is at a sufficient and expected level.
50%≤X<75% 45-48
The development level of the academic skills of the child is less than 75% and greater than or equal to 50% of the group norm. Social skills development of the child is a bit slower than their peers. Although there is no problem in general, new/additional education opportunities should be provided for the development of these skills. The child should be periodically monitored.
25%≤X<50% 40-44
The development level of the academic skills of the child is less than 50% and greater than or equal to 25% of the group norm. Social skills development of the child is slow-er than their peslow-ers. The development of these skills should be supported with new/additional education opportuni-ties. The child should be constantly monitored. X < 25% 0-39
The development level of the academic skills of the child is less than 25% of the group norm. Social skills development of the child is quite slower than their peers. Development of these skills should be supported with new and additional edu-cation opportunities. Parents should cooperate closely on this subject. The child should be constantly monitored.
Friendship Skills
X ≥ 75% 54+ The development level of the friendship skills of the child is 75% or higher than the group norm.
The development in the social skills of the child is at a sufficient and expected level.
50%≤X<75% 49-53
The development level of the friendship skills of the child is less than 75% and greater than or equal to 50% of the group norm. Social skills development of the child is a bit slower than their peers. Although there is no problem in general, new and additional education opportunities should be provided for the development of these skills. The child should be periodically monitored.
25%≤X<50% 43-48
The development level of the friendship skills of the child is less than 50% and greater than or equal to 25% of the group norm. Social skills development of the child is slow-er than their peslow-ers. Development of these skills should be supported with new and additional education opportuni-ties. The child should be constantly monitored. X < 25% 0-42
The development level of the friendship skills of the child is less than 25% of the group norm. Social skills development of the child is quite slower than their peers. Development of these skills should be supported with new/additional education opportunities. Parents should cooperate closely on this subject. The child should be constantly monitored.
Appendix 1
Norm Pie Percentiles and Score Intervals of the 3-Year-Old Children’s Group, Definitions, and Explanations SkillPie
Per-centile IntervalScore Definition Explanation
Emotional Management Skills
X ≥ 75% 45+ The development level of the emotional management skills of the child is 75% or higher than the group norm.
The development in the social skills of the child is at a sufficient and expected level.
50%≤X<75% 39-44 The development level of emotional management skills of the child is less than 75% and greater than or equal to 50% of the group norm.
Social skills develop-ment of the child is a bit slower than their peers. Although there is no problem in general, new/ad-ditional education opportunities should be provided for the development of these skills and the child should be peri-odically monitored. 25%≤X<50% 33-38
The development level of emotional management skills of the child is less than 50% and greater than or equal to 25% of the group norm. Social skills development of the child is slower than her peers, and the development of these skills should be supported with new/additional education opportunities. The child should be constantly monitored.
X < 25% 0-32
The development level of emotional management skills of the child is less than 25% of the group norm. Social skills development of the children is a quite slower than their peers. Development of these skills should be supported with new and additional education opportunities. The par-ents should be closely cooperated on this subject. The child should be constantly monitored.
Total
X ≥ 75% 52+ The development level of the social skills of the child in general is 75% or higher than the group norm.
The development in the social skills of the child is at a sufficient and expected level.
50%≤X<75% 47-51
The development level of the social skills of the child in general is less than 75% and greater than or equal to 50% of the group norm. Social skills development of the child is a bit slower than their peers. Although there is no problem in general, new/additional education opportunities should be provided for the development of these skills and the child should be periodically monitored.
25%≤X<50% 42-46
The development level of the social skills of the child in general is less than 50% and greater than or equal to 25% of the group norm. Social skills development of the child is slower than their peers. The development of these skills should be supported with new/additional education op-portunities. The child should be constantly monitored. X< 25% 0-41
The development level of the social skills of the child in general is less than 25% of the group norm. Social skills development of the child is quite slower than their peers. Development of these skills should be supported with new and additional education opportunities. The parents should cooperate closely on this subject. The child should be constantly monitored.
Appendix 2
Norm Pie Percentiles and Score Intervals of the 4-Year-Old Children’s Group, Definitions and Explanations
Skill Pie Percentile Score Definition Explanation
Initial Skills
X ≥ 75% 54+ The development level of the initial skills of the child is 75% or higher than the norm group. The development in the social skills of the child is at a sufficient and expected level.
50%≤X<75% 48-53
The development level of the initial skills of the child is lower than 75% and greater than or equal to 50% of the group norm. Social skills development of the child is a bit slower than their peers. Although there is no problem in general, new/additional education opportunities should be provided for the develop-ment of these skills and the child should be period-ically monitored.
25%≤X<50% 43-47
The development level of the initial skills of the child is less than 50% and greater than or equal to 25% of the group norm. Social skills development of the child is slower than their peers. Development of these skills should be supported with new and addi-tional education opportunities. The child should be constantly monitored.
X<25% 0-42
The development level of the initial skills of the child is less than 25% of the group norm. Social skills development of the child is quite slower than their peers. Development of these skills should be supported with new/additional education oppor-tunities. Parents should cooperate closely on this subject. The child should be constantly monitored.
Academic Support Skills
X ≥ 75% 53+ The development level of the academic skills of the child is 75% or higher than the group norm. The development in the social skills of the child is at a sufficient and expected level.
50%≤X<75% 47-52
The development level of the academic skills of the child is less than 75% and greater than or equal to 50% of the group norm. Social skills development of the child is a bit slower than their peers. Although there is no problem in general, new/additional ed-ucation opportunities should be provided for the development of these skills and the child should be periodically monitored.
25%≤X<50% 43-46
The development level of the academic skills of the child is less than 50% and greater than or equal to 25% of the group norm. Social skills development of the child is slower than their peers. Development of these skills should be supported with new/addi-tional education opportunities. The child should be constantly monitored.
X < 25% 0-42
The development level of the academic skills of the child is less than 25% of the group norm. Social skills development of the child is quite slower than their peers. Development of these skills should be supported with new/additional education oppor-tunities. Parents should cooperate closely on this subject. The child should be constantly monitored.
Friendship Skills
X ≥ 75% 58+ The development level of the friendship skills of the child is 75% or higher than the group norm. The development in the social skills of the child is at a sufficient and expected level.
50%≤X<75% 52-57
The development level of the friendship skills of the child is lower than 75% and greater than or equal to 50% of the group norm. Social skills development of the child is a bit slower than their peers. Although there is no problem in general, new/additional ed-ucation opportunities should be provided for the development of these skills and the child should be periodically monitored.
25%≤X<50% 46-51
The development level of the friendship skills of the child is lower than 50% and greater than or equal to 25% of the group norm. Social skills development of the child is slower than their peers. Development of these skills should be supported with new/addi-tional education opportunities. The child should be constantly monitored.
X < 25% 0-45
The development level of the friendship skills of the child is less than 25% of the group norm. Social skills development of the child is quite slower than their peers. Development of these skills should be supported with new/additional education oppor-tunities. Parents should cooperate closely on this subject. The child should be constantly monitored.
Appendix 2
Norm Pie Percentiles and Score Intervals of the 4-Year-Old Children’s Group, Definitions and Explanations
Skill Pie Percentile Score Definition Explanation
Emotional Management Skills
X ≥ 75% 48+ The development level of the emotional manage-ment skills of the child is 75% or higher than the group norm.
The development in the social skills of the child is at a sufficient and expected level.
50%≤X<75% 43-47
The development level of emotional management skills of the child is less than 75% and greater than or equal to 50% of the group norm. Social skills development of the child is a bit slower than their peers. Although there is no problem in general, new/additional education opportunities should be provided for the development of these skills and the child should be periodically monitored. 25%≤X<50% 37-42
The development level of emotional management skills of the child is less than 50% and greater than or equal to 25% of the group norm. Social skills de-velopment of the child is slower than their peers. Development of these skills should be supported with new/additional education opportunities. The child should be constantly monitored.
X<25% 0-36
The development level of emotional management skills of the child is less than 25% of the group norm. Social skills development of the child is quite slower than their peers. Development of these skills should be supported with new/additional education oppor-tunities, and the parents should cooperate closely on this subject. The child should be constantly moni-tored.
Total
X ≥ 75% 54+ The development level of the social skills of the child in general is 75% or higher than the norm group. The development in the social skills of the child is at a sufficient and expected level.
50%≤X<75% 49-53
The development level of the social skills of the child in general is less than 75% and greater than or equal to 50% of the group norm. Social skills development of the child is a bit slower than their peers. Although there is no problem in general, new/additional ed-ucation opportunities should be provided for the development of these skills and the child should be periodically monitored.
25%≤X<50% 44-48
The development level of the social skills of the child in general is less than 50% and greater than or equal to 25% of the group norm. Social skills development of the child is slower than their peers. Development of these skills should be supported with new/addi-tional education opportunities. The child should be constantly monitored.
X < 25% 0-43
The development level of the social skills of the child in general is less than 25% of the group norm. Social skills development of the child is quite slower than their peers. Development of these skills should be supported with new/additional education oppor-tunities. Parents should cooperate closely on this subject. The child should be constantly monitored.
Appendix 3
Norm Pie Percentiles and Score Intervals of the 4-Year-Old Children’s Group, Definitions and Explanations
Skill Pie Percentile Score Definition Explanation
Initial Skills
X ≥ 75% 56+ The development level of the initial skills of the child is 75% or higher than the group norm. The development in the social skills of the child is at a sufficient and expected level.
50%≤X<75% 51-55
The development level of the initial skills of the child is less than 75% and greater than or equal to 50% of the group norm. Social skills development of the child is a bit slower than their peers. Although there is no problem in general, new/additional education opportunities should be provided for the develop-ment of these skills and the child should be period-ically monitored.
25%≤X<50% 46-50
The development level of the initial skills of the child is less than 50% and greater than or equal to 25% of the group norm. Social skills development of the child is slower than their peers. Development of these skills should be supported with new/addi-tional education opportunities. The child should be constantly monitored.
X < 25% 0-45
The development level of the initial skills of the child is less than 25% of the group norm. Social skills development of the child is quite slower than their peers. Development of these skills should be supported with new/additional education oppor-tunities. Parents should cooperate closely on this subject. The child should be constantly monitored.
Academic Support Skills
X ≥ 75% 54+ The development level of the academic skills of the child is 75% or higher than the group norm. The development in the social skills of the child is at a sufficient and expected level.
50%≤X<75% 50-53
The development level of the academic skills of the child is less than 75% and greater than or equal to 50% of the group norm. Social skills development of the child is a bit slower than their peers. Although there is no problem in general, new/additional ed-ucation opportunities should be provided for the development of these skills and the child should be periodically monitored.
25%≤X<50% 45-49
The development level of the academic skills of the child is less than 50% and greater than or equal to 25% of the group norm. Social skills development of the child is slower than their peers. Development of these skills should be supported with new/addi-tional education opportunities. The child should be constantly monitored.
X < 25% 0-44
The development level of the academic skills of the child is less than 25% of the group norm. Social skills development of the child is quite slower than their peers. Development of these skills should be supported with new/additional education oppor-tunities. Parents should cooperate closely on this subject. The child should be constantly monitored.
Friendship Skills
X ≥ 75% 60+ The development level of the friendship skills of the child is 75% or higher than the group norm. The development in the social skills of the child is at a sufficient and expected level.
50%≤X<75% 55-59
The development level of the friendship skills of the child is less than 75% and greater than or equal to 50% of the group norm. Social skills development of the child is a bit slower than their peers. Although there is no problem in general, new/additional ed-ucation opportunities should be provided for the development of these skills and the child should be periodically monitored.
25%≤X<50% 50-54
The development level of the friendship skills of the child is less than 50% and greater than or equal to 25% of the group norm. Social skills development of the child is slower than their peers. Development of these skills should be supported with new/addi-tional education opportunities. The child should be constantly monitored.
X < 25% 0-49
The development level of the friendship skills of the child is less than 25% of the group norm. Social skills development of the child is quite slower than their peers. Development of these skills should be supported with new/additional education oppor-tunities. Parents should cooperate closely on this subject. The child should be constantly monitored.
Appendix 3
Norm Pie Percentiles and Score Intervals of the 4-Year-Old Children’s Group, Definitions and Explanations
Skill Pie Percentile Score Definition Explanation
Emotional Management Skills
X ≥ 75% 50+ The development level of the emotional manage-ment skills of the child is 75% or higher than the group norm.
The development in the social skills of the child is at a sufficient and expected level.
50%≤X<75% 45-49
The development level of emotional management skills of the child is less than 75% and greater than or equal to 50% of the group norm. Social skills development of the child is a bit slower than their peers. Although there is no problem in general, new/additional education opportunities should be provided for the development of these skills and the child should be periodically monitored. 25%≤X<50% 40-44
The development level of emotional management skills of the child is less than 50% and greater than or equal to 25% of the group norm. Social skills de-velopment of the child is slower than their peers. Development of these skills should be supported with new/additional education opportunities. The child should be constantly monitored.
X < 25% 0-39
The development level of emotional management skills of the child is less than 25% of the group norm. Social skills development of the child is quite slower than their peers. Development of these skills should be supported with new/additional education oppor-tunities. Parents should cooperate closely on this subject. The child should be constantly monitored.
Total
X ≥ 75% 58+ The development level of the social skills of the child in general is 75% or higher than the group norm. The development in the social skills of the child is at a sufficient and expected level.
50%≤X<75% 53-57
The development level of the social skills of the child in general is less than 75% and greater than or equal to 50% of the group norm. Social skills development of the child is a bit slower than their peers. Although there is no problem in general, new/additional ed-ucation opportunities should be provided for the development of these skills and the child should be periodically monitored.
25≤ X <50 48-52
The development level of the social skills of the child in general is less than 50% and greater than or equal to 25% of the group norm. Social skills development of the child is slower than their peers. Development of these skills should be supported with new/addi-tional education opportunities. The child should be constantly monitored.
X < 25% 0-47
The development level of the social skills of the child in general is less than 25% of the group norm. Social skills development of the child is quite slower than their peers. Development of these skills should be supported with new/additional education oppor-tunities. Parents should cooperate closely on this subject. The child should be constantly monitored.