Doğuş Üniversitesi Dergisi, 18 (2) 2017, 85-96
(1)Gebze Teknik Üniversitesi, İktisat Bölümü; [email protected]
(2)Gebze Teknik Üniversitesi, Sosyal Bilimler Enstitüsü; [email protected] (3)Gebze Teknik Üniversitesi, Strateji Bilimi; [email protected]
(4)Sabancı Üniversitesi, Yönetim Bilimleri Fakültesi; [email protected]; Geliş/Received: 06-10-2017, Kabul/Accepted: 13-10-2017
Investment Valuation Analysis with Artificial Neural Networks
Yapay Sinir Ağları ile Yatırım Değerlemesi AnaliziHüseyin İNCE(1), Kadir SAYIM(2), Salih Zeki İMAMOĞLU(3), Nihat KASAP(4)
ABSTRACT: This paper shows that discounted cash flow and net present value, which are traditional investment valuation models, can be combined with artificial neural network model forecasting. The main inputs for the valuation models, such as revenue, costs, capital expenditure, and their growth rates, are heavily related to sector dynamics and macroeconomics. The growth rates of those inputs are related to inflation and exchange rates. Therefore, predicting inflation and exchange rates is a critical issue for the valuation output. In this paper, the Turkish economy’s inflation rate and the exchange rate of USD/TRY are forecast by artificial neural networks and implemented to the discounted cash flow model. Finally, the results are benchmarked with conventional practices.
Keywords: Artificial neural networks, Investment valuation, Forecasting, Inflation rate forecast, Exchange rate forecast, Discounted cash flow
JEL Classifications: C53, E47, G32
Öz: Bu çalışmada geleneksel yatırım değerleme metotlarından olan indirgenmiş
nakit akım ve net bugünkü değer modeli ile yapay sinir ağları modelinin tahmin etme özelliğinin birleştirilmesi analiz edilmiştir. Değerleme modellerinin temel bileşenlerinden olan satış gelirleri, maliyetler, yatırım harcamaları ve bunların yıllar içerisindeki büyüme oranları sektörel dinamikler ve makroekonomik faktörlerle yakından ilişkilidir. Bununla birlikte, enflasyon oranı ve döviz kurları bu bileşenlerin değişim oranlarını etkilemektedir. Dolayısıyla enflasyon oranını ve döviz kurlarını tahmin etmek değerlemenin sonucu açısından kritik bir önem taşımaktadır. Bu çalışmada Türkiye enflasyonu ve USD/TRY döviz kuru yapay sinir ağları modeli ile tahmin edilmiş ve bu değişkenler indirgenmiş nakit akım modeli içerisine yerleştirilmiştir. Bu modelin sonuçları geleneksel yöntemler ile karşılaştırılmıştır.
Anahtar Kelimeler: Yapay sinir ağları, Yatırım değerlemesi, Tahmin etme, Enflasyon oranı tahmini, Döviz kuru tahmini, İndirgenmiş nakit akım
1. Introduction
Investments are important tools for companies that can be used to achieve sustainable development and profitable growth. Firms make investments to improve their profitability chances (Dixit and Pindyck, 1995). More or less in every sector, investment and improvement decisions affect companies' future operational and financial performance. For that reason, Myers (1974) stated that corporate finance and investment decisions have many junction points. Even though investments are one of the main drivers of profitability, the investment decision is not easy due to
86 Hüseyin İNCE, Kadir SAYIM, Salih Zeki İMAMOĞLU, Nihat KASAP
uncertainty. For instance, investments related to natural resources include a high potential for uncertainty because of price volatilities and the relative difficulty of establishing valuations for these kinds of investments (Brennan and Schwartz, 1985). Therefore, these uncertainty conditions create barriers to investment and the challenge of determining an estimated valuation results in hesitation. To reduce uncertainty, forecasting investment conditions and inputs is just as important as sound investment management.
Investment valuation models are used to obtain sufficient information for decision makers. Discounted cash flow (DCF) is traditionally the most used investment valuation method. Myers (1974) and Brigham and Houston (2004) stated that the DCF model is the most common valuation technique. If DCF is applied to an investment project, the method discounts expected future cash flows to the present; these cash flows are generated after operations such as revenues, costs, capital expenditures, and net working capital changes and are used to calculate the net present value (NPV) of the investment. Despite being the most common valuation method, DCF has some disadvantages which are mostly related to uncertainty conditions and the rigidity of the model itself. Liao and Ho (2010) argued that DCF has two major drawbacks. The first is that cash flows cannot be precisely predicted in uncertain decision-making conditions and the second is that the valuation of managerial flexibilities in investments is not reflected in DCF analysis. Thus, both reasons may misdirect the decision maker. Moreover, Carlsson and Fuller (2003) stated that the difficulty of predicting cash flows and discount ratios makes DCF inadequate in uncertain market conditions. In the literature, several works also emphasize this topic, including Garvin and Cheeah (2004) and Dixit and Pindyck (1995).
The outputs of DCF are projected time period cash flows, which consist of sub-financial inputs such as revenue, cost, capital expenditure and net working capital exchange. Those main inputs for the valuation models are related to sector dynamics and macroeconomics. For instance, revenue is dictated by sales quantity and price, and sales price forecasts are usually formulated with an inflation rate. Moreover, cost forecasts after the base year generally increase by the inflation rate. On the other hand, several cost items, capital expenditures, and export revenues are affected by exchange rate developments. For that reason, for multinational firms in the investment decision process, being able to accurately forecast exchange rate movements can result in substantial improvements in the overall profitability of an investment. Because of the nature of multinational businesses, a significant portion of their revenue, costs and capital expenditures is related to a currency other than their local currency.
In recent decades, the artificial neural network (ANN) model has been one of the artificial intelligence models used for forecasting time series including exchange rates and inflation rates, as mentioned in sections 2 and 4 of this paper. The ANN model involves computer-based simulation of the human neural system (Lubecke et al., 1998). An artificial neuron is similar to a biological neuron and is capable of benchmarking values and mathematical operations (Mukherjee & Biswas, 1997). The ANN model imitates the human brain's classifying, describing, and forecasting skills (Hamzaçebi et al., 2009). Therefore, the term neural network is based on biological connections between neurons in the human brain. ANN has strong pattern classification and perception skills, which enables the model to learn by gaining
Investment Valuation Analysis with Artificial Neural Networks
87 experience and by generalizing. For that reason, this model is used frequently in industry, finance, business, and scientific works.The paper is structured as follows: Section 2 provides a review of the literature in this area. Sections 3 and 4 provide a general description of the DCF and ANN. Section 5 describes the proposed methodology and data preparation and shows the results for the proposed model. Conclusions are discussed in Section 6.
2. Literature Review
DCF is the conventional method most used in investment valuation techniques. It is well structured and easy to apply. Therefore, it is an essential tool for firms for both evaluating and selecting investment projects. Despite its frequent use in practice, recent studies have mentioned drawbacks of DCF in uncertain conditions and offered hybrid or new approaches. Garvin and Cheeah (2004) reported that under stable economic conditions and predictable risks, NPV analysis works quite well, but, on the other hand, the rigid framework of the traditional DCF and NPV methods is not suitable for projects that contain several uncertain conditions, such as infrastructure investments. Therefore, they used the traditional cash flow framework with a real options-based approach to investment valuation analysis. Liao and Ho (2010) mentioned that DCF inputs such as cash flows and discount rates are difficult to estimate and, because of using past data for reference in the DCF method, innovative investment project valuation using this method may mislead decision makers. For that reason, they offered a fuzzy real option approach.
If more than one investment project is on the table, NPV and internal rate of return (IRR) help decision makers, as the investment project with the maximum positive NPV and higher IRR is the most suitable investment project. However, all relevant cash flows and interest rates, which are the main content of the DCF, must be known in advance and it is very difficult to forecast the cash flows and interest rates of the future. Moreover, the NPV method’s ability to cope with strategic issues and maintain managerial flexibility (e.g., expand, abandon, postpone) is constrained and thus Ozogul et al. (2009) proposed a binomial real options-based valuation framework and benchmarked with the conventional NPV method. Carlsson and Fuller (2003) argued that traditional valuation models such as NPV and DCF have been developed because of the uncertainty of options. They offered a fuzzy approach to real option valuation and suggested that their proposed model may give decision makers a better understanding of the uncertainty problem.
It is obvious that DCF is a practical method but it must be modified for decision makers. ANN is one of the methods used for forecasting and input forecasting is one of the main problems in investment decisions. Therefore, ANN can be used as a forecasting tool for inputs and combined with the traditional DCF method. Many researchers prefer to use ANN to conduct their studies, not only in financial research but also in different fields such as consumption, price, cost, and technical performance. ANN is used in various financial studies and many of these studies address exchange rates and inflation rates, which are also discussed in this paper. Lubecke et al. (1998) forecast exchange rates with ANN and benchmarked with other forecasting methods. Panda and Narasimhan (2007) also worked on exchange rate forecasts with ANN. They compared the forecasting accuracy of the neural network with linear autoregressive and random walk models and found that the
88 Hüseyin İNCE, Kadir SAYIM, Salih Zeki İMAMOĞLU, Nihat KASAP
neural network has superior forecasting ability to other compared models. Hu and Tsoukalas (1999) worked on exchange forecasting of 11 different currencies in Europe and found satisfactory performance with ANN. Sermpinis et al. (2012) also worked on the EUR/USD exchange rate by using ANN. Marcellino (2004) tried to predict the European Money Union's macroeconomic variables with ANN and several forecasting models. Chen and Leung (2004) stated that exchange rate prediction is an important topic for international finance and used a hybrid model which included ANN. Taskin and Güneri (2006) discussed risky investment projects' economic analysis with multi-layered and radial basis function ANN models. Leung et al. (2000) examined the forecast of a specific neural network architecture called the general regression neural network and compared its performance to those of a variety of forecasting techniques, including multi-layered feedforward network, multivariate transfer function, and random walk models. Enke and Mehdiyev (2014) introduced a hybrid model that attempts to forecast the inflation rate with a fuzzy inference neural network.
ANN is superior to traditional methods. First, ANN is data oriented and has a learning capability via the gaining of experience. Moreover, this method can generalize. Even the hidden parts and future behaviors of the data sets are fuzzy; however, after analyzing the data sets, the model can make generalizations and clarifications. Furthermore, unlike traditional models, ANN is non-linear (Zhang et al., 1998). Thus, ANN is a valuable tool for time series forecasting. In this type of forecasting, iterative or direct methods can be used. With the iterative method, data of the forecasting period are identified from past assumptions and this output data can be used as input for the next forecasting period. Ultimately, the process consists of iterative forecasts; hence, with the direct method, output data are forecast at one time (Hamzaçebi et al., 2009). ANN's main advantages are that it is easy to use and it can approximate any input/output map and provide remarkable results. The key disadvantages are that ANN trains slowly and require lots of training data because in this process the model is learning by analyzing relations between input and output and during the process it uses mathematical models such as normalization, ordering, and correlation (Mandal et al., 2006).
3. Discounted Cash Flow
DCF is a valuation method that calculates the attractiveness and profitability of an investment. It is easy to incorporate other valuation and decision tools such as NPV and IRR into DCF outputs. Firms generally compare both NPV and IRR to decide whether or not to invest. DCF uses future cash flow projections and discounts those cash flows with a discount rate, generally called the weighted average cost of capital (WACC). Cost of capital is a ratio of the weighted average of the company’s cost of debt and its cost of equity:
𝑊𝐴𝐶𝐶 = (𝐷+𝐸)𝐷 ∗ 𝐶𝑑∗ (1 − 𝑇) + (𝐷+𝐸)𝐸 ∗ 𝐶𝑒(1)
where D and E are debt and equity ratios of financing, respectively, Cd is the cost of debt, Ce is the cost of equity, and T is the tax. Future cash flows are discounted by firms’ WACC and the sum of the total cash flows is generally discounted to present value, which yields the NPV:
Investment Valuation Analysis with Artificial Neural Networks
89𝑁𝑃𝑉 = ∑ 𝐶𝑖
(1+𝑟)𝑖− 𝐶0 𝑖
𝑖=1 (2)
NPV is the present value of the projected period’s cash flows where Ci is the net cash flow during period i, r is the discount rate, which is generally also the WACC in DCF analysis, and C0 is the total initial investment cost (Brigham & Houston, 2004). A positive NPV indicates that projected total earnings of the investment are greater than the total costs and capital expenditures. The basic rule for NPV is that only NPV projects and investments with positive results should be considered. However, if more than one project is on the table, the greater NPV result is not always logical. In this circumstance, IRR is also considered to be a decision tool. IRR is defined as the discount rate that equates the present value of a project’s cash flows to zero, where the Cs are cash flows of the periods and n represents the periods: 𝐶0+ 𝐶1 (1+𝐼𝑅𝑅)1+ 𝐶2 (1+𝐼𝑅𝑅)2+ … + 𝐶𝑛 (1+𝐼𝑅𝑅)𝑛= 0(3)
In the DCF method, the period’s projected revenues and costs are the main inputs for the cash flows. Firms estimate and calculate their revenues and costs of investment to form cash flows. Depending on the firm’s industry, inflation rates, exchange rates, real growth rates of the sector and country, market shares, and production processes are the main items of estimated revenues and costs. To sum up, firms estimate and calculate their projected cash flows and with a DCF analysis both NPV and IRR are helpful tools for the firms to decide to make or not make investments. However, as mentioned in the previous section, estimation of the future cash flows is the main difficulty for firms because several inputs are independent of the firms’ activities, such as inflation rates and exchange rates. In this paper, a new approach is recommended for cash flow estimation; the approach uses ANN to predict the inflation and exchange rates and implements these inputs into cash flows. This kind of model implementation requires several steps: selection of input variables, structuring a neural network, training the network to create a learning medium, and forecasting accurately with benchmarking as-is data.
4. Artificial Neural Networks
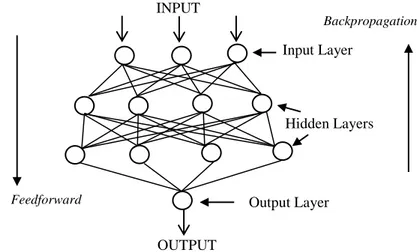
When an artificial neural network is shaped, a specific architecture must be designed. This architecture will include a number of hidden neurons and layers. Also, it is possible to define a connection between input and output vectors as part of the net. The basic structure of an ANN has an input vector, hidden neurons and layers, and an output vector. Connections between neurons are of various types. For example, the backpropagation network (BPN), radial basis function (RBF), support vector machine (SVM), self-organization map (SOM), and multilayer perceptron (MLP) are all commonly used types, while the most common type is MLP (Sermpinis et al., 2012). Multilayer perceptrons are layered feedforward networks typically trained with static backpropagation. These networks have found their way into countless applications requiring static pattern classification. MLPs are formed by one input layer, one output layer, and more than one hidden layer (Mukherjeeand Biswas, 1997); see Figure 1.
90 Hüseyin İNCE, Kadir SAYIM, Salih Zeki İMAMOĞLU, Nihat KASAP
Figure 1. Multilayer perceptrons and feedforwarding networks
In this paper, to structure the network, the feedforward artificial neural network with backpropagation is used. Selecting the number of hidden neurons is also challenging. Several formulas are available for choosing the hidden neuron number, such as:
a) N*1,5 ≤ X ≤ N*3 b) X = N*0,75
where N is the number of input data and X is the number of hidden neurons (Katz, 1992; Bailey and Thompson, 1990). However, most related studies have used the trial-and-error process for the number of hidden neurons (Palmer et al., 2006; Zhang, 2001). In this study, the trial-and-error process is used starting with 1 hidden layer and moving to 10 hidden layers to determine which one produces the best results.
5. Methodology
5.1. Input Selection
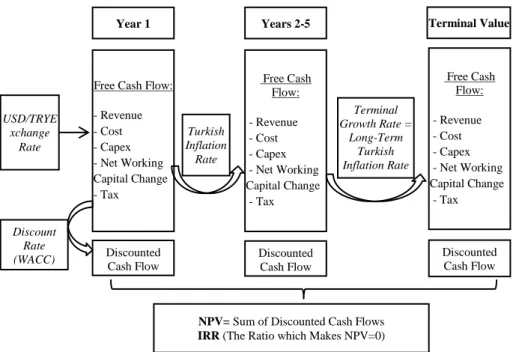
In this paper, an additional capacity investment project of a cement company in Turkey has been analyzed. The investment project’s financial yield is calculated with the traditional DCF model. To complete a full DCF analysis with NPV and IRR models for an investment decision, inputs must be clarified. Some inputs of the model, such as sales amount, are assumed by company and sector professionals because of their relation to commercial and business expertise. Current prices and cost structure are clarified and inflated onward. To sum up, one of the three main inputs is the sales amount forecast, which is driven by business expertise; other inputs are prices and cost structure, which are driven by inflation and exchange rates. For costs, capital expenditure, and export price, the USD/TRY exchange rate is used to calculate. Turkish inflation rate is used for price growth and cost growth. Both of these actual macroeconomic inputs were obtained from primary macroeconomic public sources such as the International Monetary Fund (IMF), World Bank and Turkish sources such as the Turkish Statistical Institute and Central Bank of Turkey. In addition, the Turkish inflation rate and USD/TRY exchange rate, which are the main inputs of the valuation model, are forecast with artificial neural networks, as detailed below. The DCF framework of the investment valuation and where inputs are implemented to the model are shown in Figure 2.
INPUT Input Layer Hidden Layers Output Layer OUTPUT Feedforward Backpropagation
Investment Valuation Analysis with Artificial Neural Networks
91Figure 2. Discounted cash flow framework of the investment valuation. To select input variables to forecast the Turkish inflation rate, previous related works and approaches have been employed. Somaratna et al. (2010) used gross domestic product, money supply, Treasury bill rate, and foreign exchange rate for inflation rate forecasting. Enke and Mehdiyev (2014) used seven input variables to forecast the inflation rate: industrial production index, producer price index, M1 money stock, M2 money stock, 10-year Treasury constant maturity rate, JPY/USD foreign exchange rate, and Moody's seasoned Aaa corporate bond yield. Kooths et al. (2003) used the time series of oil price changes, foreign exchange rate, and the change in energy prices, as well as Bundesbank's inflation objective to forecast future inflation rates. Romer (1992) analyzed the Great Depression and used the M1 money stock growth rate, lagged M1 growth, interest rates, and industrial production to forecast inflation rates. Moreover, Cecchetti (1992) considered nominal interest rates, growth rates of the monetary base, the M1 and M2 money stocks, and industrial production as the main variables to predict inflation rate. Dominguez et al. (1988) stated that the modern input variables used to predict inflation rates include the industrial production index, producer price index, stock price index, three-month interest rate, and a measure of money stock. As listed above, general input variables are more or less the same. In this paper, nominal interest rates, growth rates of the monetary base, the M1 and M2 money stocks, and industrial production, which Cecchetti (1992) considered, are selected as input variables to forecast the inflation rate.
Previous studies have used several different inputs for exchange rate prediction. Sarantis and Stewart (1995) used money stock M1, short-term interest rate, long-term interest rate, inflation rate, current account balance, and gross domestic product to forecast the exchange rate. Meese and Rogoff (1983) used the short-term interest
Year 1 USD/TRYE xchange Rate Years 2-5 Turkish Inflation Rate Terminal Value Terminal Growth Rate = Long-Term Turkish Inflation Rate Forecast Discount Rate (WACC) Discounted Cash Flow
NPV= Sum of Discounted Cash Flows IRR (The Ratio which Makes NPV=0)
Free Cash Flow:
- Revenue - Cost - Capex - Net Working Capital Change - Tax Discounted Cash Flow Discounted Cash Flow Free Cash Flow: - Revenue - Cost - Capex - Net Working Capital Change - Tax Free Cash Flow: - Revenue - Cost - Capex - Net Working Capital Change - Tax Terminal Value
Free Cash Flow
Discounted Cash Flow
92 Hüseyin İNCE, Kadir SAYIM, Salih Zeki İMAMOĞLU, Nihat KASAP
rate, inflation rate, trade balance, and money stock as input variables. In this paper, five input variables mentioned by Verkooijen (1996) and Weeren et al. (1997) are used.
st= f(rt,rt*,mt, mt*,ipt, ipt*, πt, πt*,TBt, TBt*)+εt (4)
s represents the logarithm of the nominal exchange rate vis-à-vis the foreign currency, r represents nominal short-term interest rate, m is the logarithm of supply money M1, ip is the logarithm of the industrial production index, π is expected inflation rate in consumer prices, and TB represents the foreign trade balance. The main two inputs, USD/TRY exchange rate and Turkish inflation rateare used to determine therelevance and accuracy of ANN in investment decision analysis, by applying them to three different models which are shown below in Figure 3.
Figure 3. Model frameworks used in the study 5.2. Experimental Results
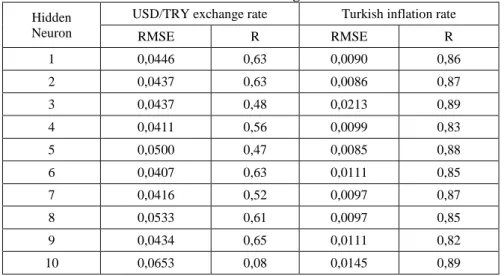
After monthly data from 1999 through 2015 were entered in the model, the training and learning phase was performed. A total of 204 data items was obtained for each input from the Turkish Statistical Institute (TUIK) and US Bureau of Economic Analysis (BEA); 123 of these data items (60%) were used for training the models, 20 for validation (10%), and the remaining 61 (30%) for testing the model. We used the trial-and-error method (Zhang, 2001; Palmer et al., 2006) to select more accurate results of the hidden neurons for each input to structure and implement them into the DCF model. The lower root mean square error (RMSE) means more efficiency and the higher R means a more correlated forecast. Table 1 shows that six hidden neurons provide the best results for the USD/TRY exchange rate forecast, and five hidden neurons provide the best results for the inflation rate forecast.
Actual Model
Actual 2011-2015 USD/TRY exchange rate and Turkish inflation rate are used for inputs such as
revenue, cost, capex.
Traditional Model DCF with ANN
For the USD/TRY exchange rate and Turkish inflation
rate forecast, 2011 IMF forecasts and macroeconomic forecasts of
the company are used.
All other inputs, such as sales quantity, sectoral dynamics, and capex amounts (other than USD/TRY exchange rate and inflation-related items) remain the same.
For the USD/TRY exchange rate and Turkish inflation rate forecast, ANN
Investment Valuation Analysis with Artificial Neural Networks
93 Table 1. RMSE results of different hidden neurons, USD/TRY exchange rateand inflation rate forecast with designed ANN framework Hidden
Neuron
USD/TRY exchange rate Turkish inflation rate
RMSE R RMSE R 1 0,0446 0,63 0,0090 0,86 2 0,0437 0,63 0,0086 0,87 3 0,0437 0,48 0,0213 0,89 4 0,0411 0,56 0,0099 0,83 5 0,0500 0,47 0,0085 0,88 6 0,0407 0,63 0,0111 0,85 7 0,0416 0,52 0,0097 0,87 8 0,0533 0,61 0,0097 0,85 9 0,0434 0,65 0,0111 0,82 10 0,0653 0,08 0,0145 0,89
In the DCF analysis, five years of cash flows were projected (2011-2015) and onwards was assumed as terminal value with terminal growth; for discounting cash flows 13.5% TRY WACC was used. In the actual model, with those structures and realized actual inputs of the projected period, the actual NPV range becomes $277-$316 million with a $296 million middle value. The IRR of the actual result is 24.6%. However, in the traditional model, outcomes of public macroeconomic sources that are well accepted by investment decision makers, such as IMF databases and/or central banks’ macroeconomic forecasts, are used for the inflation rate and USD/TRY exchange rate and the result is a $180-$202 million NPV range with a $191 million middle value, and 23.2% IRR. As seen, there is a major difference in NPV results of the models because in 2011 the long-term inflation rate forecast of the IMF for the Turkish economy was 7.0%; however, the realized inflation rate fluctuated between 6% and 10%. Moreover, the average USD/TRY exchange rate forecast based on macroeconomic sources for 2015 was around 2.0-2.1; however, the realized 2015 average USD/TRY exchange rate was around 2.7. In the DCF with ANN model, the forecast inputs from ANN were used and the NPV range was $262-$298 million with a $279 million middle value and IRR of 24.4%. As a result, these outcomes are more accurate and closer to the actual results than those based on traditional assumptions.
Table 2. NPV and IRR results of the different models
Model NPV (m$) IRR
Middle Range
Actual 296 277-316 24.6%
Traditional Assumptions 191 180-202 23.2%
94 Hüseyin İNCE, Kadir SAYIM, Salih Zeki İMAMOĞLU, Nihat KASAP
6. Conclusion
To maintain sustainable and profitable growth, firms make investments. Choosing true, logical, and, more importantly, profitable investments from among several investment options is the main challenge for firms and decision makers. Even though it is a traditional and old valuation method, DCF is the most common method for evaluating investment options. DCF is generally used with other conventional and traditional methods such as NPV and IRR. On the other hand, outcomes of the DCF consider future cash flows and predictions of cash flows are related to detailed revenue and cost analyses. Firms generally use well-known macro financial databases such as those from the World Bank, IMF, or central banks for their inputs. This input verification process is more difficult if a firm prefers to invest abroad or to invest in lesser known non-core businesses.
This paper discussed two main inputs which Turkish companies frequently use in their valuation analysis: USD/TRY exchange rate and Turkish inflation rate. Both rates are valuable inputs for DCF analysis in most industries, especially the cement sector. These inputs are forecast with the artificial neural network model and implemented in traditional valuation models such as DCF, NPV, and IRR. The main purpose of this work is to eliminate the rigidity and uncertainty associated with the traditional DCF model and to add flexibility and alternative results to that model with the forecast main inputs.
This paper demonstrates that the exchange rate and inflation rate can be forecast with artificial neural networks, and the results of the DCF with ANN provide better results than the traditional assumptions when comparing the actual results. Thus, companies can use the ANN method to forecast main inputs and implement them in their investment valuation analysis.
7. References
Bailey, D.L. & Thompson, D.M. (1990). Developing neural-network applications. AI Expert, 5, 34-41
Brennan, M.J. & Schwartz, E.S. (1985). Evaluating Natural Resource Investments. Journal of Business, 58, 135-157
Brigham E.F. & Houston, J.F. (2004). Fundamentals of financial management: 10th ed. Ohio, Thomson South-Western Publications
Carlsson, C. & Fuller, R. (2003). A fuzzy approach to real option valuation. Fuzzy Sets and Systems, 139, 297-312
Cecchetti, S. (1992). Prices during the great depression: Was the deflation of 1930-1932 really unanticipated? American Economic Review. 82, 141-156
Chen, A. & Leung, M.T. (2004). Regression neural network for error correction in foreign exchange forecasting and trading. Computers & Operations Research, 31, 1049–1068
Dixit, A.K. & Pindyck, R.S. (1995). The Options Approach to Capital Investment. Harvard Business Review, May-June, 105-115
Dominguez, K.M., Fair, R.C. & Shapiro, M.D. (1988). Forecasting the depression: Harvard versus Yale. American Economic Review, 78, 595-612
Enke, D. & Mehdiyev, N. (2014). A hybrid neuro-fuzzy model to forecast inflation. Procedia Computer Science. 36, 254-260
Investment Valuation Analysis with Artificial Neural Networks
95 Garvin, M.J. & Cheeah C.Y.J. (2004). Valuation techniques for infrastructureinvestment decisions. Construction Management and Economics, 22, 373-383 Hamzaçebi, C., Akay, D. & Kutay, F. (2009). Comparison of direct and iterative
artificial neural network forecast approaches in multi-periodic time series forecasting. Expert Systems with Applications, 36, 3839-3844
Hu, M.Y. & Tsoukalas, C. (1999). Combining conditional volatility forecasts using neural networks: an application to the EMS exchange rates. Journal of International Financial Markets, Institutions and Money, 9, 407–422
Katz, J.O. (1992). Developing neural network forecasters for trading. Technical Analysis of Stocks and Commodities, 10, 160–168
Kooths, S., Mitze, T. & Ringhut, E. (2003). Inflation forecasting - a comparison between econometric methods and a computational approach based on genetic-neural fuzzy rule-bases. Computational Intelligence for Financial Engineering, 1, 183-190.
Leung, M.T., Chen, A. & Daouk, H. (2000). Forecasting exchange rates using general regression neural networks.Computers & Operations Research, 27, 1093-1110
Liao, S.H. & Ho, S.H. (2010). Investment project valuation based on a fuzzy binomial approach. Information Sciences, 180, 2124-2133.
Lubecke, T.H., Kwok, C.C.Y., Markland, R.E. & Nam, K.D. (1998). Combining foreign exchange rate forecasts using neural networks. Global Finance Journal, 9, 5-27
Mandal, P., Senjyu, T. & Toshihisa, F. (2006). Neural networks approach to forecast several hour ahead electricity prices and loads in deregulated market. Energy Conversion and Management, 47, 2128–2142
Marcellino, M. (2004). Forecasting EMU macroeconomic variables. International Journal of Forecasting, 20, 359– 372
Meese R. & Rogoff, K. (1983). Exchange rate models of the seventies: do they fit out of sample. Journal of International Economics, 14, 3-24.
Mukherjee, A. & Biswas, S.N. (1997). Artificial neural networks in prediction of mechanical behavior of concrete at high temperature. Nuclear Engineering and Design, 178, 1–11
Myers, S.C. (1974). Interactions of corporate financing and investment decisions- implications for capital budgeting. The Journal of Finance. 29, 1-25
Ozogul, O., Karsak, E. & Tolga, E. (2009). A real options approach for evaluation and justification of a hospital information system. The Journal of Systems and Software, 82, 2091–2102
Palmer, A., Montano, J.J. & Sese, A. (2006). Designing an artificial neural network for forecasting tourism time series. Tourism Management, 27, 781-790
Panda, C. & Narasimhan, V. (2007). Forecasting exchange rate better with artificial neural network. Journal of Policy Modeling, 29, 227–236
Romer, C. (1992). What ended the great depression. Journal of Economic History. 52, 757-784
Sarantis N., & Stewart C. (1995). Monetary and asset market models for sterling exchange rates: a cointegration approach. Journal of Economic Integration, 10, 335-371.
Sermpinis, G., Dunis, C., Laws, J. & Stasinakis, C. (2012). Forecasting and trading the EUR/USD exchange rate with stochastic Neural Network combination and time varying leverage. Decision Support Systems, 54, 316-329
Somaratna, P.E., Arunatilaka, S. & Premarathna, L. (2010). Which is better for inflation forecasting. Neural Networks or Data Mining. 1, 116-121.
96 Hüseyin İNCE, Kadir SAYIM, Salih Zeki İMAMOĞLU, Nihat KASAP
Taskin, A. & Güneri, F. (2006). Economic analysis of risky projects by ANNs. Applied Mathematics and Computation, 175, 171–181
Verkooijen, W. (1996). A neural network approach to long-run exchange rate prediction. Computational Economics, 9, 51-65
Weeren, A.J.T.M., Dumortier, F., & Plasmans, J.E.J (1997). Exchange rate modeling by multivariate nonlinear cointegration analysis using artificial neural networks. SESO Working Papers 1997003, University of Antwerp, Applied Economy of Sciences
Zhang, G., Hu, M.Y., & Patuwo, B.E. (1998). Forecasting with artificial neural networks: The state of the art. International Journal of Forecasting, 14, 35–62 Zhang, G.P. (2001). An investigation of neural networks for linear time-series