Numerical Evaluation of the Habit of Seatbelt Use of Erzurum Province
Casim YAZICI1
1Agri Ibrahim Cecen University, Department of Construction, Division of Construction Inspection, Agrı, Turkey [email protected]
Abstract
Solutions are being sought in order to prevent accidents involving deaths and injuries that are the result of traffic accidents in the world. Among these solutions, the seatbelt has been one of the simplest, least cost effective and most efficient vehicles.The use of seatbelt plays an important role in reducing the risk of death and injury as a result of a traffic accident. Although it is mandatory to use seatbelt both in the world and in our country, its use rate is quite low in Turkey. Turkey is among the countries constituting almost half of the number of fatal accidents in the world. Traffic accidents should be considered as a priority in the public health agenda in terms of frequency, health and economic consequences of traffic accidents.The geographical structure, climatic conditions and existing roads in Erzurum constitute negativities in terms of traffic safety. The habit of using the seatbelts of the drivers is determined by observations in parallel with this consciousness. Observations were made on state highway numbered E80. In the observations conducted during the week and weekend, morning and evening observations, the habit of seatbelt use of drivers and front seat passengers were determined. In addition, vehicle types, gender and age variables were also observed.As a result, in accordance with the information obtained, the use of seatbelt was evaluated according to age, gender and vehicle types.
Keywords: Seatbelt, traffic safety, traffic accident, Erzurum.
Received: 16.04.2019 Revised: 22.10.2019 Accepted: 04.11.2019
Cite this article as: C. Yazıcı, Numerical Evaluation of the Habit of Seatbelt Use of Erzurum Province, Eastern Anatolian Journal of Science, Vol. 5, Issue 2, 40-49, 2019.
Introduction
Traffic safety records of Turkey has been discussed for years.Different values and incomplete interpretations often make it difficult to make accurate determinations.The number of accidents occurring in our country in the last decade is almost fifty percent more compared to the number of traffic accidents occurring in the last thirty years. Accordingly, the number of deaths and injuries have increased significantly. With the rapidly increasing population and the increase in the number of vehicles in traffic, there has been a great increase in traffic accidents over the last decade.A higher rate of death and injuries is inevitable when traffic accidents are so high.When the accident statistics are analyzed, the single vehicle accidents are at the top. This directly throws the book at the driver.As traffic accidents are directly person-oriented, this is combined with person's lack of education, individual or environmental errors, resulting in this.In this study, the rate of the usage of the seat belt which reduces the deaths and injuries in accidents is revealed with statistics conducted in different years in the province of Erzurum.
Due to the fact that traffic accidents are high all over the world and cause deaths, taking measures to minimize all kinds of risks in terms of health and economic consequences has become essential. Seat Belt (SB), which provides low cost and high benefit, is one of the most important safety measures to prevent traffic accidents. while seat belt usage rate in developed countries is around 80% while that rate in Turkey is below 20%, as a result, fatal and injured accident rates in traffic accidents are very high in Turkey compared to the accident rates of developed countries (EGM, 2015).
Statistical Accident Data
Despite the studies and measures taken in our country, there are increases and decreases in deaths and injuries in traffic accidents. In this study, according to the information obtained from traffic accident statistics published by TUIK (Turkish Statistical Institute), accident information according to years, accident vehicle rate, number of deaths and injuries are given in Table 1. (TUİK, 2017). In order to reduce the traffic accidents, many studies are carried out in the world, the factors causing the accident are determined and
measures are taken accordingly.While evaluating the accidents, the population of the region and the ones on the traffic are taken into consideration (EGM 2015).In terms of the occurrence of accidents, it can be said that SB can prevent serious injuries and deaths at the moment of the accident and after the accident occurs.
Table 2 presents the information on the cause of passenger faults in traffic accidents (KGM, 2015).As can be seen in Table 2, the majority of the accidents caused by passenger faults in traffic accidents constitute the majority of the cases.
Table 1. Traffic accident statistics, 2007-2016. Total number of accidents Number of accidents involving death or personal injury Accidents resulting in material damage
Number of deaths The
number of the injured Total In the site
of accident After the accident 825,561 106,994 718,567 5,007 5,007 - 189,057 950,120 104,212 845,908 4,236 4,236 - 184,468 1,053,346 111,121 942,225 4,324 4,324 - 201,360 1,106,201 116,804 989,397 4,045 4,045 - 211,496 1,228,928 131,845 1,097,093 3,835 3,835 - 238,074 1,296,634 153,552 1,143,082 3,750 3,750 - 268,079 1,207,354 161,306 1,046,048 3,685 3,685 - 274,829 1,199,010 168,512 1,030,498 3,524 3,524 - 285,059 1,313,359 183,011 1,130,348 7,530 3,831 3,699 304,421 1,182,491 185,128 997,363 7,300 3,493 3,807 303,812
Table 2. Passenger faults in traffic accidents.
Faults of the passenger Percentage of fault
Not wearing seatbelt 17,87
Not wearing helmet 13,06
Throwing anything on the road so as to make traffic difficult, etc. 7,22
Not complying with other traffic safety rules 2,75
Drinking and driving 2,06
Getting on/off the vehicles uncontrolled -
Other 54,3
Total 100
Seatbelt Usage in Turkey
Seatbelt usage in Turkey has become obligatory for the drivers and the passengers sitting next to the drivers in the automobiles and the land vehicles and minibuses operand as automobiles in terms of registration in intercity highways since 06/18/1986. It has become obligatory for drivers and passengers sitting in the front seat of the automobiles and the land vehicles and minibuses operand as automobiles in terms of registration except for the drivers of commercial cars and minibuses and for those who do passenger transportation in urban roads since 01.01.1992. Although it is known that it is necessary to use SB and it increases the probability of survival after accident, the use of seatbelt is considerably lower than in developed countries (KGM, 2015).
Despite seatbelt use legislation in force in Turkey,a significant number of automobile drivers and the majority of front seat passengers do not use seatbelt. The use of seatbelt is low particularly on intercity highways.The fact that the seatbelt use rate is very low in Turkey, where the rate of deaths and injuries in traffic accidents are quite high, is considered one of the major traffic safety problems (Simşekoğlu, 2008). Seatbelt usage may reduce the rate of deaths and injuries in traffic accidents in Turkey significantly.For example, only 16% of the drivers and 18% of the front seat passengers used seatbelt in intercity roads in Ankara, the capital city of Turkey.However, a high rate of percentage was found in intercity roads compared to the rate of use.In other cities, 16% of drivers involved in traffic accidents on urban roads used seatbelt, while this ratio is around 35% on intercity roads (Simşekoğlu, 2009). In addition, many
drivers claim that it is uncomfortable to use seatbelt, or the seatbelt does not work at all for short-distance journeys, however; the use of seatbelt is essential in short-distance journeys.It was determined that 80% of the fatal accidents happened in a distance of 30-35 kilometers away from the drivers' homes and 55-60 kilometers per hour.In addition, 35% of fatal accidents occur in the city and on daily routes (EGM, 2015). In addition to this, in the studies conducted, body damage is defined as one-fold in the accidents including not wearing seatbelts in 30 kph, this damage is 9-fold more in the accidents in 50 kph.In the case of the use of seatbelts, no such damage occurs or can be prevented to a large extent (Temel, 2006).
Bilgiç et al. (2006) carried out a study based on observation in order to determine the drivers' seatbelt wearing habits in four intersections in the city center of Eskişehir.In this study, 929 drivers were observed, and it was determined that only 85, that is 9,15% of them, wore seatbelt. In the same study, 350 front seat passengers were observed, and it was determined that only 23, 6.57% of them, wore seatbelt. In addition, only 16% of drivers and only 18% of front-seat passengers have used seat belts in urban roads.It was seen that the percentage of car drivers wearing seatbelts is much higher on intercity roads (Şimşekoğlu 2009). In addition, in their study, they examined the use of seatbelt of car drivers in urban roads and highways by face-to-face interviews.Factors affecting the use of seatbelts was identified and a model based on these factors was established. It was determined that the use of seatbelt was 59.2% on urban roads and 20% on highways.The reason for this was determined that there is little faith in the fact that the seatbelt reduces death and injury in collisions due to the fact that traffic accidents were lower in the cities (Bektaş & Hınıs 2009). Turabi (2011), in his study,
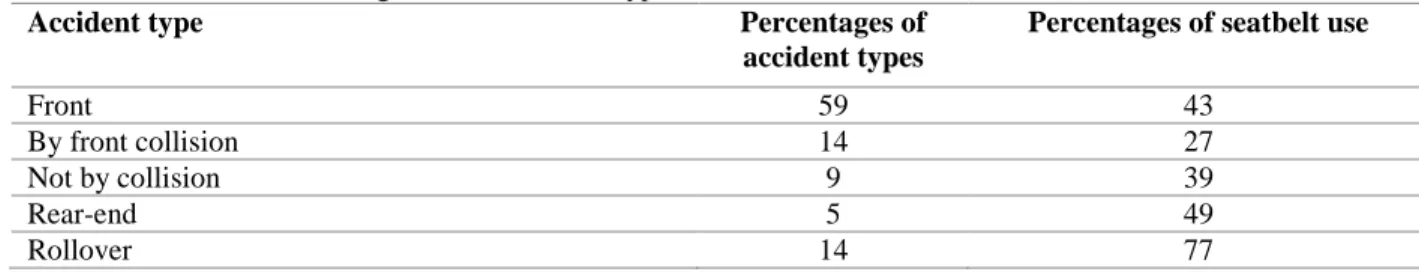
evaluated the use of seatbelt in urban and the country areas in the province of Balikesir.As a result of the observation, it was determined that the ratio of females wearing seatbelt was 26.5% and the raito of the males is 22,3 %.In general, it was stated that the rate of use of seatbelts in Balıkesir province is low.In addition, the 1700 vehicle drivers were observed in the city center of Antalya in their study and it was determined 854 of the drivers wore seatbelt, 871 front seat passengers were observed in the same study and it was determined that 303 of them, 34.79%, wore seatbelt (Bilgiç et al. 201 1).In addition, in their study, it was determined that only 29% of the drivers and only 18% of the front seat passengers wore seatbelt in the province of Kütahya.In Kütahya, the seatbelt use rate is much higher for female drivers than for male drivers. While 65% of female drivers wore seat belts, this ratio is only 26% for male drivers.It has been shown that women's seatbelt use ratios are much higher than men (Bilgiç et al. 2015).Another study was conducted to determine the seatbelt usage of Zonguldak province.A total of 1256 people were observed on different days and hours. It was determined that 16.8% of male drivers and 46.2% of female drivers wore seatbelts.It was stated that the seatbelt use habit of Zonguldak province is generally low (Polat and Tanis 2018). As can be seen in Table 3, the most common type of accident among different types of accidents is frontal collision accidents.In the case of a frontal collision accidents, the use of the seat belt is 43%.When we look at the accident type in which the seatbelt use is the most, the percentage of occurrence of the accident is 14%, the percentage of wearing a seat belt is 77%, significantly higher compared to other types of accidents.
Table 3. Seatbelt use according to traffic accident types.
Accident type Percentages of
accident types
Percentages of seatbelt use
Front 59 43
By front collision 14 27
Not by collision 9 39
Rear-end 5 49
Rollover 14 77
Materials and Methods
Traffic Statistics on the Seatbelt Usage in Erzurum
Observations were made to determine the seatbekt use habits of the drivers in the intersection of the Fatih
Sultan Mehmet Boulevard and Ali Ravi street in the city center of Erzurum. This point was especially selected because the vehicles slowed down at this point.In order for this study to reflect the real values, an hourly measurement was performed on the day of 11.01.2019 between 08:00-09:00 and 17:00-18:00. The measurement was carried out at the weekend on
12.01.2019 between 08:00 and 09:00 in the morning and 17:00 to 18:00 in the evening. In order to determine the number of vehicles, the gender of the person who is driving the vehicle and the person next to him / her, and to determine the age correctly, the measurements are recorded with a video recorder.An
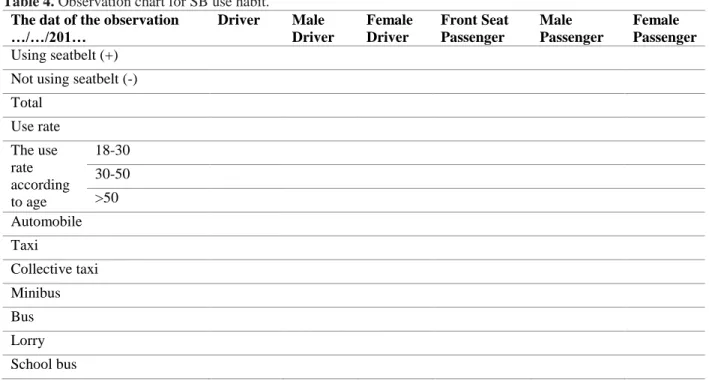
observation chart was prepared for use during observation and is presented in Table 4.In addition, it was tried to determine the seatbelt usage rates according to the types of the vehicles passing through the measurements.
Table 4. Observation chart for SB use habit. The dat of the observation
…/…/201… Driver Male Driver Female Driver Front Seat Passenger Male Passenger Female Passenger Using seatbelt (+)
Not using seatbelt (-) Total Use rate The use rate according to age 18-30 30-50 >50 Automobile Taxi Collective taxi Minibus Bus Lorry School bus
The land slopes of Erzurum are between 7 and 12 percent. When the traffic accidents, the number of deaths and injuries are sorted, Erzurum is the 25th city
which has the highest accident rate ranked from highest to lowest. Based on this data, a total of 8096 accidents occurred in 2017 in Erzurum. 6636 of them are accident resulting in material damage, 1460 are accident involving death or personal injury (TÜİK, 2017).
In order this study to represent Erzurum city center as a population, a statistical study was carried out to determine the seatbelt use habits in Erzurum province. In order to determine whether the data obtained as a result of the observations were sufficient, the following equations numbered (1) and (2) were used.
As a result of these equations, the number of vehicles that should be observed to cover the entire city center of Erzurum is determined (Gülgeç, 1998).In this study, firstly, the necessary sampling rate of 95% probability was found at ± 10 error limit from equation 1 for Erzurum city center where approximately 120,000 private automobiles were registered.
X=1,96√1−𝑘
𝑚∗𝑘 (1)
N=m*k (2)
The first equation is 95% probability error sampling formula. In this formula, each shows;
X: Error limit k: Sampling rate
m: the number of automobiles.
The second equation determines the number of cars that should be observed depending on the sampling rate and the number of automobiles. In this formula, N: the number of automobiles to be observed. X=1,96√1−𝑘
𝑚∗𝑘
0,10=1,96*√ 1−𝑘
120.000∗𝑘
From these equations, the sampling rate was obtained as k 3.19x 10³.
Then, the number of automobiles to be observed is determined with equation 2.
N=m*k
N=120,000x3.19x 10-3
N=383
The number of cars to be observed was 383.
Therefore, it was found that observing 383 cars would be sufficient.Although the number of vehicles to be observed in the center of Erzurum is 383, it can be said that it represents the entire city center of Erzurum with more than 95 percent reliability as a total of 2811 private vehicles were observed during the week and at the weekend.
Findings
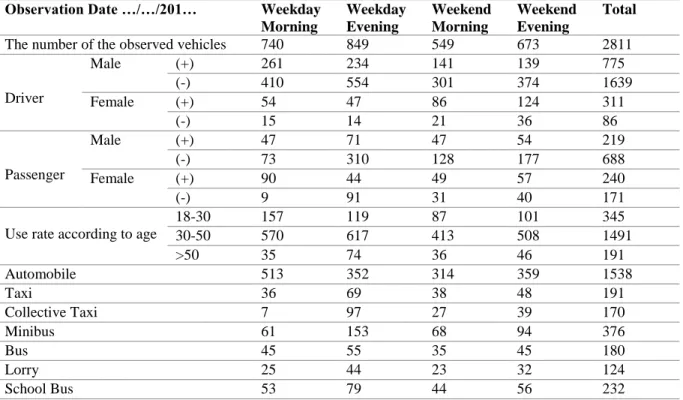
In this study, the data recorded during the week and at the weekend are given in Table 5.The recorded data includes data on the type of vehicle, driver's gender, age, and seatbelt use of front seat passengers. In addition, the seatbelt usage percentages are given in Figure 1a to Figure 1g so that the data obtained can be evaluated in certain parameters.
Figure 1a. Drive gender percentages Figure 1b. The SB Use Habits of Drivers.
Figure 1c. The SB habits of male drivers Figure 1d. SB habits of front-seat male Passengers’.
Figure 1e. SB habits of front seat passengers Figure 1f. SB habits of front-seat female passengers. Male Drivers 2414 86% Female Drivers 397 14% Drivers wearing seatbelt1086 39%
Drivers not wearing seatbelt 1725 61% Male Drivers wearing SB 775 32% Male Drivers not wearing SB 1639 kişi 68% Front-seat Male passengers wearing SB 219 24% Male front-seat passengers not wearing SB 688 76% Front-seat passengers wearing SB 459… Front-seat passengers not wearing SB 859 52% Front-seat female passengers wearing SB 240 58% Front-seat female
passengers not wearing SB 171 42%
Figure 1g. SB habits of female drivers.
Table 5. 2019 Year Seatbelt Use Data of Erzurum Province Observation Date …/…/201… Weekday
Morning Weekday Evening Weekend Morning Weekend Evening Total The number of the observed vehicles 740 849 549 673 2811
Driver Male (+) 261 234 141 139 775 (-) 410 554 301 374 1639 Female (+) 54 47 86 124 311 (-) 15 14 21 36 86 Passenger Male (+) 47 71 47 54 219 (-) 73 310 128 177 688 Female (+) 90 44 49 57 240 (-) 9 91 31 40 171
Use rate according to age
18-30 157 119 87 101 345 30-50 570 617 413 508 1491 >50 35 74 36 46 191 Automobile 513 352 314 359 1538 Taxi 36 69 38 48 191 Collective Taxi 7 97 27 39 170 Minibus 61 153 68 94 376 Bus 45 55 35 45 180 Lorry 25 44 23 32 124 School Bus 53 79 44 56 232
As a result of the conducted observations, the SB use percentages of the drivers are indicated in Table 6 and the SB use percentages of the passengers are indicated in Table 7. As it can be seen, 68% of the males do not wear seatbelt while 13% of the females do not wear seatbelt. When these percentages are compared, it can be said that the SB use habits of males are quite low
whereas the SB use habits of females are higher. When the data on Table 6 and 7 are analyzed, it is seen that there is a decrease in the SB use rates of both females and males when they are in passenger position. Based on these data, it can be said that drivers are more conscious about wearing seatbelt compared to passengers.
Table 6. The SB Use Percentages of Drivers.
Driver Wearing SB Percentage (%) Not wearing SB Percentage (%)
Male 775 32.1 1639 67.9 Female 311 87 86 13 Total 1086 38.6 1725 61.4 Female drivers wearing SB 311… Femal drivers not
wearing SB 86…
Table 7. The SB Use Percentages of Passengers.
Passenger Wearing SB Percentage (%) Wearing SB Percentage (%)
Male 219 24.1 688 75.9
Female 240 58.4 171 41.6
Total 559 39.4 859 60.6
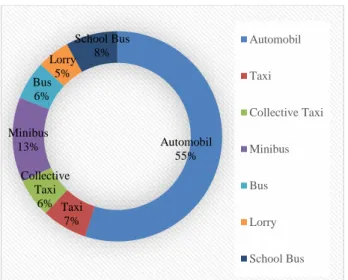
During the observations, the SB use habits of the vehicles were also analyzed. As a result of the observations, the age distribution percentages of the drivers are indicated in Figure 2. Figure 3 indicates the percentages of the vehicle type distribution.
Figure 2. The Age Distribution of the Drivers.
Figure 3. Percentage Distribution of the Observed
Vehiles.
One of the other purposes of this study was to determine the SB use percentages according to age variable and gender variable among these age groups. The observations were made considering these age distributions as 18-30, 30-50 and > 50. As a result of the observations, the SB use of the age group 18-30 is indicated in Table 8 and Figure 4a indicates the SB use as percentage. Figure 4b indicates the percentage values of SB use according to gender variable. The SB use of the age group 30-50 is indicated in Table 9 and Figure 5a indicates the SB use as percentage. Figure 5b indicates the percentage values of SB use according to gender variable. Lastly, the SB use of the age group >50 is indicated in Table 10 and Figure 6a indicates the SB use as percentage, and Figure 6b indicates the percentage values of SB use according to gender variable.
Table 8. SB use between 18-30 years old.
Driver Passenger
Age
Male Female Male Female
(+) (-) (+) (-) (+) (-) (+) (-) 18-30 140 187 105 31 44 53 45 18 463 Age between 18-30 17% Age between 30-50 74% Age >50 9%
THE AGE DISTRIBUTION OF THE DRIVERS
Automobil 55% Taxi 7% Collective Taxi 6% Minibus 13% Bus 6% Lorry 5% School Bus 8% Automobil Taxi Collective Taxi Minibus Bus Lorry School Bus
Figure 4a. SB use percentage. Figure 4b. SB use percentage according to gender distribution. Table 9. SB use between 30-50 years old 30-50.
Driver Passenger
Age
Male Female Male Female
(+) (-) (+) (-) (+) (-) (+) (-) 30-50
573 1363 190 51 138 598 193 153 2177
Figure 5a. SB use percentage. Figure 5b. SB use percentage according to gender distribution.
Table 10. SB use >50 years old.
Driver Passenger
Age
Male Female Male Female
(+) (-) (+) (-) (+) (-) (+) (-) >50
62 89 16 4 37 37 2 0 165
Figure 6a. SB use percentage. Figure 6b. SB use percentage according to gender distribution
Drivers wearing SB 53% Drivers not wearing SB 47% SB USE PERCENTAGE BETWEEN 18-30 YEARS OLD
Drivers wearing SB
36%
Drivers not wearing SB…
SB USE PERCENTAGE BETWEEN 30-50 YEARS OLD Drivers wearing SB 49% Drivers not wearing SB 51%
SB USE PERCENTAGE OF >50 AGE GROUP
Results and Discussion
Traffic safety is among the major problems of developing countries. The reason why traffic safety is one of the most important problems is the use of seatbelts in low percentages. While the rate of use of SB in developed countries is around 80-90 %, this rate is very low in developing countries.The rate of use of SB in our country varies between 20-30 %.The city of Erzurum is above this limit both in terms of drivers and passengers. In this study, it was determined that only 38,6 % of the drivers wore SB while 39,4 % of the front-seat passengers wore SB. The SB use percentages of female drivers in Erzurum province is quite higher than the ones of male drivers. The SB use percentages of the people as drivers are higher than those as passengers. While the SB use percentage of males as drivers are 32,1 %, it is 24,1% as passengers. The SB use percentages of females as drivers are 87 %, it is 58,4 % as passengers.
Another striking result obtained from the observations is that the SB use percentages of females both as drivers and passengers are higher compared to the ones of males. While the SB use percentages of females as drivers are 87 %, the SB use percentages of males as drivers are 32,1%. Their SB use percentages as passengers are 58,4 % while the SB use percentages of males as passengers are 24,1 %. To increase the SB use rate, first of all, it should be taught that it decreases the deaths and injuries in the accidents and increases traffic safety. As we don’t have enough information about SB as a society, many drivers don’t wear SB. Recently, the police surveillance on SB use and the tickets have been increased, and these surveillance and tickets should continue. When the data of this study are compared to the ones of Zonguldak and Kütahya provinces, SB use percentage of Erzurum province is higher than those two. It can be said that the reason for this is based on the surveillance and tickets being applied recently. The increased surveillance and ticket processes around the country will increase the use of SB.
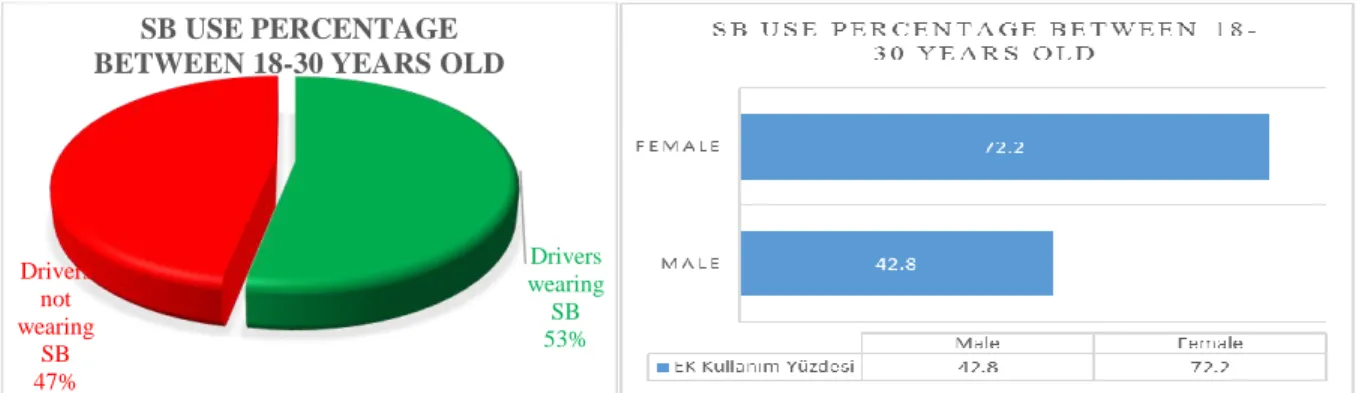
As a result of the observations, it was determined that the SB use percentage of 18-30 age group is 53 %, while this rate is 77,2 % among females and 42,8 % among males. In the light of these data, it is seen that these rates are higher in terms of SB use both in Erzurum and Turkey. It was determined that the SB use percentage of 30-50 age group is 36 %, while this rate is 79,25 % among females and 29,6 % among males. In addition, when the data of the 30-50 age group are compared to the data of Turkey, it can be said that the SB use rate is higher, however, the SB use rate of the males among 30-50 age group is quite lower than those
among 18-30 age group. Finally, it was determined that the SB use percentage of >50 age group is 49 %, while this rate is 64 % among females and 41,05 % among males. When these rates are compared to the rates of the other age groups, it can be said that these rates are parallel with the rates of 18-30 age group while they are higher than those of 30-50 age group. When we analyze the SB use rate according to age and gender, the SB use percentage of 18-30 and >50 age groups are quite higher than those of general SB use of Erzurum province and Turkey, although the SB use rate of 30-50 age group is quite lower.
Conclusion
As a result, SB use rate of Erzurum province was analyzed in terms of age, gender and being driver and passenger variables. As it can be seen through the study, SB use rates can be increased with tight surveillance and precautions. It can be said that the society has misinformation about not using SB, and the psychological effects of these should be analyzed. News channels, journals, magazines, newspapers etc. should be used to raise community awareness to correct misinformation about the use of SB. We can increase the SB use rate through new measures and regulations to the rates of developed countries.
Aknowledgment
We thank Agri Ibrahım Cecen University. References
WORLD HEALTH ORGANIZATION (WHO), (2015). World report on road traffic injury prevention. Special Report Prepared by World Health Organization.
T.C. EMNIYET GENEL MÜDÜRLÜĞÜ TRAFIK HIZMETLERI BAŞKANLIĞI (1999). Ülkemizde Emniyet Kemeri Kullanımı, Trafik Arastırma Merkezi
MüdürlüğüYayınları, Ankara. EMNIYET GENEL MÜDÜRLÜĞÜ, TRAFIK
HIZMETLERI BAŞKANLIĞI (2015). Trafik İstatistikleri, Çevrimiçi bulunabilirlik: http://www.trafik.gov.tr/istatistikler/istatistik ler_s.asp.
EMNIYET GENEL MÜDÜRLÜĞÜ, TRAFIK HIZMETLERI BAŞKANLIĞI (2015). Emniyet Kemeri, Çevrimiçi bulunabilirlik: http://www.trafik.gov.tr/Sayfalar/EmniyetKe meriKullanimi.aspx.
KARAYOLLARI GENEL MÜDÜRLÜĞÜ, TRAFIK GÜVENLIĞI DAIRE BAŞKANLIĞI (2015). 2014 Yılı Karayolları Genel Müdürlüğü Sorumluluğundaki Yol Ağında Meydana Gelen Trafik Kazalarına Ait Özet Bilgiler. Ulaşım Etütleri Şubesi Müdürlüğü. BOZTAŞ G., ÖZCEBE H. (2005). Trafik kazası
yaralanmalarında ikincil koruma: Emniyet kemeri, Sürekli Tıp Eğitim Dergisi, 14, (5), Ankara.
BILGIC, S., YALINIZ, P., KARACASU, M. (2006). The usage of seat belts in Turkey.
Proceedings of the EWGT 2006 Joint Conferences, 487-493, Italy.
SIMSEKOGLU O., LAJUNEN, T., (2008). Why Turks do not use seat belts? An interview study. Accident Analysis and Prevention 40, 470–478.
SIMSEKOGLU, O. (2009). Factors related to seat belt use: A Turkish case. PhD thesis, Department of Psychology, University of Helsinki, Finland.
TEMEL F, ÖZCEBE H. (2006). Türkiye’de karayollarında trafik kazaları. Sürekli Tıp Eğitimi Dergisi (STED) 15:192-8. Ankara. BILGIC S., BARUT H. B., KARACASU M., ER A.,
YALINIZ P., (2011). The changes in usage of seat belts in Antalya, Turkey. Procedia – Social and Behavioural Sciences, 14th EWCT Meeting.
BILGIC S., VITOŞOĞLU Y., YALINIZ P., (2014). Kütahya’da Emniyet Kemeri Kullanımı Alışkanlıklarının Değerlendirilmesi. BEKTAŞ S., HINIS M. A., (2009). Emniyet Kemeri
Kullanımına Etki Eden FaktörlerinOtomobil Sürücüleri İçin Tahmin Modeli. Erciyes Üniversitesi Fen Bilimleri Enstitüsü Dergisi 25(1-2)208.
TURABI A., ÜÇER F.,(2011). Balıkesir Emniyet
Kemeri Kullanımı Alışkanlıklarının
Değerlendirilmesi, 6. Kentsel Altyapı Sempozyumu, Antalya.
GÜLGEÇ, İ., 1998. Ulaşım Planlaması. Özsan Matbacıllık, 13, Bursa
POLAT M. VE TANIS M. (2018). Zonguldak İli Emniyet Kemeri Kullanım Durumunun Değerlendirilmesi, Researchgate, Zonguldak.
TÜRKIYE İSTATISTIK KURUMU (TUİK), (2017). Karayolu Trafik Kaza İstatistikleri, 2017.