SUPPLIER SELECTION AND COLLABORATION FOR
HUMANITARIAN RELIEF SUPPLY CHAINS
Eren Şallı, Peral Toktaş-Palut
Abstract ⎯ Humanitarian logistics is mainly divided into the following three planning stages in the
disaster life cycle: (pre-disaster) mitigation phase, (post-disaster) response phase, and recovery phase. Relief supplier selection and collaboration is a very crucial part of the pre-disaster period to overcome the difficulties in the response phase which could not be done by government itself. The main objective of this study is to select the most appropriate relief suppliers in the pre-disaster period in terms of determined criteria. As a case study, the Anatolian side of Istanbul, Turkey is considered as the affected area. In order to achieve this goal, first Interpretive Structural Modeling (ISM) is used to identify and rank the criteria and to find the interactions among them. Among 15 criteria determined through the literature review and face to face surveys with experts, seven of them are found to be more important and affecting than the others. These criteria are geographic position, collaboration attribute, using information technology tools, data accuracy, evaluation and certification system, resource and information sharing, and trust development. Second, Analytic Network Process (ANP) is used to determine the weights of the criteria selected by the ISM method. Finally, the candidate suppliers are evaluated and ranked in terms of these criteria using the Analytic Hierarchy Process (AHP)-Rating technique. The framework proposed in this study provides practitioners with a tool for planning and carrying out humanitarian logistics activities.
Keywords ⎯ Analytic Network Process (ANP), Humanitarian logistics, Interpretive Structural Modeling (ISM), Supplier selection.
1. INTRODUCTION
Emergency logistics (EL) operates in environments with uncertain and dynamic features. Uncertain events occur not only on the supply side (involving relief resources and relief suppliers, for example) but also on the demand side (involving relief demand and affected people, for example). Such uncertain events are usually highly dynamic under the conditions of a disaster. Owing to the complex and varying nature of these operational environments, no organization – not even a government – can manage the EL for such large-scale disasters without collaborating with others [1]. Clearly, relief supply collaboration is critical to managing EL following natural disasters [2]. The fundamental reason for engaging in relief supply collaboration is that the host government cannot successfully run EL alone during post-disaster phases. Accordingly, the government seeks relief suppliers with whom to coordinate cross-supplier relief activities and joint actions to ensure effectiveness. Collaboration can improve the supply chain performance in terms of better stability of impacts and service level [3]. Nevertheless, many domestic non-governmental organizations (NGOs) self-deploy and distribute relief resources without collaborating with the government, potentially causing an imbalance in the distribution, and an oversupply or undersupply, of relief resources to affected areas. Relief undersupply in the affected areas means shortages of relief resources, including crew and commodity. Such shortages may worsen hunger and suffering, increase the mortality rate, and incidences of looting. For example, in 2005, after Hurricane Katrina in the USA, one of Louisiana’s greatest shortages was portable toilets, which were requested for the Superdome but never arrived there, as
more than 20,000 people were forced to reside inside the dome without working plumbing for nearly a week [4]. Desperation gripped the Philippine Islands devastated by Typhoon Haiyan in 2013; the looting turned deadly and survivors panicked over shortages of food, water, and medicine; some dug up underground water pipes and smashed them open [5]. In contrast, relief oversupply may occur in other affected areas. The deployment of an unsuitable stock of relief resources in the affected areas may lead to redundancy, the overconsumption of logistical resources, and even congestion in the system [6]. For example, five months after the 2004 Asian tsunami, approximately one-third of the relief containers were still blocked in airport customs [7]; there was an excessive accumulation of relief supplies at refuge centers during the response period after the 1999 Taiwan earthquake [8]. In the 2011 Sendai earthquake and Japanese tsunami, many such goods arrived in Onagawa City. Used clothing was sent to the shelters; however, 80% of the clothes were returned to the distribution center and about 7.7 tones of the donated goods had to be recycled [9]. These impacts increase over time: as the duration of a supply–demand imbalance increases, the impact of the disaster increases. Failure to control efficiently such an impact may cause a secondary disaster.
A large-scale disaster may or may not make the government dysfunctional. For instance, the 2010 Haiti earthquake caused serious damages and many government buildings were destroyed, which disrupted the Haitian government. On the other hand, in the aftermath of the 2013 Lushan earthquake in China, the government was functional to operate EL responses. The government represents not only the most powerful relief supplier but also the coordinator for relief supply collaboration.
To achieve collaboration in the supply of relief with potential relief supplier, governments should solve the following crucial problems that commonly NGOs cause:
• The willingness to engage in relief supply collaboration varies among NGOs. Each NGO has its own nature (including management philosophy, capabilities, and culture) that affects its willingness to collaborate with government or other NGOs. Some experienced NGOs willingly collaborate with governments; others may have their own operational standards and prefer to work independently rather than with specific units, such as the military [1]. For instance, NGOs may be reluctant to share information with other organizations which gives them a competitive advantage in attracting media [2]. Even NGOs sharing the same principles may be reluctant to work together [10]. For example, the French Red Cross and the International Federation of Red Cross and Red Crescent (IFRC) share the same name, but they do not accept clear reporting lines [10].
• The types and quantities of relief resources (including relief workers and relief supplies) that are provided by NGOs vary. NGOs may include charity organizations, private companies, private rescuers, and medical teams. Each NGO provides its own relief resources to the affected people. For example, supermarkets donate various cleaning tools, pet shops provide pet supplies, and families give gifts. Besides, NGOs donation may determine the relief resources distributed [11]. Inappropriate donations include; laptops needing electricity where the infrastructure has been destroyed; heavy clothing not suitable for tropical regions [12]. • The number of NGOs that participate in relief supply tasks varies over time. A large number
of NGOs may become involved in supplying relief in the aftermath of a disaster [1]. However, the response time for EL support and relief supply distribution varies among NGOs. For example, given the geographical distribution of NGOs, NGOs near the affected areas usually arrive sooner than those who are far from the affected areas; many NGOs arrive at a country to deliver aid only if and when donor funding becomes available [2]. Consequently, many NGO’s involvement and operation are somewhat unpredictable.
• Some countries established facilities like a warehouse in order to store relief items such as tents, sleeping bags, blankets, medical first aid kits, dry food and water in pre-disaster period. After the disaster, they will act as both supply points for the stored items and regional coordination centers in relief operations. One such facility was already established in 2006 in Istanbul. AKOM has identified 40 potential locations for establishing additional facilities in Istanbul. The main criteria used in determining these locations are accessibility by at least two alternative roads, proximity to major highways and availability of land. Discussions with
AKOM and other response agency representatives revealed that it would not be practical to establish a large number of facilities that stay non-functional until a disaster occurs. Instead, they find it meaningful to utilize some of the relief supplier’s location as a joint facility location.
To overcome these uncertainties and dynamic critical problems that are related to NGOs, and to alleviate their possible impact, this study propose a novel relief supply collaboration approach to address the issue of imbalanced relief supply-demand impact for EL operations in rapid response to the needs of affected people in the aftermath of large-scale disasters. This study has a distinctive feature which separates it from previous studies. To select the most proper relief suppliers in pre-disaster period, first Interpretive Structural Modeling (ISM) is used to identify and rank the criteria and to find the interactions among them. Second, Analytic Network Process (ANP) is used to determine the weights of the criteria selected by the ISM method. Finally, the candidate suppliers are evaluated and ranked in terms of these criteria using the Analytic Hierarchy Process (AHP)- Rating technique. The remainder of the paper is organized as follows. In Section 2, Interpretive Structural Modeling (ISM) is applied to determine the criteria used in relief supplier selection. In Section 3, Analytic Network Process (ANP) is conducted to determine the weights of the criteria. In Section 4, potential suppliers are evaluated; and finally, in Section 5, concluding remarks are given.
2. INTERPRETIVE STRUCTURAL MODELING (ISM)
The criteria involved in the supplier selection have been chosen by face to face survey as well as literature review. A questionnaire consisting of these factors is designed for the survey. The respondents for the survey are selected randomly from different functional areas of Alternative Logistics Company which is conducting emergency logistic activity on the behalf of AFAD. Based on the survey conducted, the major influencing criteria involved in supplier selection are collaboration attribute, resource size, quality improvement, cost minimization, flexibility, trust development, lead time reduction, long term strategic goals, capability, relational orientation, resource and information sharing, evaluation and certification system, geographic position, using information technology tools, and data accuracy.
ISM methodology suggests the use of expert opinions based on various management techniques such as brainstorming, nominal technique, etc. in developing the contextual relationship among the variables. Thus, in this study for identifying the contextual relationship among the interactions for the supplier selection criteria; four experts, two from the Alternative Logistics, one from academia and one from AKOM are consulted for this study. Keeping in mind the contextual relationship for each element, the existence of a relation between any two criteria (i and j) and the associated direction of the relation is questioned. Four symbols are used to denote the direction of relationship between the criteria (i and j):
(1) V – criteria i will help alleviates criteria j; (2) A – criteria j will be alleviated by criteria i;
(3) X – criteria i and j will help achieve each other; and (4) O – criteria i and j are unrelated
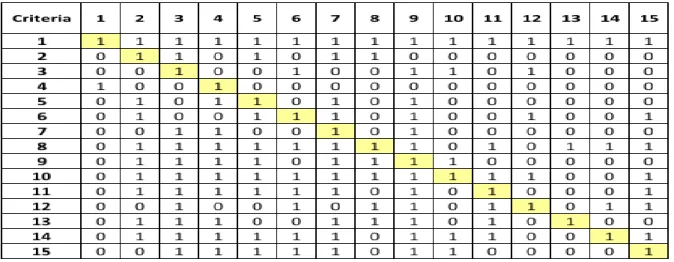
2.1. Initial Reachability Matrix
The initial reachability matrix is transformed into a binary matrix, called the structural self interaction by substituting V, A, X, O by 1 and 0 as per the case. The rules for the substitution of 1 and 0 are the following:
(1) If the (i, j) entry in the SSIM is V, then the (i, j) entry in the reachability matrix becomes 1 and the ( j, i ) entry becomes 0.
(2) If the (i, j) entry in the SSIM is A, then the (i, j) entry in the reachability matrix becomes 0 and the ( j, i ) entry becomes 1.
(3) If the (i, j) entry in the SSIM is X, then the (i, j) entry in the reachability matrix becomes 1 and the ( j, i ) entry also becomes 1.
(4) If the (i, j) entry in the SSIM is O, then the (i, j) entry in the reachability matrix becomes 0 and the ( j, i ) entry also becomes 0. The Structural Self-Interection Matrix (SSIM) is shown in Table 1.
Table 1. Structural Self-Interection Matrix
As a result of transivity process and level partition, driver and dependence power of the variables are determined. The variables are classified into four clusters (Figure 1). The first cluster consists of the autonomous criteria that have weak driver power and weak dependence. These criteria are relatively disconnected from the system, with which they have only few links, which may be strong. Second cluster consists of the dependent criteria that have weak driver power but strong dependence. Third cluster has the linkage criteria that have strong driving power and also strong dependence. These criteria are unstable in the fact that any action on these criteria will have an effect on the others and also a feedback on themselves. Fourth cluster includes the independent criteria having strong driving power but weak dependence. It is observed that a variable with a very strong driving power called the key variables falls into the category of independent or linkage criteria. The driving power and the dependence of each of these criteria are shown in Figure 1.
2.2. Result and Analysis
The criteria hindering the supplier selection pose considerable challenges both for managers and policymakers in humanitarian logistics activity. Some of the major criteria have been highlighted here and put into an ISM model to analyze the interaction between the criteria.
These criteria need to be developed for the success in supplier selection. The driver-dependence diagram shown in Figure 1 gives some valuable insights about the relative importance and the interdependencies among the criteria. This can give better insights to the company so that they can proactively deal with these criteria. Some of the observations from the ISM model, which give important managerial implications, are discussed below.
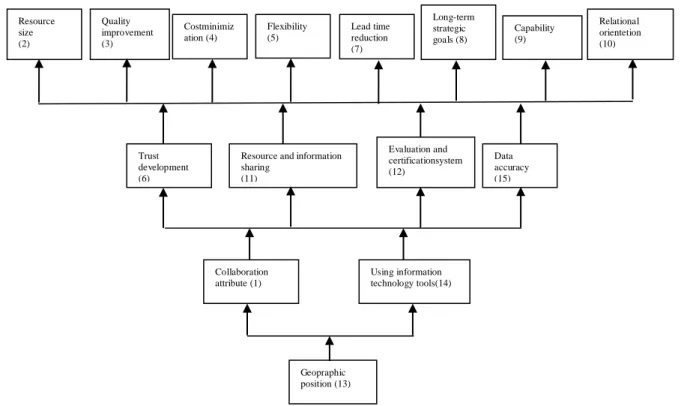
It is observed from Figure 2 that Geographic position (criterion 13) is a very significant factor for the supplier selection process, so it forms the base of the hierarchy. Resource size (criterion 2), Quality improvement (criterion 3), Cost minimization (criterion 4), Flexibility (criterion 5), Lead time reduction (criterion 7), Long term strategic goals (criterion 8), Capability (criterion 9), Relational orientation (criterion 10) which depicts the successful supplier development process. These variables have appeared at the top of the hierarchy. The Geographic position criterion lead to the following criteria collaboration attribute, using information and technology tools. These two criteria lead to trust development, resource and information sharing, evaluation and certification system, data accuracy criteria. It is also observed from Figure 1 that there are no autonomous criterion seen in the driver-dependence diagram. The absence of these criteria brings light to the fact that all the considered
criteria influence the supplier selection in the humanitarian relief supply chain.
Figure 1. Driving and dependence power diagram for criteria
Figure 2.ISM-based supplier selection criteria model Quality improvement (3) Costminimiz ation (4) Flexibility (5) Lead time reduction (7) Long-term strategic goals (8) Capability (9) Relational orientetion (10) Resource size (2) Trust development (6)
Resource and information sharing (11) Evaluation and certificationsystem (12) Data accuracy (15) Collaboration attribute (1) Using information technology tools(14) Geopraphic position (13)
3. ANALYTIC NETWORK PROCESS (ANP)
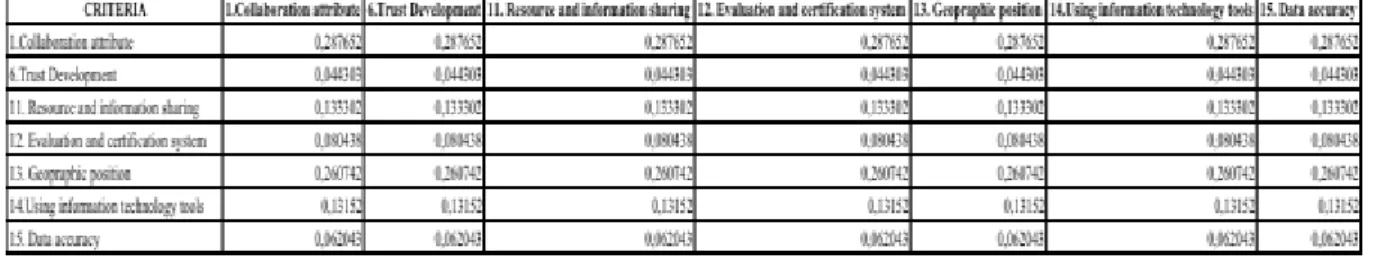
Among 15 criteria determined through the literature review and face to face surveys with experts, seven of them are found to be more important and affecting the others after using ISM. These criteria are geographic position, collaboration attribute, using information technology tools, data accuracy, evaluation and certification system, resource and information sharing, and trust development. Then, Analytic Network Process is conducted with the same group that conducted ISM. The ANP-based model is implemented by several steps. First, pairwise comparision matrice is formed so as to determine inner dependencies in criteria cluster based on Saaty’scale. During the assesment process there may occur a problem in terms of consistency. Therefore inconsistency ratios for every matrices are checked in order to determine the misevaluation of comparisons. Inconsistency ratios are generally acceptable up to the limit of 0.10, while some scholars offer a limit up to 0.20 [13]. If all matrices are consistent, the process can proceed to the next step. If not, inconsistent matrices should be reassessed in order to provide consistency for all matrices. In this case there is no problem in terms of the consistency value, which is under the limit, considering the Saaty’scale. Second, supermatrix are formed consisting of unweighted super matrix, weighted super matrix and limit super matrix, which are respectively formed one after the other through proper computation. Finally, the limit supermatrix provides priorities of criteria. In fact, values of the limit supermatrix stand for the overall priorities, which embrace the cumulative influence of each element of the network on every other element, with which it interacts. In particular the computations related to ANP application have been carried out effortlessly by the software Superdecisions. Weighted super matrix, limit super matrix and priorities of criteria are given Table 2, Table 3 and Table 4 respectively.
Table 2. Weighted super matrix
Table 3. Limit super matrix
Table 4. Priorities of criteria
CRITERIA 1.Collabo ration attribute 6.Trust Develop ment 11. Resource and information sharing 12. Evaluation and certification system 13. Geographi c position 14.Using information technology tools 15. Data accuracy Limiting value 0.29 0.05 0.13 0.08 0.26 0.13 0.06 Normalized value 0.29 0.05 0.13 0.08 0.26 0.13 0.06
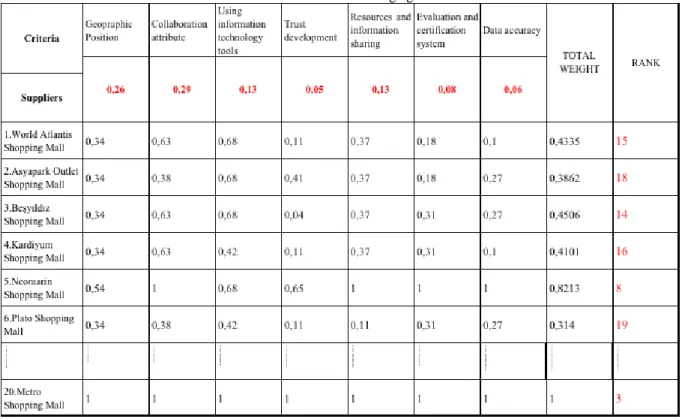
4. EVALUATION OF POTENTIAL SUPPLIERS
In this part, it is tried to determine the potential relief suppliers, located in the Anatolian side of İstanbul, that might be involved in humanitarian logistics activities. This investigation includes charitable organizations and private companies. 20 suppliers are evaluated in terms of determined and weighted criteria. This study surveys experienced government’s crews working in EL that are responsible for emergency response training during normal times and for collecting the relief resources supplied by the government and manager of Alternative Logistics who is conducting emergency logistics activities on behalf of AFAD. These members measure all of the corresponding criteria of NGO. The survey responses by these crews are the data used for the AHP-rating technique.
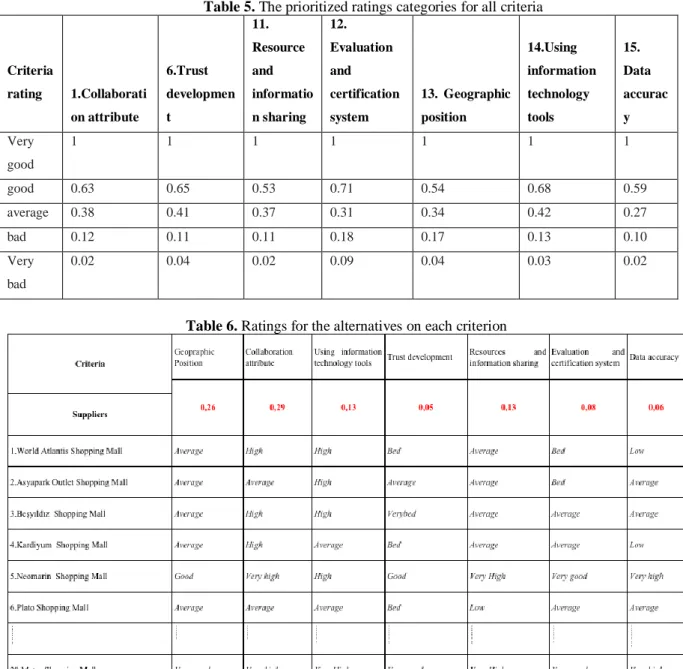
Here it is established rating categories for each covering criterion and prioritize the categories by pairwise comparing them for preference. Alternatives are evaluated by selecting the appropriate rating category on each criterion as given in Table 5. The rating categories for the criterion are Very good, Good, Average, Bad and Very bad. The criteria are compared for preference using a pair-wise comparison matrice in the usual way. To obtain the idealized priorities, we normalize by dividing by the largest of the priorities. The idealized priorities are used for the ratings. Table 6 gives the verbal ratings of the twenty alternatives on each covering criterion and Table 7 gives their corresponding numerical ratings from Table 6 with their totals and rank of the group.
Table 5. The prioritized ratings categories for all criteria
Criteria rating 1.Collaborati on attribute 6.Trust developmen t 11. Resource and informatio n sharing 12. Evaluation and certification system 13. Geographic position 14.Using information technology tools 15. Data accurac y Very good 1 1 1 1 1 1 1 good 0.63 0.65 0.53 0.71 0.54 0.68 0.59 average 0.38 0.41 0.37 0.31 0.34 0.42 0.27 bad 0.12 0.11 0.11 0.18 0.17 0.13 0.10 Very bad 0.02 0.04 0.02 0.09 0.04 0.03 0.02
Table 7. Numerical values for ratings given in Table 6
As a result of final evaluation of potential relief suppliers in terms of the rating categories, final ranking is formed as given in Table 8.
Table 8. Final ratings of suppliers
Number Suppliers Rank Weight
1 Carrefoursa Shopping Mall 1 1
2 Maltepe Park Shopping Mall 2 1
3 Metro Shopping Mall 3 1
4 Buyaka Shopping Mall 4 1
5 Tepe Nautilus Shopping Mall 5 1
6 Palladium Shopping Mall 6 0,9825
⁞ ⁞ ⁞ ⁞
20 Rings Shopping Mall 20 0,283
5. CONCLUSION
The main objectives of this study is to select the most proper relief suppliers in pre- disaster period in terms of some of the important criteria which are determined.
In order to determine the most appropriate suppliers, first, Interpretive Structural Modeling (ISM) is applied to identify and rank the criteria used for the supplier selection and to find the interactions among the criteria. At the beginning, 15 criteria are determined which are selected by literature review and face to face survey. After using ISM some of the criteria are eliminated and only 7 criteria remained. Second, Analytic Network Process (ANP) is used to determine the weights of the criteria which are selected in the former phase. Third, the potential relief suppliers that might be involved in humanitarian logistics activities are determined. These suppliers are evaluated in terms of 7 criteria, Geographic Position, Collaboration attribute, Using information technology tools, Trust development,
AHP-RATE technique. Finally, the potential suppliers are ranked in terms of total weights so as to be used for humanitarian logistic activities as a suppliers.
Future research may consider other key criteria for selecting the most appropriate suppliers to collaborate for humanitarian logistics activities. Furthermore, future study may also expand the number of potential suppliers and diversity of suppliers. In this study, suppliers are selected by subjective criteria determined by experts. As a further study, mathematical modeling could be conducted in order to refrain from subjectivity.
REFERENCES
[1] Waugh, W. L., and G. Streib, 2006, “Collaboration and Leadership for Effective Emergency Management”, Public Administration Review, 66 (1): 131–140.
[2] Balcik, B., B. M. Beamon, C. C. Krejci, K. M. Muramatsu, and M. Ramirez, 2010, “Coordination in
Humanitarian Relief Chains: Practices, Challenges and Opportunities”, International Journal of
ProductionEconomics, 126 (1): 22–34.
[3] Fu, Y. H., and R. Piplani, 2004, “Supply-Side Collaboration and Its Value in Supply Chains”, European Journal of Operational Research, 152 (1): 281–288.
[4] Committee on Homeland Security and Governmental Affairs, 2006, Hurricane Katrina: A Nation Still Unprepared: Special Report of the Committee on Homeland Security and Governmental Affairs, United States Senate, Together with Additional Views, Washington, DC: U.S. G.P.O.
[5] Reuters, 2013, Desperate Philippine Typhoon Survivors Loot, Dig up Water Pipes, http://www.reuters.com/article/2013/11/13/us-philippinestyphoonidUSBRE9A603Q20131113.
[6] Russell, T. E, 2005, “The Humanitarian Relief Supply Chain: Analysis of the 2004 South East Asia
Earthquake and Tsunami”, Cambridge, Massachusetts Institute of Technology.
[7] VanWassenhove LN, 2006, “Humanitarian aid logistics: supply chain management in high gear”, J Op. Res. Soc., 57:475–489.
[8] Sheu, J. B., 2007, “An Emergency Logistics Distribution Approach for Quick Response to Urgent Relief
Demand in Disasters”, Transportation Research Part E 43 (6): 687–709.
[9] Okumura, M., 2012, “Logistics Chain Management for Emergency Supplies”, Washington, DC: World Bank., https://openknowledge.worldbank.org/handle/10986/16153.
[10] Charles, A., M. Lauras, and R. Tomasini, 2010, “Collaboration Networks Involving Humanitarian
Organisations – Particular Problems for a Particular Sector.”, In Collaborative Networks for a
SustainableWorld, edited by L. M. Camarinha-Matos, X. Boucher, and H. Afsarmanesh, 157–165. Berlin, Springer
.
[11] Whybark, D. C., S. A. Melnyk, J. Day, and E. Davis, 2010, “Disaster Relief Supply Chain Management:
New Realities, Management Challenges, Emerging Opportunities.”, Decision Line 41 (3): 4–7.
[12] Dignan, L., 2005, “Tricky Currents; Tsunami Relief Is a Challenge When Supply Chains Are Blocked by
Cows and Roads Don’t Exist.”, Baseline 1 (39): 30–30.
[13] Cox A.M.. Alwang, J., Johnson, T.G., 2000, “Local preferences for economic development outcomes: