On Feasibility of Near-Infrared Spectroscopy for Noninvasive
Blood Glucose Measurements
N. Mert Vural
a, Yigit Yoleri
b, and Hamdi Torun
ca
Bilkent University, Ankara, Turkey
b
University of California San Diego, La Jolla, United States
c
Northumbria University, Newcastle upon Tyne, UK
ABSTRACT
Non-invasive blood glucose measurement has long been desired since the invasive methods are not suitable to perform continuous monitoring. Near Infrared Spectroscopy is one of the most popular methods used in studies; however, despite more than 20 years of research, a practical and reliable noninvasive NIR glucose sensor is yet to be developed. In this study, we investigated the feasibility of NIRS towards the detection of glucose concentration. Although we can obtain adequate sensitivity, our measurements suffer from poor selectivity due to the fact that we can only detect the impurity level of water by NIRS due to strong water absorbance. Keywords: Near Infrared Spectroscopy, noninvasive measurement
1. INTRODUCTION
Recent improvements in spectrometry have enabled us to perform noninvasive blood tests accurately, e.g. hemoglobin concentration,1 hematocrit test,2 and blood pressure measurement.3 Noninvasive blood glucose
measurement has also been desired since the invasive methods are not suitable to perform frequent measure-ments. Through invasive methods, it is hard to continously maintain blood glucose level, which is critical for patients to reduce the risks of complications. Although some commercial devices perform continuous glucose measurements, they usually measure glucose in tissue fluid, the correlation of glucose concentration of which to blood glucose level is debatable.4
Many methods have been used for noninvasve glucose measurement, including Raman Spectroscopy,5
Mid-infrared Spectroscopy,6Near Infrared Spectroscopy.7 In this study, we use Near Infrared Spectroscopy(NIRS) due
to its relatively higher penetration depth and the weaker water absorption in this spectral area. The literature on measuring blood glucose using NIRS is rich, but the results of these studies are usually not conclusive. Moreover, no successful commercial product has survived in this field, as such, in one interesting article, John L. Smith states that any successful device has not been developed so far, and claims it is very challenging if not impossible to develop one8.
One of the most important technological barriers for NIRS towards glucose sensing is strong water absorption in the infrared (IR) band, including the NIR region spectrum.9 Near infrared spectra of samples with high water
contents (> 80%) are strongly dominated by the signature from water. Hans Buning-Pfaue10 states that milk,
sliced potato and pear flesh, tofu and meat solutions with the water percentage about 70 − 90%, the absorption bands appear at nearly similar wavelengths to those of pure water. The fact that 90% of human blood plasma is water11hampers to measure blood glucose level with optical methods.
In this study, we investigate the feasibility of measuring blood glucose by using NIRS. For this purpose, we use two LEDs with two different narrow emission bands to reduce the effects of environmental disturbances and a photo-diode to detect the transmitted light. Our experiments reveal the lack of specificity while measuring blood glucose level due to the presence of predominant -OH band. Our results are in agreement with the findings of studies on food analysis and chemical reactions.9,10
Further author information: (Send correspondence to N. Mert Vural) N. Mert Vural: E-mail: [email protected]
The remainder of this paper organized as follows: First we give some theoretical background in Section 2. The hardware design has been presented in Section3. Experiment setup and the results of the experiments are explained in Section4. The paper concludes with brief summary and future direction in Section5.
2. THEORETICAL BACKGROUND
2.1 Near Infrared Spectroscopy
Spectroscopic techniques are used to determine the presence of a specimen quantitatively by measuring how it interacts with light. In NIR spectroscopy, the specimen is irradiated with NIR radiation, which covers the range of the electromagnetic spectrum between 780 and 2500 nm, and the reflected and/or transmitted radiation is measured. While the radiation penetrates the specimen, its spectral characteristics are shaped as a result of wavelength-dependent scattering and absorption processes. The spectral signature depends on the chemical composition of the specimen, as well as on its light scattering properties, which are related to its structure at micro and nano scale.12 NIR and visible light spectra are widely used for biofluids such as blood, due to elevated
levels of absorption in H-containing bonds such as C-H, O-H and N-H, which are found very commonly found in biofluids.13
Glucose is an infrared-active component, which means that it absorbs the radiation at distinct wavelengths in the infrared region including near infrared.14 Glucose displays a unique near infrared absorbance spectrum
with strong absorption bands around 1573, 1709, 2105 and 2273 nm as can be seen on Figure3. Using this fact, many researchers have long tried to develop a device to measure blood glucose noninvasively.
(a) (b)
Figure 1: Near Infrared Spectra of Glucose between a) 1500-1850 nm b) 2000 and 2400 nm after water subtrac-tion15
2.2 Wavelength Selection
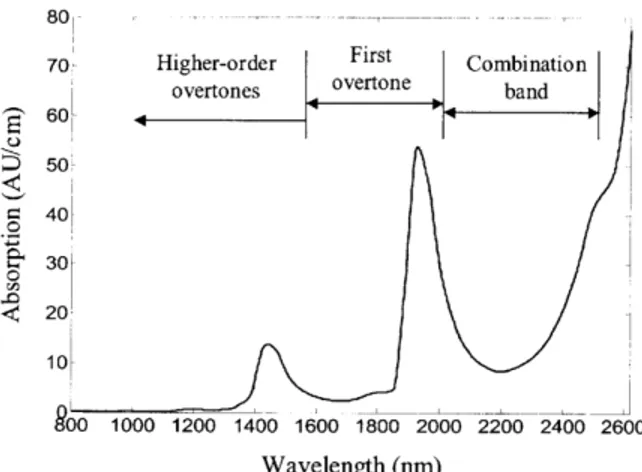
Water is the main component of blood and tissue; therefore, its absorption spectrum plays an important role in determining the availability of certain spectral regions for blood glucose measurement. If water absorbs too strongly, the detected light would be weak, which would result in low measurement signal-to-noise ratio (SNR). This is in fact the reason why in vivo blood measurement using the mid-infrared light has proved to be extremely difficult.14
In near infrared region, glucose has a number of absorption peaks. Before selecting one of them, we need to consider the water spectra in this region as well. As can be seen in the Figure2, as the wavelength approaches the visible light region, water absorption decreases. Therefore, although glucose absorption in the spectral region between 2000-2500 nm is relatively higher than the one between 1200-1800 nm, the fact that water have strong absorbance between 2000-2500 nm lead us to select wavelength between 1200-1800 nm.
We select two different wavelengths in the spectral region between 1200-1800 nm. The first wavelength (1550 nm) is selected where glucose absorbance spectrum has local maximum, in other words where the change in light intensity is most sensible to the concentration level of glucose. The second wavelength (1300 nm) is selected where glucose absorbance spectrum has local minimum to compensate for environmental fluctuations, mainly temperature.
Figure 2: Water absorption spectrum per 1-cm path length.14
2.3 Instrumentation
Two modes of visible-near infrared spectroscopic measurement are mainly used for NIRS measurements: re-flectance, and transmission. Reflectance mode measurements benefit from relatively high levels of detected light. However, calibrations may be susceptible to variations in superficial or surface properties of the sample. Trans-mission mode measurements may be less susceptible to surface properties and are better for detecting internal disorders than reflectance mode measurements. However, the amount of light penetrating the sample is often very low, making it difficult to obtain accurate transmission measurements, particularly in conditions of high ambient light levels.16
We constructed a transmission-based and a reflection-based setup. Our initial results demonstrated that we could obtain more reliable data using the transmission-based setup with a mechanism to reduce ambient light interference. We believe that the variations over skin surface among different people prevent us from obtaining reliable data using reflection signal. Therefore, we report the transmission mode in this study.
3. HARDWARE DESIGN
3.1 Emitter Design
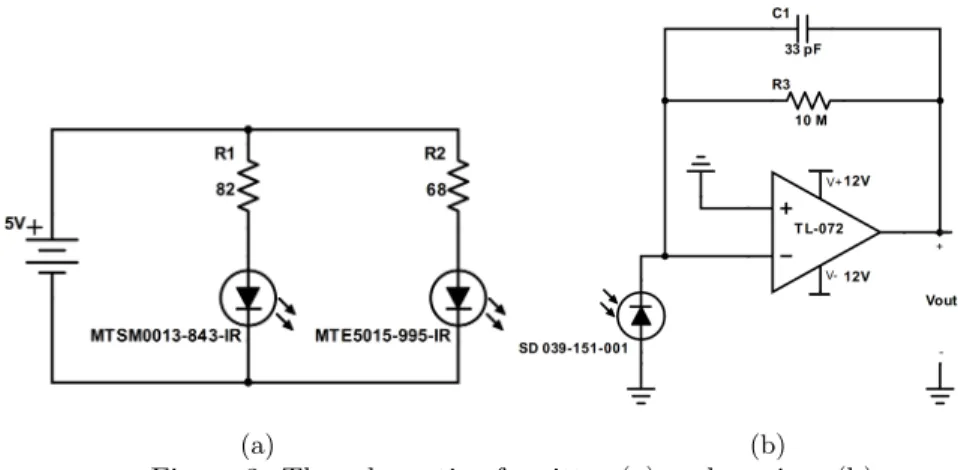
We used 2 LEDs with different peak wavelengths at 1550 nm (MTE5015-995-IR, Marktech Optoelectronics, New York, USA) and 1300 nm (MTSM0013-843-IR, Marktech Optoelectronics, New York, USA) in our emitter circuit. In the specific implementation, the reference emitter is at 1300 nm, and the signal emitter is at 1550 nm as suggested by the absorption spectrum of glucose. Based on current-voltage characterization, we chose supply voltage as 5V, R1 as 80 Ω and R2 as 68 Ω. (Figure3a)
3.2 Transmitter Design
In the receiver part, we used an InGaAs photodiode with high responsivity in our operational spectral band (SD 039-151-001, Luna Innovations Inc., VA, USA), which is capable of detecting both emitters. We operated the photodiode in photovoltaic mode to minimize noise.
We employed a transimpedance amplifier to convert low photodiode current to voltage, in which we used a conventional OPAMP with JFET input stage (TL072, Texas Instruments) for its low-noise, low input bias and no offset current features. We determined the value of feedback resistor (or simply gain) as 10 MΩ to obtain adequate output levels based on the typical amount of light detected in our transmission setup. Based on our frequency response characterization of the transmitter circuit, we used a feedback capacitor of 33 pF for stability. (Figure3b)
(a) (b)
Figure 3: The schematic of emitter (a) and receiver (b)
4. EXPERIMENTS
4.1 Experiment Setup
We fixed a transparent test tube located in the middle of the LEDs and the photodiode as shown in Figure 4. We used a faucet mechanism at the bottom of the experiment tube in order not to disturb the position stability while draining the specimen solution. We covered the setup with a lightproof box to eliminate ambient light and also used a digital thermometer to track temperature to compensate for the effect of temperature fluctuations.
(a) (b) (c)
Figure 4: The 3D sketch of the experiment setup
In the experiments, we used D-Glucose, D-Fructose and sucrose dissolved in distilled water. To reduce the effect of residuals, we cleaned the test tube using distilled water after every measurement. We gathered data fifteen times for each concentration level in one experiment and repeated all experiments regularly in three weeks to obtain statistically significant data.
4.2 Results
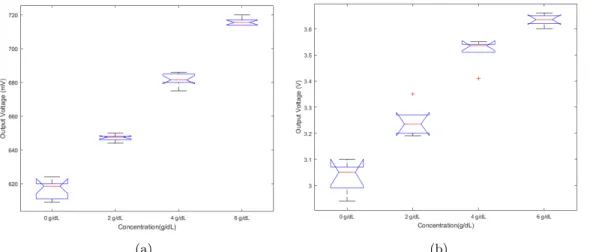
We first examined the relationship between glucose concentration and the transmitted light intensity. Although the glucose concentration in human blood varies between 60-200 mg/dL,17 we worked with much higher
con-centration levels (0-6 g/dL) to amplify its effect. The results show that the intensity of the transmitted light increases with glucose concentration (Figure5). This finding is unexpected since absorption of light should have increased with glucose concentration, which should result in decreasing transmission. After careful investigation, we explain the results with ”volume effect” theory: ”When glucose is added into water, the number of water molecules in the same volume will be reduced. This will weaken the total absorption of water in the spectrum
because the spectrum is measured with a definite sample volume, or more exactly, the volume of the light path is definite. In fact, when solute is added into water the volume will change more or less.”18
(a) (b)
Figure 5: The result of the experiment examined the relationship between glucose concentration and transmitted light intensity: (a) 1550 nm (b) 1300 nm
As can be inferred from the theory, we cannot get any solvent-related information from the change in light intensity but only detect the impurity level of water due to domination of water absorbance. To be sure, we conducted an experiment using fructose, glucose and sucrose and compared the results (Figure6). As can be seen on the figure, the intensity change is almost identical although their absorbance spectrums are different.19
(a) (b)
Figure 6: The results of the experiment examined the difference between the effects of glucose, fructose and sucrose concentration on the output light intensity: (a) 1550 nm (b) 1300 nm
5. CONCLUSION
In this paper, we present the results of our experiments conducted to detect glucose noninvasively by using NIRS. Our results using different types of sugar molecules support the fact that the measured signal is only correlated with the impurity of water in the solution. Our results support the suggestion that glucose-specific information cannot be inferred by the change in light intensity due to strong water absorption in NIR region.
REFERENCES
[1] Kraitl, J., Timm, U., Ewald, H., and Lewis, E., “Non-invasive measurement of blood components,” in [2011 Fifth International Conference on Sensing Technology ], 253–257 (Nov 2011).
[2] Iftimia, N. V., Hammer, D. X., Rosen, D. I., Bigelow, C. E., and Ferguson, R. D., “Noninvasive monitoring of blood composition,” Proc.SPIE 6080, 6080 – 6080 – 7 (2006).
[3] Liu, X., Yuan, X., and Zhang, Y., “Noninvasive blood pressure measurement scheme based on optical fiber sensor,” Proc.SPIE 10155, 10155 – 10155 – 8 (2016).
[4] Cengiz, E. and Tamborlane, W. V., “A tale of two compartments: interstitial versus blood glucose monitor-ing,” (2009).
[5] Lipson, J., Bernhardt, J., Block, U., Freeman, W. R., Hofmeister, R., Hristakeva, M., Lenosky, T., McNa-mara, R., Petrasek, D., Veltkamp, D., and Waydo, S., “Requirements for calibration in noninvasive glucose monitoring by raman spectroscopy,” Journal of Diabetes Science and Technology 3(2), 233–241 (2009). [6] Liakat, S., Bors, K. A., Xu, L., Woods, C. M., Doyle, J., and Gmachl, C. F., “Noninvasive in vivo glucose
sensing on human subjects using mid-infrared light,” Biomed. Opt. Express 5, 2397–2404 (Jul 2014). [7] Fei, S., Kong, D., Mei, T., and Tao, Y., “Near-infrared spectral methods for noninvasively measuring blood
glucose,” Proc.SPIE 5281, 5281 – 5281 – 7 (2004).
[8] Smith, J. L., [The Pursuit of Non-invasive Glucose: Hunting the Deceitful Turkey ] (2017 (fifth edition)). [9] Venyaminov, S. and Prendergast, F., “Water (h2o and d2o) molar absorptivity in the 1000-4000 cm-1 range
and quantitative infrared spectroscopy of aqueous solutions,” Analytical Biochemistry 248, 234–245 (6 1997). [10] Bning-Pfaue, H., “Analysis of water in food by near infrared spectroscopy,” Food Chemistry 82(1), 107 –
115 (2003). 2nd International Workshop on Water in Foods.
[11] Roggan, A., Friebel, M., Doerschel, K., Hahn, A., and Mueller, G. J., “Optical properties of circulating human blood in the wavelength range 400-2500 nm,” Journal of Biomedical Optics 4, 4 – 4 – 11 (1999). [12] Nicola, B. M., Beullens, K., Bobelyn, E., Peirs, A., Saeys, W., Theron, K. I., and Lammertyn, J.,
“Nonde-structive measurement of fruit and vegetable quality by means of nir spectroscopy: A review,” Postharvest Biology and Technology 46(2), 99 – 118 (2007).
[13] Chuannan, B., Noninvasive near infrared spectroscopy on living tissue with multivariate calibration ap-proaches, PhD thesis, University of Iowa (2010).
[14] Saptari, V. A., A Spectroscopic System for Near Infrared Glucose, PhD thesis, Massachusetts Institute of Technology (2004).
[15] Lafrance, D., Near Infrared Determination of Lactate in Biological Fluid and Tissues, PhD thesis, McGill University (2003).
[16] Schaare, P. and Fraser, D., “Comparison of reflectance, interactance and transmission modes of visible-near infrared spectroscopy for measuring internal properties of kiwifruit (actinidia chinensis),” Postharvest Biology and Technology 20(2), 175 – 184 (2000).
[17] Freckmann, G., Hagenlocher, S., Baumstark, A., Jendrike, N., Gillen, R. C., Rssner, K., and Haug, C., “Continuous glucose profiles in healthy subjects under everyday life conditions and after different meals,” Journal of Diabetes Science and Technology 1(5), 695–703 (2007).
[18] Cui, X., Cai, W., and Shao, X., “Glucose induced variation of water structure from temperature dependent near infrared spectra,” RSC Adv. 6, 105729–105736 (2016).