BANK VALUATION- TURKISH EVIDENCE
Hüseyin Öztürk
104664027
STANBUL B LG ÜN VERS TES
SOSYAL B L MLER ENST TÜSÜ
ULUSLARARASI F NANS YÜKSEK L SANS PROGRAMI
Tez Dan man :
Prof. Dr. Oral Erdo an
STANBUL 2007
BANK VALUATION TURKISH EVIDENCE
BANKA DE ERLEMES TÜRK YE MODEL
Hüseyin Öztürk
104664027
Tez Dan man n Ad Soyad ( mzas ): Prof.Dr.Oral Erdo an :... Jüri Üyelerinin Ad Soyad ( mzas ): Prof.Dr.Erol Kat rc o lu :... Jüri Üyelerinin Ad Soyad ( mzas ): Dr.Nebil lseven :...
Tezin Onayland
Tarih :...
Toplam Sayfa
:240
Keywords Anahtar Kelimeler
1) Valuation 1) De erleme
2) Bank Valuation 2) Banka De erlemesi
3) CAPM 3) CAPM
4) Bank Analysis 4) Banka Analizi
5) CAMEL 5) CAMEL
6) Credit Risk 6) Kredi Riski
7) Market Risk 7) Piyasa Riski
8) Off-Balance Sheet 8) Bilanço D
lemler
9) Bank Premiums 9) Banka Primleri
10) Bank Merger & Acquisition 10) Banka Birle me ve Devralmas
Abstract
This study investigates alternative approaches to the valuation of banks. Many valuation approaches has been developed in finance literature. The study describes the similarities and variances of those approaches. On the one hand, the bank valuation followed the same approaches and techniques with non-bank firms on the other hand; it presents some difficulties comparing non-bank firms. Unique specific services of the commercial banking necessitate different approaches and techniques through the value. The main aim of banks is to get profit from margin between borrowed funds and placed funds. Then all else, credibility of the placed funds comes into mind in order to assess the worth of a bank. The market risk of a bank can easily be measured and hedged, whereas credit risk cannot. Thus, the following study involves a comprehensive literature survey on; Credit risk exposures and Bank analysis. Finally, a bank valuation methodology is presented in order to forecast future cash flows depending on the existing balance-sheet structure and profitability ratios. The methodology involves a technique of measuring credit risk by using the risk weighted assets footnote. The methodology is used to valuate commercial banks in Istanbul Stock Exchange. Findings of the study provide strong evidence that recent bank deals in Turkey have not been overpaid. The average Sales Value / Book Value ratio of last two year s bank deals used in the paper is 3,09. Supporting this, the average DCF Value / Book Value ratio of the DCF methodology presented in the paper is 3,57. This finding may not be interpreted that banks have been sold cheaply but Turkish banks getting closer to their intrinsic values after 2001 economic crises.
Özet
Bu çal ma banka de erlemesi konusunda alternatif yakla mlar incelemektedir.Finans literatüründe birçok de erleme yakla mlar geli tirilmi tir. Çal ma, bu yakla mlar aras ndaki benzerlik ve farkl l klar ortaya koymaktad r. Banka de erlemesi bir taraftan banka d firma
de erlemesi ile ayn yakla m ve teknikleri izlemekle beraber di er taraftan banka d firmalarla
kar la t r ld nda baz zorluklara sahiptir. Bankalar n kendine has yap s , de erleme için farkl yakla m ve teknikleri zorunlu k lar. Bankalar n ana amac borçlan lan fonlarla borç verilen fonlar aras ndaki marjdan kar elde etmektir. Bu nedenle, bir bankan n varl klar n de erlendirebilmek için her eyden önce verilen borçlar n kredibilite konusu akla gelir. Bir bankan n piyasa riski kolayl kla ölçülebilir ve korunulabilir. Ancak kredi riski kolayl kla ölçülemez ve korunulamaz. Takip eden çal ma kredi riski tutar ve banka analizi konusunda kapsaml bir literatür incelemesi sunmaktad r. Son olarak bankalar n gelecek nakit ak mlar n tahmin etmek için mevcut bilanço yap s ve karl l k rasyolar na dayanan bir de erleme metodolojisi sunulmu tur. Bu metodoloji; risk a rl kl aktifler dipnotunu kullanarak kredi risk ölçümü hesaplama tekni ini de içermektedir. Metodoloji, stanbul Menkul K ymetler Borsas nda i lem gören ticari bankalar n de erlemesi için
kullan lm t r. Çal man n sonucu, son zamanlarda yap lm olan banka sat lar nda yeralan
fiyatlar n olmas gerekenden fazla olmad na kuvvetli bir kan t sa lam t r.Çal mada kullan lan
bankalar n son iki y ldaki sat i lemlerinin ortalama Sat De eri / Defter De eri rasyosu 3.09 dur. Buna destekleyici olarak çal mada sunulan DCF metodolojisine gore bulunan DCF De eri / Defter De eri rasyosu 3,57 dir. Bu bulgu, Türk bankalar n n ucuza sat ld eklinde yorumlanmayabilir; ancak bankalar n 2001 ekonomik krizi sonras nda gerçek de erlerine yakla t eklinde de erlendirilebilir.
TABLE OF CONTENTS
List of Tables . ...IX
Abbreviations... X
1 INTRODUCTION ... 1
2 VALUE ... 2
2.1 Intrinsic Value... 2
2.2 Fair Market Value ... 2
2.3 Investment Value ... 3
2.4 Fair Value ... 3
2.5 Goodwill Value... 3
2.6 Going Concern Value ... 3
2.7 Book Value ... 3
2.8 Liquidation Value ... 4
2.9 Replacement Value ... 4
3 VALUATION... 5
3.1 Discounted Cash Flow Model / Income Approach ... 5
3.1.1 Types of DCF models ... 6
3.1.1.1 Free Cash Flow to Equity ... 6
3.1.1.2 Free Cash Flow to Firm ... 7
3.1.2 Discount Rate ... 7
3.1.2.1 Risk Free Interest Rate ... 7
3.1.2.2 Risk Premium ... 8
3.1.2.3 Capital Asset Pricing Model (CAPM) ... 8
3.1.2.4 Weighted Average Cost of Capital (WACC) ... 9
3.1.3 Terminal Value ... 9
3.1.3.1 Liquidation Value ... 10
3.1.3.2 Multiple Approach ... 10
3.1.3.3 Stable Growth Model ... 10
3.2 Residual Income Model... 10
3.2.1 Economic Profit (EP)... 11
3.2.2 Market Value Added (MVA)... 12
3.2.3 Economic Value Added (EVA®)... 12
3.2.4 Cash Value Added (CVA) ... 13
3.2.5 Cross-Comparison of Residual Income Models... 13
3.2.6 Comparing Residual Income Models with DCF ... 15
3.3 Relative Valuation / Market Approach ... 16
3.3.1 Earnings Multiples ... 17
3.3.2 Book Value Multiples ... 17
3.3.3 Revenues Multiples... 17
3.3.4 Sector Specific Multiples... 18
3.4 Net Asset Value Model / Balance Sheet Approach ... 18
4 BANK VALUATION ... 20
4.1 Analysis of Commercial Banks Financials ... 23
4.1.1 Analysis of Assets... 24
4.1.1.1 Cash and Banks ... 24
4.1.1.2 Reverse Repo... 25
4.1.1.3 Fixed Income Securities ... 25
4.1.1.3.2 Coupon Bond... 26
4.1.1.4 Loans and Leasing Receivables ... 26
4.1.1.4.1 Consumer Loans ... 27
4.1.1.4.2 Commercial Loans... 27
4.1.1.4.3 Financial Leasing ... 29
4.1.1.4.4 Mortgages ... 29
4.1.1.5 Non-Performing Loans... 30
4.1.1.6 Tangible Fixed Assets ... 31
4.1.1.7 Intangible Assets ... 31
4.1.1.7.1 Core Deposit ... 31
4.1.1.7.2 Safe Deposit Contracts ... 33
4.1.1.7.3 Banking System Software ... 33
4.1.1.7.4 Trust and Mutual Funds Accounts ... 33
4.1.1.7.5 Goodwill... 33
4.1.1.8 Investment ... 34
4.1.1.9 Deferred Tax Assets... 34
4.1.1.10 Other Assets ... 35
4.1.2 Analysis of Liabilities ... 35
4.1.2.1 Customer Deposits ... 35
4.1.2.1.1 Non Interest Bearing Deposits... 36
4.1.2.1.2 Interest Bearing Deposits... 36
4.1.2.2 Certificate of Deposits ... 36
4.1.2.3 Bank Borrowings ... 36
4.1.2.4 Loans Received ... 37
4.1.2.5 Deferred Tax Liabilities ... 37
4.1.2.6 Retirement Benefits ... 37
4.1.2.7 Shareholders Equity ... 38
4.1.3 Analysis of Off-Balance Sheets ... 38
4.1.4 Analysis of Bank Income... 39
4.1.4.1 Net Interest Income ... 39
4.1.4.2 Non Interest Income ... 39
4.1.4.3 Non-Interest Expense ... 40
4.1.4.4 Provisions ... 40
4.2 CAMEL Model as an Integrated Bank Analysis Instrument... 40
4.2.1 Capital... 41
4.2.2 Asset Quality ... 42
4.2.3 Management and Productivity ... 42
4.2.4 Earnings... 43
4.2.5 Liquidity and Assets & Liability Management... 44
4.3 Credit Risk Valuation ... 45
4.3.1 Valuation of Individual Risky Loans and Bonds... 47
4.3.1.1 Default Risk Models ... 47
4.3.1.2 Qualitative Models... 47
4.3.1.2.1 Borrower Specific Factors ... 47
4.3.1.2.2 Market Specific Factors ... 48
4.3.1.3 Credit Scoring Models... 48
4.3.1.3.1 Linear Probability Model and Logit Model ... 49
4.3.1.3.2 Linear Discriminant Models... 49
4.3.2 Market-Based Risk Models... 50
4.3.2.2 Mortality Models ... 51
4.3.2.3 Raroc Model ... 52
4.3.2.4 Option Models of Default Risk ... 53
4.3.3 Valuation of Risky Loans and Bonds Portfolios ... 56
4.3.3.1 Applications of MPT to Credit Risk Measurement... 57
4.3.3.2 Partial Applications of MPT to Credit Risk Measurement... 59
4.3.3.2.1 Loan Volume-Based Models ... 59
4.3.3.2.2 Loan Loss Ratio-Based Models ... 60
4.4 Off-Balance Sheet Valuation ... 60
4.4.1 Guarantees and Commitments... 61
4.4.1.1 Loan Commitments ... 61
4.4.1.2 Commercial Letters of Credit ... 63
4.4.1.3 Standby Letters of Credit ... 64
4.4.2 Derivatives ... 65
4.4.2.1 Futures and Forwards... 66
4.4.2.2 Options... 67
4.4.2.3 Swaps ... 70
4.4.3 Securitization ... 72
4.5 Off-Balance Valuation Models Literature Survey ... 73
4.6 General Contingent Claims Pricing Theory John Hull ... 78
5 MERGER AND ACQUISITIONS IN BANKING ... 81
5.1 The Motivations of Takeovers ... 81
5.1.1 Increasing Revenues ... 82
5.1.2 Decreasing Costs ... 84
5.1.3 Reducing Risks... 85
5.1.4 Agency Costs ... 87
5.2 The Determinants of Bank Merger Premiums ... 88
5.2.1 Research of T. H. Hannan S. A. Rhoades (1987) ... 88
5.2.2 Research of D. C. Cheng B. E. Gup L. D. Wall (1989) ... 90
5.2.3 Research of D. Palia (1993) ... 91
5.2.4 Research of R. Jackson A. Gart (1999)... 93
5.2.5 Research of T. J. Shawyer (2002) ... 94
6 THE BANK VALUATION TURKISH EVIDENCE ... 96
6.1 The Methodology ... 97
6.1.1 Balance Sheet Drivers ... 97
6.1.2 P&L Drivers ... 99
6.1.3 Valuation ... 100
6.1.4 Discount Rate ... 100
6.1.4.1 CAPM ... 101
6.1.4.2 Dividend Growth Model ... 103
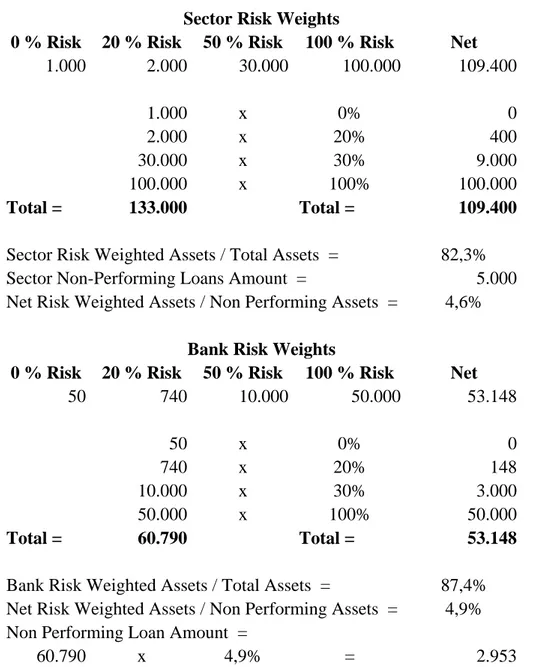
6.1.5 Credit Risk Measurement... 105
6.2 Results of the Valuations... 107
6.2.1 Akbank ... 108 6.2.2 Alternatifbank... 109 6.2.3 Denizbank... 109 6.2.4 Finansbank ... 109 6.2.5 Fortisbank ... 109 6.2.6 Garanti Bankasi... 110 6.2.7 Isbank ... 110 6.2.8 Sekerbank... 110
6.2.9 TEB ... 110 6.2.10 Tekstilbank... 111 6.2.11 Vakifbank ... 111 7 CONCLUSION ... 112 References... 114 1 Annex 1 ... 123
1.1 EVA, EP and MVA of a company without debt. ... 123
1.2 Cash Value Added of a Company Without Debt... 124
1.3 EVA,EP and MVA... 125
1.4 Cash Value Added ... 126
1.5 EVA,EP and MVA of a company without debt ... 127
1.6 Illustration of Historical Retention Rate Calculation ... 129
1.7 Calculations of Projected Balances of Acquired Deposit Accounts ... 130
1.8 Cost Saving Approach to Valuation of Core Deposit Base... 131
1.9 Corporate Bond Total New Issue Amounts by S & P Bond Rating... 133
1.10 Adjusted Mortality Rates... 135
1.11 Average Price After Default by Original Bond Rating ... 136
1.12 Average Price After Default by Number of Years After Issuence ... 137
1.13 Yield to Maturity on Various Bond Rating Categories... 138
1.14 Risk-Adjusted Performance Measurements ... 139
2 Annex 2 ... 143 2.1 Akbank ... 143 2.2 Alternatifbank... 151 2.3 Denizbank... 159 2.4 Finansbank ... 167 2.5 Fortisbank ... 175 2.6 Garanti Bankasi... 183 2.7 Isbank ... 191 2.8 Sekerbank... 199 2.9 TEB ... 207 2.10 Tekstilbank... 215 2.11 Vakifbank ... 223
LIST OF TABLES
Table 1 Top Financial Firms by Market Capitalization ...81
Table 2 Global Wholesale Banking Market Concentration ...84
Table 3 The list of Balance Sheet Drivers...98
Table 4 The list of P/L Drivers ...100
Table 5 Comparative Returns of IMKB and Treasury Bonds ...102
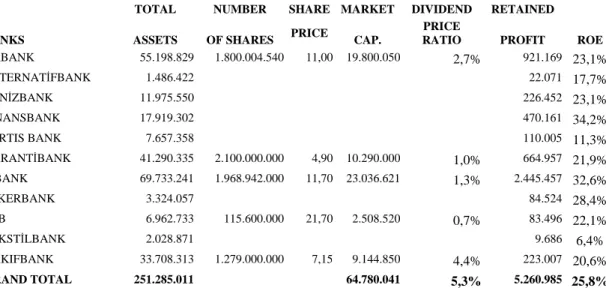
Table 6 Dividend Rate of Turkish Banks in IMKB in 2006 ...104
Table 7 Dividend and Retained Earnings of Turkish Banksin IMKB in 2006 ...104
Table 8 Banking Sector Yearly Assets Growth...105
Table 9 Calculation of Banks Non-Performing Assets Amount and Provisions...105
Table 10 Comparative Values of Turkish Commercial Banks in IMKB 1 ...107
Table 11 Comparative Values of Turkish Commercial Banks in IMKB 2 ...108
ABBREVIATIONS
DCF Discounted Cash Flow
CAPM Capital Asset Pricing Model
NOPAT Net Operating Profits Less Adjusted Taxes
DDM Dividend Discount Model
EVA Economic Value Added
EP Economic Profit
EBIT Earning Before Interest, Tax
EBITDA Earning Before Interest, Tax, Depreciation, Amortization
ALM Asset and Liability Management
MTM Mark to Market
GAAP Generally Accepted Accounting Principles
IFRS International Financial Reporting Standards
PV Present value
CD Certificate of Deposits
OTC Over the Counter
ROE Return on Equity
ROA Return on Assets
HHI Herfindahl-Hirschman Index
M&A Merger and Acquisitions
BDDK Turkish Banking Supervisory Authority
IMKB Istanbul Stock Exchange
TCMB Central Bank of Turkey
FX Foreign Currency
IRR Internal Rate of Return
1
INTRODUCTION
The firm valuation techniques come together with the valuation techniques of single stocks that have a long history together with stock markets. But modern valuation era starts with Graham and Dodd. They introduced the concept of Intrinsic Value , which is not necessarily the same price of the stock. Until that time, stocks had been valuated with dividend capitalisation, which are Price/Earnings per share multiplier in today s financial literature and book value. Companies paying more dividends were valued more compared to lesser dividend paying companies. But people were not searching what the earnings were of; or the real worth of a firm. After 1929 crises, stock prices crashed beyond reason. But difficulty started with choosing better among cheaper stocks. In their Security Analysis ; Benjamin Graham and David Dodd defined intrinsic value as that value which is justified by facts as distinct from market quotations established by artificial manipulation or distorted by psychological excesses . In order to find intrinsic value, Graham and Dodd advised to look at a given firm s earnings instead of dividends. Graham and Dodd presented figure of 10 times of earnings as prices. If market prices of stocks are ten times of firms earnings, intrinsic value is equal to market value. If ratio is lower than 10, than market price is cheaper than intrinsic value, if not, then it is to be considered expensive.
Although discounted cash flow is presented as the best way to calculate intrinsic value, the DCF could not be popular for a long time. The advantage of DCF derives from its ability to assess stable or unstable future earnings. Preinreich (1932) presented present value of growing future earnings. He argued that multiples valuation is only possible in a stable world. Gordon Myron used his growth models to value a firm with a constant and infinite rate of growth. Just before CAPM, Bauman (1963) wrote Estimating the Present Value of Common Stocks by the Variable Rate method and formulated The Capital Assets Pricing Model (CAPM) helped DCF model in getting more scientific and true discount rate and off course intrinsic value with Sharpe (1964). But popularity of DCF model started with 1990 technological firms booms. Internet and other high growth technological companies made impossible to use P/E ratios that was the popular valuation technique among financial analysts. They were compelled to find intrinsic value of the companies and discount irregular expected future cash flows.
2
VALUE
Before starting Valuation, the term of value should be understood well. The term of value is not a clear understandable word. The meaning of the concept changes according to the context it is utilised. In our context, the value means economic [monetary] value. In other words it means how much a product or service is worth vis-à-vis other goods and services. As it is a common belief that price and value are not one and the same.
According to S. Keen the term value refers to the innate worth of a commodity, which determines the normal ('equilibrium') ratio at which two commodities are in exchange.
Economist L. V. Mises argued that value had always been qualitatively subjective; that there was no value intrinsic to objects or elements and that; value derived entirely from the psychology of the participants of the market. It was false to say that the economic value of a good was equal to what it cost to produce or to its current replacement cost.
The value should basically be understood as real value or actual value . It is the measure of worth that is based purely on the utility derived from the consumption of a product or service. There are many concepts of value in the professional literature, of which we will attempt to explain below.
2.1 Intrinsic Value
The intrinsic value is the most defining word of value in the context of valuation. It is used amongst financial analysts in reference to the fundamental value of a stock based on all of the facts and circumstances of a firm and its investment environment. In other words, it is value of the given company based on its earning power and earning quality. The earning power is the firm s capacity to make profit. The earning quality is the capacity of the firm to continue to stabilize the said profit.
The intrinsic value generally defined as the present value of the future cash flows discounted with market yield.
2.2 Fair Market Value
The implication of this concept is the oft-used concept of value in everyday life. It is a quantity that is expressed in cash or equivalent, at which a property or an asset would be exchanged between a willing buyer and willing seller, each having reasonable knowledge of all related facts, neither being under compulsion to buy or sell and with equity to both. In this definition the fact should be borne in mind that willing buyer and seller are hypothetical more
than particular. Hypothetical willing buyer and seller are most likely buyer and seller. As a result, it is most likely that fair market value is in fact the transaction price .
2.3 Investment Value
This term of value is generally used in mergers and acquisitions. It reflects the intentions of a potential buyer;
Perceived synergy and value aggregation opportunities Desire to enter into a new market
Perception of exposure and/or volatility of the asset s earning power Tax status and planning
Optimism
Those intentions and factors influence the investment value. Since investment value depends on personal circumstances of buyers, it may change from one willing buyer to the other.
2.4 Fair Value
Fair value is based on quoted market prices, where available. If listed prices or quotes are not available, fair value is based on internally developed models that primarily use market based or independent information as inputs to the valuation model [Due diligence exercises]. In recent years Fair value has become a key term. International Accounting Standards (IAS) or International Financial Reporting Standards (IFRS) after 2002, embrace fair value assessment as comprehensively as possible. For that reason it is much easier to value a firm by looking at its financial factors.
2.5 Goodwill Value
This is a specific type of an intangible asset that arises from a merger or acquisition process. Goodwill is the difference of the price paid for an acquired business and the fair market value of the assets acquired net of liabilities. This is to suggest that; goodwill value is the difference between fair market value and the investment value of the buyer.
2.6 Going Concern Value
This concept is brought in to play when a business is being valued as a viable operating unit, without an immediate threat of discontinuance of operations.
2.7 Book Value
The book value of an asset is the historical cost minus accumulated depreciation of that asset. It does not bear an economic meaning. It reflects accounting results of the entity. For a business, book value is total book value of individual assets minus total book value of individual liabilities. In accounting this is also called net worth or book equity .
The book value and the fair market value have no direct relation. In some cases book value and fair market value may coincide but most of the time, they differ from each other. But it should be borne in mind that the level of difference between book value and fair market value indicate to investment value or market trend. One of the other benefits of the book value is that it also is an indicator as to whether the sale had been exceedingly costly or not. In cases where Sale value/ Book value is a higher ratio than average weighted ration (P/B) is an indication that the process had been costly. However, in countries where lengthy periods of hyperinflation had been persistent, book values should be adjusted according to the figures of inflation. Otherwise, book value cannot function as reference on the value of the firm.
2.8 Liquidation Value
It is the net collectible sum in case the business is terminated. According to causes of liquidation, there are two types of liquidation processes;
Forced Liquidation; The net amount that an asset will bring if exposed for immediate sale on the open market. But here seller is compelled to sell, buyer is free to buy and each party know this.
Orderly Liquidation; The net amount that an asset will bring if exposed to sale on the open market and with reasonable time allowed to find a buyer.
The term of net amount includes all costs relevant to liquidation. The liquidation value is the lowest amount vis-à-vis other concepts of value.
2.9 Replacement Value
The replacement value of an asset simply is the cost of acquiring a new asset of corresponding utility. The estimation of cost of replacement takes into account as to how an asset would be replaced with newer materials and current technology.
3
VALUATION
Valuation is the process of assessing the market value of a firm and/or components of it. This is to say that a firm can either be valued as a combined system or its assets, properties, derivatives, liabilities; intangible assets can be valued independently.
A valuation of a firm can be done for varying intentions. Those being; merger and acquisition, pricing common stocks on the exchange market, tax cases, disposal of firm s components, inheritance or legal causes. However, the subject matter of our study is assessing the value of firms for mergers and acquisitions purposes.
Valuation of a firm is primarily based on financial tables of the firm. For that reason, reliability of financial data is fundamentally crucial to the valuation process. Recently General Accepted Accounting Principles have started to locate on Fair Value principles. In addition to that, firms are compelled to be audited by independent auditors. This made the valuation process much easier compared to the previous times, when prevailing accounting principle was the Book Value and auditing by independent auditors was not mandatory. But financial information is not enough to assess the value of a firm. This requires a due diligence process.
The due diligence is the process of research and analysis to determine the value of the firm. The main purpose of due diligence is allowing the investigating party to find out everything that it needs to be known about the firm. The report on the target of an acquisition will, so far as possible, contain an analysis of the company's financial situation and prospects (including assets), contractual relationships with its customers and suppliers, legal risk, tax situation, employees, IT system and other matters relevant to the industry that the firm is participating in.
There are many models of valuation in the relevant literature. Some of them require many sophisticated minds whereas others are placed on the fundamental definitions of the finance. Although many valuation models have been developed during years, three main approaches and their main models have found great base both amongst academics and financial analysts. They are as follows;
Discounted cash flow models / Income Approach Relative Valuation / Market Approach
Net Asset Valuation / Balance Sheet Approach
3.1 Discounted Cash Flow Model / Income Approach
Discounted cash flow is the basis of the valuation. Almost all other models built on discounted cash flow model or utilise its outputs. To understand valuation process, we have to
know the discounted cash flow model well. Discounted cash flow models come from the rule of present value. Value of any asset is the function of cash flow of that asset; phases of those flows; and risk of the investment. This can be formulated as follows;
Value = t t r CF ) 1 ( ) ( + Terminal Value Where;
CF = future cash flows r = discount rate t = time
Discount rate (r) includes both; the risk-free interest rate and the risk. The model tries to find intrinsic value of the asset. (Damadoran, 2002) Value of the firm is calculated by discounted expected cash flows to the firm. Discount rate is weighted cost of capital. The vital question here is to estimate future discount rates and cash flows.
Since discounted cash flow is the basis of valuation, it is imperative to understand inputs of DCF to apply them to the other valuation models. Those inputs are cash flows, discount rate, beta concept related to risk and terminal value.
3.1.1 Types of DCF models
The DCF models change according to what will be valued. This valuation can be applied to value firm s equity alone or value of the firm itself. Although these two models use different definitions of cash flows and discount rate, they both use same mathematical models. The main problem here is to be careful in matching cash flows and discount rates. On the one hand, DCF model to the equity at the cost of capital may value upward the value of the equity. On the other hand, DCF model to the firm at weighted average cost of capital may value downward the value of the firm.
3.1.1.1 Free Cash Flow to Equity
Free cash flow to equity refers to shareholders shares from cash flow after all financial liabilities and fixed investment needs, which is calculated as follows;
Profit Before Tax + Depreciation
(-) Net Operating Capital Needs (Current Assets-Current Liabilities) (-) Debt Payments
+ New Borrowings + Fixed Capital Payments
(-) Tax
The DCF model to the equity can be expressed mathematically as follows; V = n t t 1 t e t k CFtoequity ) 1 ( Where;
n = life expectancy of the asset
CF to equity = Expected future cash flows to the equity in time t ke= Cost of Equity
3.1.1.2 Free Cash Flow to Firm
Free cash flow to a firm means cash flow to both shareholders and creditors. It is calculated as follows;
Operating Income (-) Tax
(+) Depreciation
(-) Fixed Capital Payments
(-) Net Operating Capital Requirements
The DCF model to the firm can be expressed mathematically as follows; V = n t t 1 t t WACC CFtofirm ) 1 ( Where;
n = life expectancy of the asset
CF to firm = Expected future cash flows to the firm in time t WACC = Weighted average cost of capital
3.1.2 Discount Rate
Discount rate is the crucial factor of the valuation process. The value of the firms is directly affected by discount rate. High discount rate decreases firm s value. On the other side, lower discount rate increases the value of the firm. Discount rate should both include; risk free rate and risk premium of investing on equities.
3.1.2.1 Risk Free Interest Rate
The risk-free interest rate is the interest rate that it is assumed can be obtained by investing in financial instruments with no risk. Since default risks of governments are too low, government bond s yields are used as risk free rate.
3.1.2.2 Risk Premium
If there is an opportunity of investing at government bonds with risk less interest rate, then to invest in equities should have higher return. Because of uncertain return, equity investor will not accept to get same return with government bond investors at the beginning of investment. The difference between risk-free rate and accepted rate of equity return is said risk premium. In his paper, entitled Portfolio Selection, which appeared in the 1952 Journal of Finance, Harry Markowitz primarily introduces this approach. He detailed mathematics of his approach and proposed that investors focus on selecting portfolios based on their overall risk-reward characteristics instead of merely compiling portfolios from securities that each individually has attractive risk-reward characteristics. Briefly, inventors should select portfolios, not individual securities. He created an efficient frontier of portfolios. An investor should select a portfolio that lies on the efficient frontier.
Other researchers, such as; Tobin, (1958) further developed Markowitz's work by adding a risk-free asset to the analysis, thus enabling leverage or de-leverage portfolios on the efficient frontier, hence leading to the notions of a super efficient portfolio and the capital market line. By advantage, portfolios on the capital market line are able to outperform portfolio on the efficient frontier.
3.1.2.3 Capital Asset Pricing Model (CAPM)
Although William Sharpe (1964) introduced Capital Asset Pricing Model, the model took roots from Harry Markowitz and James Tobin s works. CAPM divides a portfolio's risk into systematic and specific risk. Systematic risk is the risk of holding the market portfolio. As the market move, each individual asset is more or less affected. To the extent that any asset participates in such general market moves, that asset entails systematic risk. Specific risk is the risk of an individual asset. It represents the component of an asset's return, which is uncorrelated with general market moves. CAPM says that the market compensates investors for taking systematic risk but not for taking specific risk. This is because specific risk can be diversified away. When an investor holds the market portfolio, each individual asset in that portfolio entails specific risk, but through diversification, the investor's net exposure is just the systematic risk of the market portfolio. Systematic risk can be measured using beta risk metric. According to CAPM, the expected return of a stock equals the risk-free rate and the portfolio's beta multiplied by the expected excess return of the market portfolio. It is formulated as follows;
The Beta is financial elasticity of the share prices to the market prices as general. It is key factor in CAPM. It is formulated as follows;
Beta ( ) = ) ( ) ( , m m a r Var r r Cov Where;
Cov(ra,rm)= Covariance r firm to r market
Var(rm)= Variance r market
3.1.2.4 Weighted Average Cost of Capital (WACC)
WACC is the weighted average of the after-tax cost of debt and the cost of equity. The weighting for debt is the portion of debt to total capital, whereas the weighting for equity is the portion of equity to total capital. These weighting are based on market value instead of book value of debt and equity.
WACC is mathematically formulated as; WACC = ( L E xr ) +(e L D xr ) (1-d t ) c Where; E= Equity D= Debt
L = Total Liabilities (E+D)
e
r = Cost of equity d
r = Cost of debt c
t = Corporate tax rate
WACC is belonging to firm capital structure and borrowing capabilities. If the firm has the opportunity of borrowing from risk-free rate and portion of equity in total capital is low, then this most probably will lead to lower WACC. However, if the firm does not have low cost borrowing and has higher portion of equity in the total capital, this will lead to higher WACC.
3.1.3 Terminal Value
In DCF valuation, we try to find discounted cash flows of a firm at the future. But firms have unspecified lives unlike specific prefects. In this case we have difficulties of estimating
whole future cash flows. Using terminal value at the end of period estimated comes from these difficulties in the DCF valuation. There are three methods to find terminal value (Damodoran, 2002); Liquidation value, Multiple Approach, Stable growth model
3.1.3.1 Liquidation Value
Liquidation value is the estimation of sale price of firm s assets at the end of period estimated. But it is not so easy to estimate sales value of assets after long term. (Generally ten years is used to estimated future cash flows) For that reason some simplifications are done for estimation. One method is to add inflation effect in to book value of assets. The following formula is used for this way;
Expected Liquidation Value = Book Value x (1 + Inflation Rate)averagelif eofassets
After finding terminal value, the estimated debt value should be subtracted from this value to find net assets.
3.1.3.2 Multiple Approach
Multiple approaches is an estimation of terminal value based on the firm s earnings or revenues. Price to earnings or price to sales multiples can be used for this approach. But necessary steps should be taken using multiples method when estimating terminal value (Those steps will be explained in Relative Valuation Method)
3.1.3.3 Stable Growth Model
In this approach, it is assumed that the firm will continue to grow after terminal year. This is possible if the firm keeps some of the earning in the firm and those retained earnings will provide a constant rate of growth. This rate of growth cannot exceed the rate of growth of the whole economy in the long run but it can have a constant rate of growth lower than the economy s rate of growth. Similar to multiple approaches, this approach necessitates high attention in the valuation process. Because higher or lower stable rate of growth can affect value of the firm too much. Stable growth formula is presented below;
Terminal Value = ) ( 1 g r CashFlowt Where; g = Rate of growth
3.2 Residual Income Model
There are some other models built on discounted cash flow model. They are known as Residual income models (Excess Return Models). Many discussions and studies have been done to compare Residual Income Models and DCF models in the literature.
The residual Income Models find its roots on the studies of Feltham and Ohlson (1995). However, concept is much older than their ages (Discussion is done in the section of economic profit section below). In the DCF models, real cash flows are taken in to consideration. Nevertheless, this creates difficulties when valuing firms having high investment in the beginning years. Because DCF becomes negative and this make valuation difficult to analyse. On the other hand, RIM models use accrual basis accounting principles to find cash flows. They say that accrual accounting especially fair value accounting principles finds better results in valuation. General Residual Income is formulated as follows;
Residual Income = Net Profit (Equity book value x (Cost of equity))
The models dos not say that directly take accounting results. They suggest accounting adjustments to reach clean surplus accounting. The fair value accounting principles made easier RIM valuation. In this valuation equity market value is found by that formula;
Equity Market Value = Equity Book Value + Present Value of expected future residual incomes There are some other models built on residual income. They are Economic Profit, Market Value Added, Economic Value Added, and Cash Value Added.
3.2.1 Economic Profit (EP)
Alfred Marshall firstly used the Economic Profit concept in his book, Principles of Economics, 1890. Marshall defined economic profit as the excess of Entity s marginal revenue over its marginal cost. A firm generates returns greater than those required by investors is said to be earning economic profit.
Copeland in his Valuation (1995) book defines Economic Profit model as; Economic Profit = Invested Capital x (WACC ROIC)
WACC=Weighted average cost of capital) ROIC= Return on the invested capital
In the model entity value is defined as Invested capital at the beginning of period of forecast. The model says the value of the company equals the amount of capital invested plus a Premium equal to the present value of the amount of value created.
The formula by Copeland to calculate the continuing value of Economic profit;
CV = WACC EPt 1 + ) ( ) ( ) ( 1 g WACC WACC WACC ROIC X ROIC g NOPLATT Where; CV= Continuing Value
g= Rate of growth
If we come back again to Marshalian Economic Profit concept; in a perfectly competitive industry, equilibrium occurs when marginal revenue equals marginal cost. NOPLAT (net operating profit after tax) can be used to define his marginal revenue and WACC x Total Capital. Then in a perfectly competitive environment, Economic Profit (Stern Stewart calls it EVA) should be zero. Nevertheless, as he noted firms/industries might be in temporary disequilibrium because a new product or technological innovation can convey economic or abnormal profits on a firm that, ultimately, attracts competitors that, in turn, eventually erode these profits and force Economic Profit to be zero.
3.2.2 Market Value Added (MVA)
The MVA (market value added) seeks to measure a firm s value creation, and is the difference between the market value of the firm s equity (or market value of the new investment) and the equity s book value (or initial investment). Formulation to find MVA;
MVA (market value added) = Equity market value (price) - Equity book value 3.2.3 Economic Value Added (EVA®)
Among all models of residual income, EVA® became centre of the discussion since Stern
Stewart & Co presented and registered EVA®. The EVA® is simply the difference between the ROA and the WACC multiplied by the enterprise book value (debt plus equity). The formulation for EVA® is;
EVA = EBV x (ROA WACC) Alternatively;
EVAT= NOPATT- (DT 1+EBVT 1) x WACC
Where;
EBV= Enterprise book value ROA = Return of Assets D = Debt
Stern Stewart proposes accounting adjustments to reach economic book value. Although they are hundreds, some main adjustments are as follows;
+ Deferred taxes + LIFO reserve
+ Cumulative depreciation of goodwill + Un-capitalised goodwill
+ Allowance for stock obsolescence + Accrued R&D expenses
+Cumulative depreciation of R&D
+ Capitalization of non-cancellable contracts + Accrued losses from sale of assets
Adjustments to find Economic NOPAT is found as measuring periodical changes in the adjustments of economic book value
3.2.4 Cash Value Added (CVA)
The Boston Consulting Group proposes cash value added (CVA) as an alternative to the EVA®. CVA is NOPAT plus book depreciation (DEP) less economic depreciation (ED) less cost of capital employed (initial investment multiplied by the weighted average cost of capital). The formulation of CVA is:
CVAt = NOPATt + DEPt - ED - (D0 + Ebv0) WACC
3.2.5 Cross-Comparison of Residual Income Models
Erdogan, Berk, and Katircioglu (2000) wrote that Free Cash Flow and Corporate Valuation of Modigliani and Miller (1958; 1961) constitute main references to economic profit concept. However, the title Economic Profit concept was converted by Stern Stewart to EVA® (Economic Value Added) in 1990.
Accordingly, Erdogan, Berk, and Katircioglu (2000) have made a comparison between Economic Profit and Stewart s Economic Value Added (EVA®) in Turkish Stock Exchange. In their economic Profit Model, they used Gordon s Dividend Discount Model from the view of cost of capital.
In their analysis, they defined Economic Profit as follows; EP= NOPAT (C x COC)
= (ROI-WACC) x C Where;
NOPAT= Net Operating Profit + Financial Expenses
(Copeland NOPLAT does not include interest but he adds interest expenses when he calculates WACC)
C= Total Capital Employed) COC= Cost of Capital ROI= Return on Investment
(Here WACC does not include borrowings) They defined EVA as follows;
EVA= NOPAT= C (wd Rd + we [Rf + {E(Rm)-Rf } b im] =ROI [wd Rd + we{Rf + (E[Rm] R f ) b im} ] ) C Where;
wd = weight of debt to the total capital employed we = weight of equity to the total capital employed Rd = Cost of debt
Re = Cost of equity
In the formula, they used exactly same formula with Discounted Cash Flow Model using CAPM of Sharpe to calculate cost of equity and net income instead of cash flows.
In the comparison EVA®, model with the CAPM cost of capital and EP model with DDM were used. Since Turkish economy suffers from high inflation, high rate of short-term risk-free interest rate was insufficient to discount future cash flows. Instead, they used Gordon s dividend discount model to discount future cash flows. 123 non - financial firms data were used in the analysis.
According to evaluation of the results in the research, they found that due to the volatility of the risk free rate of returns and market risk, a reliable capital cost based on CAPM and short-term data cannot be used in emerging markets. Models that are more significant are made available by considering the dividend payout as the equity capital cost for companies. Nevertheless, and maybe more significantly, they showed that economic profit approach, which came from the previous century, is mathematically equivalent to discounted cash flow model. To use net income and WACC as performance measure is just up to the investment decisions.
In addition; market inefficiencies and uncertainty of future cash flows renders Economic Value Added model less reliable in comparing cash flows. As it is seen from above-quoted formulas, although the model finds its roots on classical discounted cash flow formula, the main difference is taking into consideration the net income instead of net operating cash flows.
Fernandez (2002) compared residual income models. According to his conclusion;
The information required to value a firm using the EP, EVA® and CVA is exactly the same as that required for valuing by means of cash flow discount. The present values of the EP, EVA® and CVA are equal to the MVA. Assessing the valuing of the firm by means of EP, EVA® and CVA gives the same result as valuing by cash flow discounting. Maximizing the present value of the EP, EVA® or CVA is equivalent to maximizing the value of the firm s shares. Maximizing a particular year s EP, EVA® or CVA is irrelevant: it may be the opposite to
maximizing the value of the firm s shares. The claim that the EP, EVA® or CVA measures the firm s value creation in each period is a tremendous error: it makes no sense to give the EP, EVA or CVA the meaning of value creation in each period. The EVA®, EP and CVA do not measure value creation during each period. Quantifying accrued value on the basis of Data accounting over a period is unattainable. Value almost depends on expectations.
It is quite possible that the EVA® and the economic profit in a given year may have been positive, and even higher than expected, but that the value of the firm or business unit has fallen because the business s expectations have deteriorated due to poor management.
The problems with EVA®, EP or CVA start when the desire is to give these parameters a context that they do not have: value and shareholder value creation always depends on expectations.
The comparative results of his studies can be seen in the annex 1.1:1.5.
Final emphasis on this sub=topic is that, Paulo (2003) argued that EVA® epistemologically non-sequitur, fails to satisfy the requirements of sound research methodology in terms of being a reliable and valid metric, and is unlikely to satisfy the requirement of Rule 702 of the Federal Rules of Evidence. He says that the use of EVA® is ethically questionable, and moreover in time is likely to result in class actions.
Paulo accuses EVA® the use of CAPM as basis of model in order to measure cost of capital, but CAPM defects to measure cost of capital in a non-efficient market world. CAPM is also questionable in efficient market world. He uses citations of Fama and French and other academics, who wrote on the apparent deficiency of CAPM, saying that CAPM is an undesirable way of calculating the cost of capital and should not be used for valuation purposes, not even as an approximation because of the serious average-return anomalies. Fama and French (2001) proposes dividend growth model in order to measure cost of capital.
Paulo does not only accuse of EVA® about theoretically defective, but also accuses about research methodology. He says that the main drivers of total shareholder return are not the type of fundamental accounting, economic, and financial information that is incorporated within the EVA® criterion.
3.2.6 Comparing Residual Income Models with DCF
The differences of RIM and DCF are not limited with using accounting earnings instead of free cash flows. The theoretical discussions focus on terminal value and adjustments to cost of capital. In DCF valuation, terminal value estimations are very important because of high portion in the valuation result. Under or over estimation of discount rate or market multiples results in big differences with valuation result and intrinsic value. Penman and Haas (1995) showed that the
DCF technique which forecasts free cash flows to the horizon and capitalizes expected terminal free cash flows is equivalent to specifying expected net debt plus capitalized financing flows as the terminal value in the dividend discount formula. The residual income technique that capitalizes terminal residual income is equivalent to capitalizing terminal income and adding the present value of dividends forecasted to the horizon.
Additionally, the quoted study suggests that; DCF techniques that specify capitalized operating income as the terminal value are equivalent to techniques that forecast accrual earnings, and are both equivalents to the dividend discount formula with the terminal values capitalized expected operating income less expected net debt. Correspondingly, differences in techniques are also identified. The accounting for investment and operating accruals on the horizon, and forecasting free cash flow distinguish DCF and residual earnings methods or residual income to the horizon not being an issue.
In contrast, Courteaua, Kaob, and Richardson (2000) argue that RIM is slightly outperformed by DDM and DCF with the ideal terminal values, an insight not previously documented in the literature. Nevertheless, the differences in pricing errors across the three valuation models are negligible.
Some of the studies argue that there are no significant differences between the two methods, hence even if there is an opportunity, DCF should be chosen. Tham (2001) says that; From a purely algebraic point of view, it is true that two models are equivalent. At a minimum, the current analysis and discussion has shown that from a conceptual point of view, in valuation, the residual income model is not superior to the cash flow model. Furthermore, in valuation, the cash flow model may be preferred to the residual income model because it is based on market values rather than book values. Ultimately, the appeal of residual income lays in the mistaken notion that residual income measures "value creation", whereas the discounted cash flow (DCF) method does not. But the process of discounting takes into account value creation". In short, what is the residual income approach? It is simply NPV re-expressed and repackaged in book values and accounting terms. The champion NPV is unfazed by the new arrival in the arena of valuation. As a tool in the ring of management, EVA® may have some importance, but in the crucial arena of valuation, EVA® does not stand a chance against the current champion. In spite of all the hype in the media, the new kid is simply an alter - ego
3.3 Relative Valuation / Market Approach
In relative valuation, the value of a firm is found by similarities among market assets. This is done by some ratios in the market. This method is widely used by professional equity analysts. There are some reasons that made this method widely used. Primarily, there is no need for
assumptions. Secondly, it is simpler than other models and easier to explain. Thirdly it reflects market reaction and price movements all the time. It includes ownership premiums. The important thing is to use appropriate ratios and industry figures in the calculation. There are some standard multiples groups that are explained below.
3.3.1 Earnings Multiples
The most used earning multiples is Price to Earning Ratio. Price to earning ratio is defined as, (PE) = Market price per share/earnings per share. Although ratio seems easy, definition of earnings causes a big problem here. They may well be; current earnings, future earnings or primary earning. Additionally changes in earnings affect the price of the share. In the worst-case scenario, it cannot be used for negative earnings.
Some of the earning multiples are as follows; Price/Earnings Ratio (PE)
Market Value/EBIT Market Value/EBITDA Value/Cash Flow
3.3.2 Book Value Multiples
Similar to PE ratio, Price to Book Value (PBV) is a common ratio in Book value multiples. PBV = Price per share / Book value of equity per share. Analysts find this ratio very useful because of those reasons; the book value is relatively stable which can be compared with unstable market prices. This gives idea about overvaluation of market prices. Further, this multiple can be used for the firm s negative earnings since negative book value is not as common as negative earnings. However, differences in methods of accountancy may influence the book value to a significant degree. Also, firms like technology or service firms, know how is much more important that firm assets. In such cases book value can prove to be irrelevant.
Some of the book values multiples as follows; Price / Book Value
Market Value / Book Value of Assets
Market Value / Replacement Cost (Tobinis Q) 3.3.3 Revenues Multiples
Two main revenue multiples are in existence. The oft-used one is Price to Sales ratio Price=Market value of equity/revenues. As in the PBV case, these ratios are affected by accounting practices, which should be taken in to account when valuating firms. Additionally these ratios cannot be applied as financial service firms like bank in which sales are not the case. Some of the revenues multiples are as follows;
Price / Sales per Share Market Value / Sales
3.3.4 Sector Specific Multiples
These multiples are used to measure efficiency and productivity in a specific sector. Some of them are as follows;
Value per commodity unit = (market value of equity + market value of debt-cash)/ number of units of the commodity in reserves,
Value per unit product= (market value of equity + market value of debt-cash)/ number of units produced etc.
3.4 Net Asset Value Model / Balance Sheet Approach
Net asset value is the difference between market value of the firm s assets and the liabilities of the firm. Net asset value measures values after selling whole assets and paying entire liabilities instead of going concern value of the firm. This is the most conservative approach in valuating a firm since it does not take firm s expected future revenues into consideration. The goodwill added to net asset value gives the value of the firm in this model. It is formulated as follows;
Net Asset Value= Market Value of Assets Market Value of Liabilities.
If the firm recorded its total assets and liabilities with market value in its financial table, the shareholder value would indicate the net asset value. For this reason, the trend in fair value accounting made financial tables to give more accurate figure of net assets value. Of course financial tables are not enough to give market value. In order to reach the figure, some adjustments should be carried out such as Held-to-maturity portfolio securities are accrued with its IRR value. So as to reach fair value of the firm, the difference between IRR value and market value should be added into firm financial table.
Provisioning should be employed/exercised properly; receivables, employee liabilities, legal liabilities, legal court-cases with potential financial implication. Receivables may not have secondary markets. In this case future cash flows should be taken into consideration. Inventories should be measured physically. They should be priced according to their quality or completion phase. (Raw materials or completed goods). Tangible assets (Real estates, machinery and equipment, office machines, valuation) should be made according to expertise value of the said assets. Mortgages or other limitations on tangibles should be checked with official registries. Intangible assets should be treated with care. Some intangibles (such as software) may not have any value in case of acquisition, but some others (goodwill, trademark, know-how) may have greater value more the registered cost/worth. Other assets should be treated case by case. For
example pre-paid expenses should be treated as cash. Additionally tax assets should be valued for any case. For example, in case of acquisition, tax assets may not have any value if acquiring firm has tax assets more than decreased from future profit. Liabilities should be checked according to their contacts. Contingencies should be treated according to their risks.
Generally, net asset valuation is made in following cases: If the firm is in a bad state
If the firm is not generating cash
If the firm assets are individually very valuable compared to the firm as a whole
In case of acquisitions, net assets valuation should be made together with other valuation models to compare results and to see value of goodwill.
4
BANK VALUATION
The valuation of commercial banks differs in many ways from other sector firms. These differences derive from some unique specialties of the commercial banks. Before studying bank valuation, commercial bank models and its roles in the economy should be studied. A commercial bank is a firm whose assets primarily include financial claims issued by borrowers, such as households, corporate firms, governments, and other financial intermediaries, and whose liabilities are sold as secondary claims to capital surplus units in various forms, such as demand deposits, saving deposits, term deposits, subordinated debt (loan capital), or equity shares. (Dermine, 2003) In addition to this, banks use their credibility s on behalf of customers and they offer non-cash loans such as letters of credit, note-issuance facilities, and letters of guarantees. Increasingly with financial techniques, bank use off balance hedging and speculating instruments in order to minimize their risks taken and to earn money. Those are said off-balance sheet activities of the banks.
Banks offer some specific unique services. These unique services can be (Dermine, 2003) distinguished in to five categories:
Underwriting and placement
A first service provided by financial intermediaries is to bring together savers and borrowers. Underwriting and placement of securities is a function, which help borrowers to meet surplus units, and structure or customize the type of securities that meet the risk and return requirements of borrowers and lenders. In a pure underwriting and placement service, it is assumed that the return and risk of the securities can be properly defined, so that there is no major problem of asymmetric information (agency problem) between lenders and borrowers.
Portfolio Management
Investors may wish to have diversified portfolio of securities. However, to keep these portfolios individually can be expensive and difficult to follow up. Instead of customers themselves, banks issue mutual funds and unit trust. By having shares of these mutual funds and trust, investors can diversify their investment.
Payment Mechanism
Another unique service of financial intermediaries is to manage payment mechanism throughout country and worldwide. Banks use inter-country central transfers systems and international corresponding services of other banks abroad. By this service, individuals, firms, and banks themselves make payment of third parties without sending physical money. These services
have been developed a lot with check, debit cards and credit cards adding these payment process credit card companies for international purchases and credit cards clearing services inside country purchases.
Monitoring and Information Related Services
Monitoring borrowers by individual investors can be very costly for them. Moreover, they may not have enough knowledge to assess that information. Banks collect information from borrowers and evaluate these instead of individual borrowers. This increase efficiency in the economy as well as reducing borrowing costs with scale economy.
Risk-Sharing Services
Another function of the commercial banks as a financial intermediary is to manage risk sharing between borrowers and lenders. Banks assess economic and ethical situation of borrowers either as firm or individual. According to their risk level, banks offer interest level to borrowers. By this service, lenders and investors do not need to hesitate about future of their investments. Accordingly they offer to their customers the instruments such as inflation indexed, floating or fixed interest rates, liquidity insurance, option for depositors or holders of a line of credit to withdraw quickly as face value (Diamond and Dybvig, 1983; Rajan, 1998) Allen and Santomero have emphasized the growing importance of risk management services provided by commercial banks.
Those functions of the commercial banks change from country to country. Especially USA had made banks to specialize as a investment bank or commercial bank deposit taking. With the Glass-Steagell Act after Great Depression, banks are forced to specialize in order to prevent commercial banks to underwrite and to investment bank to accept deposit.
According to the II nd Banking Directive of the European Commission s activities specific to banks are written as below:
Deposit-taking and other forms of borrowing Lending
Financial Leasing
Money Transmission services
Issuing and administering means of payments Guarantees and commitments
Dealing for own and brokerage for customers in Money Market
Financial Futures and options
Exchange and interest rate instruments Securities
Participation in share issues and the provision of services related to such issues Money broking
Portfolio Management and advice Safekeeping of securities
Credit reference services Safe custody service
As it is seen above, the banking instruments create specialties comparing other sector firms. Being as financial firm, fixed assets constitute little share in bank assets. Bank assets largely placed on loans either on individual customer and corporate firms or on bonds issued by governments and corporate firms.
Because of risk level, tax issues, valuation of loans present difficulties (Dermine 1985, 1987; Dermine and Hillion 1992). If there were no tax and risk, the market value of the bank would be discounted value of the dividends and liquidation value at the end of cash flows.
The bank valuation model of Dermine, explains three steps in valuation. They are model 1 without tax and risk issues, model 2 with tax and without risk issues and lastly model 3 including tax and risk effects. (Dermine, 2003)
He assumes a simplified bank framework, with loans and bonds in asset side and deposits and equity in liabilities side having two years average maturities, fixed interest rates and without risk, balance sheet of the bank would be as follows;
Assets Liabilities
Loans L (p) Deposits D (d)
Bonds B (b) Equity E (b*)
p= historical rates p*= current rates
The growth period of assets and liabilities assumed as two years for simplicity. Additionally net profit is assumed be paid out as dividends.
The market value of the equity of the bank would be discounted value of dividends and liquidation value at the end of second year, discounted at the shareholders opportunity cost of funds, b* (cost of funds)
The formula is:
Where Li*, Bi* and Di* are the current economic values in year i of the loans, bond and deposits evaluated at the current loan, bond and deposit rates.
In this context, the liquidation value is sum of economic values of loans, bonds, and deposits. In another way, market value of the bank is the difference between the economic value of assets and liabilities evaluated at their respective current rates and the franchise value. The franchise value represents the ability to pay below market rates on deposits and the ability to charge above market rates on loans.
In the model 2 added tax issue to the valuation model, the market value is the sum of four terms: The current value of assets net of liabilities,
The after tax value of franchise on deposits and loans,
The present value of non-tax deductibility of equity cost (Corporate tax penalty, Modigliani and Miller, 1958)
The present value of tax savings due to non-taxation of capital gains/losses on assets and liabilities.
Lastly, model 3 added tax and risk issues to the valuation model, the market value will get more complex. In the literature, CAPM model is used to calculate market value of the common shares. However, this model is not appropriate for bank lending. Since every corporate firm, do not issue common shares in the stock exchange. Secondly, banks lend not only corporate firms, but also individuals. Then Dermine proposes the general formula to calculate market value of the bank:
MV= {((1-t)pL)/((1-t)p*)} + {((1-t)(p*-b**)L*)/b**}-{(tb**L*)/b**}
The third model s difference than previous one is adding the expected return rate on corporate bond with similar risk as the loan b**
Dermine used Miller and Modigliani valuation models in his bank valuation models. The model put question to value loans including risk factor. This problem arises either value non-problematic loans default probability or value non-problematic loans estimated collection amount or estimated collection time.
4.1 Analysis of Commercial Banks Financials
Analysis of bank financial structure is very important to make healthy valuation. As it is discussed before, the main sources of information in the process of valuation is financial tables. Although MTM is widely used in bank financial, there are limitations to this. For example, financial securities can be placed in three portfolios in the balance sheet. Trading securities and available for sale securities booked according to their market value of balance sheet day. On the