Ankara University
Institute of Nuclear Sciences
Owner on behalf of Institute of Nuclear Sciences,
Ankara University,
Director
Niyazi MERİÇ, Ph.D.
http://jns.ankara.edu.tr
Editor-in-Chief
Haluk YÜCEL, Ph.D.
Assistant Editor-in-Chief
George S. POLYMERIS, Ph.D.
Editorial Board
Birol ENGİN, Ph.D.
Erkan İBİŞ, M.D.
Gaye Ö. ÇAKAL, Ph.D.
Güneş TANIR, Ph.D.
Hamit HANCI, M.D.
Ioannis LIRITZIS, Ph.D.
İsmail BOZTOSUN, Ph.D.
M.Salem BADAWI, Ph.D.
Mustafa KARADAĞ, Ph.D.
Niyazi MERİÇ, Ph.D.
Osman YILMAZ, Ph.D.
Özlem BİRGÜL, Ph.D.
Özlem KÜÇÜK, M.D.
Slobodan JOVANOVIC, Ph.D.
Turan OLĞAR, Ph.D.
Volume 2, No. 2
May 2015
ISSN: 2148-3981
Journal of Nuclear Sciences
Not for reproduction, distribution or commercial use.
Provided for non-commercial research and education use.
* Corresponding author.
E-mail address: [email protected] (A.N. Nyirenda).
Journal of Nuclear Sciences, Vol. 2, No. 2, May 2015, 23-30 Copyright © Ankara University, Institute of Nuclear Sciences
Journal of Nuclear Sciences
ISSN: 2147-7736
J o ur na l h om e page: h t tp :/ / j n s . a n k a r a . e d u . t r /
DOI: 10.1501/nuclear_0000000010
Kinetic analysis of the main glow peak of α-Al
2O
3:C exposed to high
irradiation dose
A.N. Nyirenda
1*and M.L. Chithambo
11Department of Physics and Electronics, Rhodes University, P.O Box 94, Grahamstown 6140, South Africa
Received 14.11.2014; received in revised form 03.02.2015; accepted 12.03.2015
ABSTRACT
This paper reports kinetic analysis of the main thermoluminescent peak in α-Al2O3:C for irradiation doses as high as 120 Gy and at various heating rates going as low as 0.01 K/s. The dependence of the various methods of kinetic analysis on irradiation dose and/or heating rate has been assessed with respect to the main peak. The dose response of the peak to high beta irradiation has also been presented.
Keywords: Kinetic Analysis, Thermoluminescence, High Irradiation Dose, Various Heating Rate.
1. Introduction
Carbon-doped aluminium oxide α-Al2O3:C is a well known ultra-sensitive dosimetric material largely used for personal dosimetry as well as environmental monitoring. Its ultra-sensitive nature is attributed to high concentration of F-centres (oxygen vacancies filled with two electrons) and F+-centres (an oxygen vacancy with one trapped electron). One of the methods used to study the properties of α-Al2O3:C is thermoluminescence (TL).
Thermoluminescence is an investigative technique in which a pre-irradiated material (insulator or semicondutor) emits light in the visible or near-visible region when heated. A plot of the emitted light intensity against measurement temperature produces a spectrum termed as a ‘glow-curve’. Analysis of such glow curves provides information about the concentration and type of defects or impurities present in the material.
This present work was aimed at carrying out a comprehensive kinetic analysis of the highly dominant peak (also termed as the main peak or dosimetric peak) of α-Al2O3:C using high doses and various heating rates. The response of the
material at high doses has also been presented. Thus, this work provides an insight into the dynamics of thermoluminescence when the material has been exposed to various doses and heating rates.
2. Materials and Methods
TL was measured by a Risø TL/OSL Luminescence Reader Model TL/OSL-DA-20 that measures both TL and optically stimulated luminescence (OSL). The luminescence detection unit is comprised of a photomultiplier tube (EMI 9235QB) and a detection filter (Hoya U-340, 7 mm thick with a detection window of 270-380 nm FWHM). An absorptive neutral density filter, Hoya ND-03 of 1% transmission and a transmission wavelength of 400 - 700 nm was used to attenuate excessive intensities at high doses (greater than 10 Gy) which would otherwise damage the PMT. The TL/OSL-DA-20 reader has an in-situ 90Sr/90Y β-source that irradiates the samples at a nominal dose rate of 0.1028 Gy/s. All samples used in the investigations were α-Al2O3:C disks measuring with dimensions 5 mm x 1 mm, obtained from Rexon TLD Systems (Ohio, USA), characterized by narrow TL peaks
.
Nyirenda et.al/Journal of Nuclear Sciences Vol 2(2) (2015) 23-30
24 Before irradiation, samples were annealed in air in a furnace at 900°C for 15 minutes, followed by rapid cooling. All measurements were made in a nitrogen atmosphere to minimise the occurrence of spurious signals and to ensure uniform heating of the samples.
3. Results and Discussion 3.1 TL glow curve profile
Fig.1 presents a TL glow curve obtained at 0.03 K/s following irradiation to 6.0 Gy. The glow curve shows five peaks labelled I, II, III, IV, and V. This study focuses on the kinetic analysis of peak II located at 156±2°C.
Fig.1 TL glow curve optained at 0.03K/s after irradiation the sample to 6.0 Gy.
3.2 Tm-Tstop method
The Tm-Tstop method is used to estimate the number of closely overlapping peaks within an apparent single peak. It is one of the methods of peak resolution in which the peak position Tm is constantly monitored as a function of the preheat temperature, Tstop. For first order kinetics, Tm is independent on Tstop whereas a shift in peak position to higher temperatures is usually observed for non-first-kinetics due to reduction in concentration of the initial trapped charge [1]. Samples were irradiated to 3.0 Gy followed by heating at 0.4 K/s to a temperature Tstop corresponding to a position on the low temperature region of the peak. The sample was then cooled rapidly to ambient temperatures followed by reheating at the same rate to 500°C to record the remaining glow-curve. The peak position Tm corresponding to Tstop was recorded. Tstop was varied from 144°C to 174°C.
Fig.2 presents the plot of Tm against Tstop which shows a ‘staircase’ profile. The four steps in the staircase suggest that the peak may comprise at least four closely overlapping peaks. Other
researchers [2-5] have also reported on the multi-component nature of the main peak.
Fig.2 Peak position, Tm against measurement
temperature, Tstop Each time the sample was
irradiated to 3.0 Gy followed by TL at 0.4 K/s. Errors in Tm were taken to be half of the
temperature interval used for measuring the TL signal.
3.3 Kinetic analysis
Isothermal decay analysis, variable heating rate, initial rise, peak shape and curve-fitting methods were employed to evaluate the kinetic parameters of the main peak such as the activation energy, E, the order of kinetics, b and the frequency factor, s. The irradiation doses used in this particular study were 0.1, 3.0 and 6.0 Gy. Heating rates of 0.01, 0.05, 0.10, 0.50 and 1.00 K/s were used, unless otherwise stated.
3.3.1 Isothermal decay method
The isothermal decay method (IDM) was primarily used to establish the order of kinetics, b, and for the evaluation of the trap depth, E, and thermal quenching parameters. IDM involves holding a sample, immediately after irradiation at some temperature Ti for a specified time. The luminescence thus observed at such a constant temperature is called phosphorescence and is measured as a function of time. A plot of TL against time generates isothermal decay curves. For general-order kinetics, the functional relationship between TL and time is given by the general order equation [6]: where
I(t) is the intensity at time t, I0 is the initial TL intensity, n0 is the initial concentration of trapped charges, s' (m3(b-1) s-1) is the effective pre-exponential factor, k is the Boltzmann's constant and other parameters as previously defined. Rearranging Eq.1 gives
For a specific value of b, a plot of
against t is therefore a straight line with slope:
Plotting against should generate a stright line whose slope is numerically equal to E.
a. Establishing the order of kinetics
Phosphorescence was recorded at temperatures from 135°C to 190°C in steps of 5°C. Eqn.3 was applied to the experimental data using three values of b namely, b = 1.1, 1.2, and 1.3 and the resulting data is shown in Fig.3.
Fig.3 Graphs of against t time for
several values of b: b=0.9, R2=0.9886; b=1.1, R2=0.9997; b=1.2, R2=0.9987; b=1.3, R2=0.9956.
It can be seen from Fig.3 that relatively better linear fits are obtained for b=1.1 (R2=0.9997) and b=1.2 (R2 =0.9987) as compared to b=1.3 (R2=0.9886) suggesting general order kinetics for the peak.
b. Evaluating the trap depth
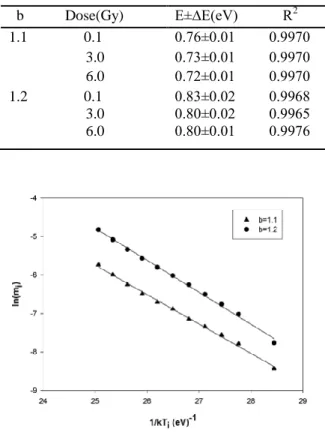
Fig.4 shows plots of against for b=1.1 and b=1.2. The effective values of E obtained for b=1.1 and 1.2 are 0.76±0.01 eV and 0.83±0.02 eV respectively at 0.1 Gy. Table 1 summarises the kinetic parameters obtained using IDM at various
doses. Table 1 shows that E is constant with dose (within error margins) for a given value of b.
Table 1. Values of E obtained for various
irradiation doses for b=1.1 and 1.2 using the isothermal decay method.
b Dose(Gy) E±∆E(eV) R2 1.1 0.1 0.76±0.01 0.9970 3.0 0.73±0.01 0.9970 6.0 0.72±0.01 0.9970 1.2 0.1 3.0 6.0 0.83±0.02 0.9968 0.80±0.02 0.9965 0.80±0.01 0.9976
Fig.4 Plots of against for b=1.1 and b=1.2.
c. Evaluating thermal quenching parameters
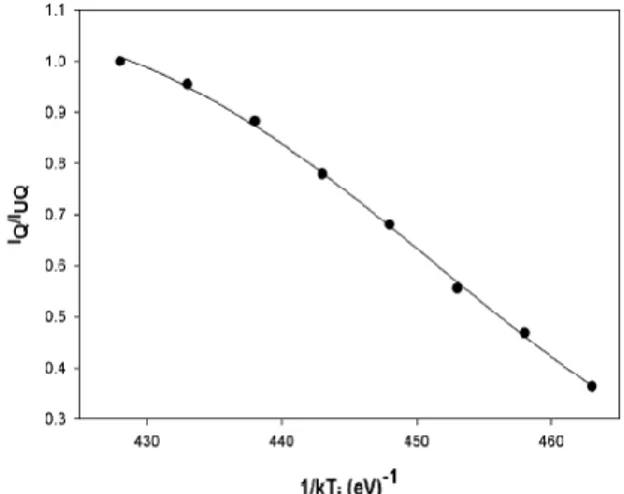
Thermal quenching is the reduction in luminescence yield at high measurement temperatures as a result of a decrease in quantum luminescence efficiency. Thermal quenching effects are observed in α-Al2O3:C at temperatures above 100°C [1]. The method used involves plotting normalized integrated phosphorescence against measurement temperatures, Ti's and fitting the resulting curve with the following equation:
where is the integrated TL at low temperature
which is assumed to be unquenched, is the quenched integrated TL at subsequent 's, W is the activation energy of thermal quenching and C is a constant. The integrated TL obtained at =155°C was assumed to be unquenched. Fig.5 shows the fitted curve. At 0.1 Gy, W=1.38±0.01 eV, C=2.28x 10¹⁵ and R2=0.9999. To check the validity of our assumption i.e. that the integrated TL obtained at =155°C is unquenched; the quantum efficiency at
Nyirenda et.al/Journal of Nuclear Sciences Vol 2(2) (2015) 23-30
26 135°C was evaluated by substituting the obtained quenching parameters into the following equation:
The value of using the above values is 0.89 representing approximately 90% efficiency. Fig.6 compares the experimental data against the same data corrected for thermal quenching using thermal quenching parameters obtained.
Fig.5 A plot of integrated phosphorescence against measurement temperature.
Table 2 lists the values of thermal quenching parameters corresponding to different doses. Within experimental error, the values of W are consistent, suggesting that W is independent of dose. The values of W obtained using this method are slightly higher than those obtained by Akserlod et al [7] of 1.08 eV using time-resolved photoluminescence, 1.05 eV using TR-OSL [8] but less than those obtained by Kitis et al [9] of 1.556 eV using variable heating rate method.
Fig.6 Plots of against
for b=1.1
and 1.2.
Table 2. Thermal quenching parameters evaluated
for various irradiation doses
.
Dose(Gy) W±∆W(eV) C R2 0.1 1.381±0.001 2.28x10¹⁵ 0.9999 3.0 1.359±0.001 1.40x10¹⁵ 0.9999 6.0 1.326±0.002 7.32x10¹⁴ 0.9998
3.3.2 Variable heating rate method
The variable heating rate (VHR) method involves subjecting the sample to different heating rates which produce corresponding changes in peak position, peak height as well as luminescence yield. For general-order behaviour, the heating rate, β, the peak height, and the peak position, are related through the following equation [6]:
where c is a constant and other parameters are as previously defined. For an appropriate value of b, a plot of against
is expected to
produce a straight line whose slope is equal to the apparent trap depth, E.
Values of b previously obtained using the isothermal decay method i.e. b=1.1 and 1.2, were used for plotting and Fig.7 shows the results. At 0.1 Gy, E=1.44±0.04 eV for b=1.1 and E=1.60±0.04 eV for b=1.2.
Fig.7 The behaviour of integrated phosphorescence using experimental data which has been corrected for thermal quenching.
The effective values of E obtained using the VHR method are summarised in Table 3. The values correspond well for both values of b obtained using isothermal decay method and the values also appear to be independent of dose. Kitis et al [9] obtained a
value of 1.504 eV for E using the same VHR method, which compares well with the values obtained here.
Table 3. Values of E obtained for various
irradiation doses for b=1.1 and 1.2 using the various heating rate method.
b Dose(Gy) E±∆E(eV) R2 1.1 0.1 1.44±0.04 0.9976 3.0 1.32±0.03 0.9989 6.0 1.37±0.03 0.9983 1.2 0.1 3.0 6.0 1.60±0.04 0.9979 1.47±0.02 0.9991 1.52±0.04 0.9983
3.2.3 Peak shape method
The peak shape method uses geometrical points on the glow peak to evaluate kinetic parameters. The points of interest in this method include the maximum of the peak, the low temperature and high temperature at full width half-maximum (FWHM) of the peak, and respectively. Chen's
general-order equation, Eq.8, is used to calculate E. In Eq.8, stands for either or or [6] and other parameters as previously defined. The geometrical factor
determines the order of kinetics and is equal to 0.42 for first order and 0.52 for second order behaviour.
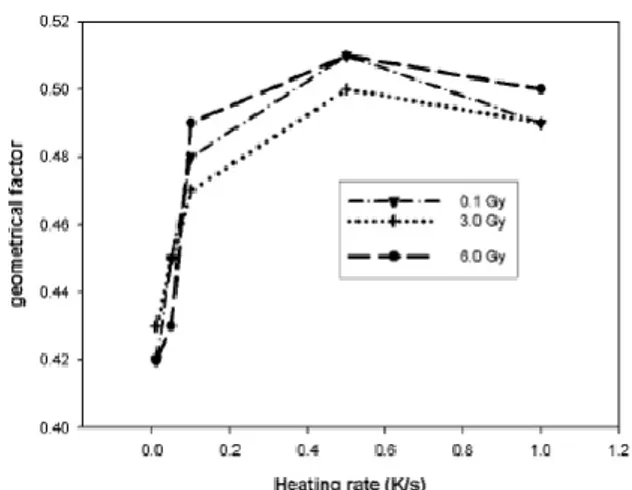
Fig.8 shows the variation of with heating rate. According to Fig.8, the main peak seems to be approximately of first order kinetics i.e. =0.42 at low heating rates, which agrees well with the values obtained using the isothermal decay method of 1.1 and 1.2. As heating rate increases, the peak approaches second order kinetics. It can be seen that this behaviour is independent of irradiation dose used. This variation of the geometrical factor could be attributed to thermal quenching effects due to increasing heating rate. However, the variation observed in the geometrical factor is not systematic with respect to the heating rate, suggesting that thermal quenching is not exclusively responsible for the variation. One possible explanation for the variation is that it could be a combined effect of both thermal quenching and multi-component nature of the main peak.
Fig.8 Graphs for the geometrical factor,
obtained at various heating rates for various
irradiation doses.
Fig. 9 shows the plot of versus heating rate. In the inset are and plots. Worth noting is the fact that effective values of E are dependent upon both the heating rate and irradiation dose. Also to note, are the relatively low values of as the irradiation dose increases. This decrease in can be attributed to relatively significant increase in δ as both the heating rate and irradiation dose increase, with δ growing faster than τ. The general observed behaviour in E is that it increases between 0.01 K/s - 0.10 K/s then starts decreasing with increasing heating rates. This increase in E between 0.01 K/s - 0.10 K/s is being reported for the first time and is attributed to the complex nature of the peak coupled with thermal quenching effects.
Fig.9 Graphs for obtained at various heating rates for various irradiation doses.
Nyirenda et.al/Journal of Nuclear Sciences Vol 2(2) (2015) 23-30
28
3.2.4 Initial rise method
The initial rise method is based on the fact that the initial rising part (usually up to 10-15 % of the maximum intensity) of a TL peak is exponentially dependent on temperature i.e.
[1]. A plot of against 1/kT, yields a
straight line whose slope is equal to the activation energy, E. In this investigation, peak I was removed through a preheat to ensure a clean rising edge of the main peak and data up to 15 % of the maximum intensity were used for the evaluation of E. Fig. 10 shows a fitted ‘initial rise' plot obtained at a heating rate 0.01 K/s when the sample was irradiated to 0.1 Gy.
Fig.10 A plot of against
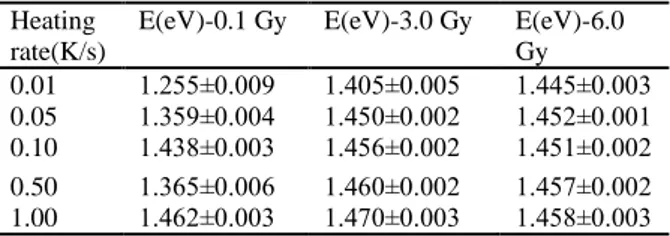
Table 4 summarises the values of E obtained using the initial rise method. It can be noted from Table 4 that all the effective values of E obtained at various heating rates and doses are consistent regardless of the heating rate and irradiation dose used.
Table.4 Values of E obtained for various doses and
at various heating rates using the initial rise method.
Heating rate(K/s)
E(eV)-0.1 Gy E(eV)-3.0 Gy E(eV)-6.0 Gy 0.01 1.255±0.009 1.405±0.005 1.445±0.003 0.05 1.359±0.004 1.450±0.002 1.452±0.001 0.10 1.438±0.003 1.456±0.002 1.451±0.002 0.50 1.365±0.006 1.460±0.002 1.457±0.002 1.00 1.462±0.003 1.470±0.003 1.458±0.003
3.2.5 Curve fitting method
Curve fitting is a computerized technique in which experimental data is fitted with a suitable mathematical function. For reliable results, the sample was irradiated to a low dose of 0.1 Gy to ensure little overlap between the main peak and peak III. In addition, peak I was removed by a preheat. The resulting data were fitted with following general-order equation [6]:
where all parameters are as previously defined. To
check the reliability of the results, the figure of merit, FOM was calculated as follows [6]:
where represents the experimental TL
data and are the values of the fitting function.
Fig.11 shows the result of fitting the data obtained at a heating rate of 0.01 K/s with eqn. 9. In the inset is the plot of the concomitant residuals from the fit. The residuals are scattered about the horizontal axis in the region of the peak, an indication that it is a good fit. The FOM obtained from the fit is 0.0268 corresponding to 2.68% accuracy for the goodness of fit. Of interest on the residual plot is the residuals that appear at the decay tail of the plot which resembles a ‘remnant' peak. The peak-like residuals may be an actual peak at the decaying tail of the
main peak as reported by other researchers e.g. Chithambo et al [3].
Fig.11 A plot of intensity against temperature fitted with eqn.9.
Table 5 shows the values of E and b obtained using the curve fitting method. The values of E are in good agreement at lower heating rates but tend to decrease above 0.5 K/s. The order of kinetics increase from 1.2 at 0.01 K/s to 1.7 at 0.1 K/s, which is consistent with the results obtained by the peak shape method.
Table 5. Values of E and b obtained at various
heating rates for an irradiation dose of 0.1 Gy using the curve fitting method.
Heating rate(K/s)
E(eV)-0.1 Gy E(eV)-3.0 Gy E(eV)-6.0 Gy 0.01 1.255±0.009 1.405±0.005 1.445±0.003 0.05 1.359±0.004 1.450±0.002 1.452±0.001 0.10 1.438±0.003 1.456±0.002 1.451±0.002 0.50 1.365±0.006 1.460±0.002 1.457±0.002 1.00 1.462±0.003 1.470±0.003 1.458±0.003 3.3 Dose response
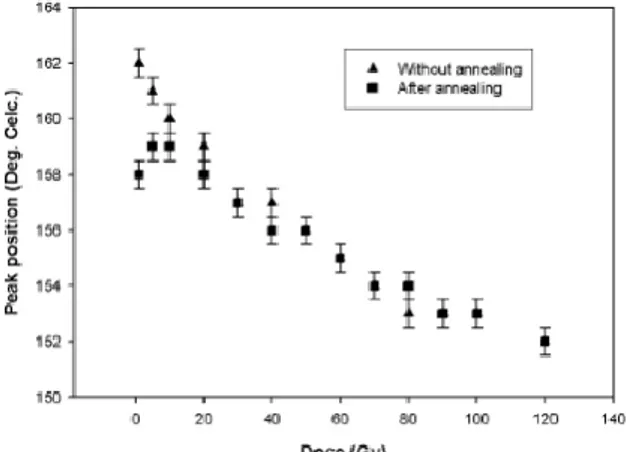
The dose response of α-Al2O3:C was investigated for irradiation doses ranging from 1.0 to 120.0 Gy. The same samples were used at each dose. Unannealed samples were used in the first set of measurements. The same samples were then annealed once only prior to measurements at 900°C for 15 minutes. In both sets of measurements, a heating rate of 0.5 K/s was used.
3.1.1 Influence of irradiation dose on peak position
Fig.12 shows the plot of peak position against dose. It is evident that the peak position decreases in both annealed and unannealed samples which is a typical behaviour in second-order kinetics. Similar characteristics were reported by Chithambo [10].
Fig.12 Peak position plotted against irradiation dose.
3.3.2 Dependence of peak height on irradiation dose
Fig. 13 is the plot of maximum intensity versus irradiation dose. The dose response follows a linear-sublinear-saturation pattern for both annealed and unannealed samples. This result shows that annealing has no apparent effect on the dose response of the material. One important observation though is that the nominal values of maximum intensities after annealing are slightly lower than those before annealing. We attribute this decrease in maximum intensities after annealing to increasing charge-trapping competition between the main trap and the deep traps due to emptying of deep traps during annealing.
Fig.13 Maximum intensity plotted against irradiation dose.
3.3.3 Dependence of FWHM on irradiation dose
Fig.14 shows the full width at half-maximum (FWHM) plotted dose for both annealed and unannealed samples. The FWHM increases with increasing irradiation dose until into the saturation region where it appears to be almost constant with dose. A similar result was observed by Yukihara et al [5] for samples with narrow TL peaks, the only difference being in Yukihara's results, the FWHM continues to increase even in the saturation region of Fig.13.
Nyirenda et.al/Journal of Nuclear Sciences Vol 2(2) (2015) 23-30
30
Fig.14 FWHM plotted against irradiation dose.
4. Conclusion
The kinetic analysis of the main peak of α-Al2O3:C has been carried out. The results of Tm-Tstop method suggest that the main peak may be a composite peak. The values of the trap depth of the main peak obtained by the various methods are consistent with each other at low heating rates and can be estimated at 1.4 ±0.1 eV on average. The initial rise method has proven to be the only method that is independent of both dose and heating rate in the evaluation of E and thus provides reasonable values for the activation energy. The curve fitting method provides reasonable results at both relatively ‘low’ dose and low heating rates (low dose ensures that the peak is at least well separated from neighbouring peaks). The peak position shifts to lower temperatures with increasing irradiation doses. In addition, the FWHM tends to increase with increasing irradiation doses except in the saturation region (above 70 Gy) where it becomes constant. However, comparison of values of E obtained using the various methods of analysis show that the isothermal decay method somewhat underestimates the values of trap depth.
5. References
[1] S.W.S. McKeever, “Thermoluminescence of Solidsˮ, Cambridge University Press (1985). [2] N. A. Larsen, L. Botter-Jensen and S.W.S. McKeever, “Thermally Stimulated Conductivity and Thermoluminescence from α-Al2O3:C”, Radiation Protection Dosimetry 84 (1-4) 87-90 (1999).
[3] M.L. Chithambo, C. Seneza and F.O. Ogundare, “Kinetic Analysis of High Temperature Secondary Thermoluminescence Glow Peaks in α-Al2O3:C”, Radiation Measurements 66 21-30 (2014).
[4] F. D. Walker, L. E. Colyott, N. A. Larsen and S.W.S. McKeever, “The Wavelength Dependence of Light-Induced Fading of Thermoluminescence
From α-Al2O3:C”, Radiation Measurements 26(5) 711-718 (1996).
[5] E.G. Yukihara, V.H. Whitley, J.C. Polf, D.M. Klein, S.W.S. McKeever, A.E. Akselrod and M.S. Akselrod, “The Effects of Deep Trap Population on The Thermoluminescence of Al2O3:Cˮ, Radiation Measurements 37 (6) 627-638 (2003).
[6] V. Pagonis, G. Kitis and C. Furetta, “Numerical and Practical Exercises in Thermoluminescenceˮ, Springer (2006).
[7] M.S. Akselrod, N.A. Larsen, V. Whitley and S.W.S McKeever, “Thermal Quenching of F-Center Luminescence in Al2O3:Cˮ, J. Appl. Phys. 84 (6) 3364-337 (1998).
[8] A.N. Nyirenda. “Mechanisms of Luminescence in α-Al2O3:C: Investigations Using Time-resolved Optical Stimulation and Thermoluminescence Techniquesˮ , Master Thesis, Rhodes University, Faculty of Science, Departmant of Physics and Electronics, Grahamstown, 98 s (2012).
[9] G Kitis, J.G. Papadopoulos, S. Charalambous and J.W.N. Tuyn, “The Influence of Heating Rate on The Response and Trapping Parameters of α-Al2O3:Cˮ, Radiat. Prot. Dos. 55 (1994), 183-190. [10] M.L. Chithambo, “Concerning Secondary Peaks in α-Al2O3:Cˮ, South African Journal of Science, 100 524-527 (2004).