RESEARCH ARTICLE ARAŞTIRMA MAKALESİ
Determination of nutritional composition of Enteromorpha intestinalis and
investigation of its usage as food
Enteromorpha intestinalis’in besinsel kompozisyonunun belirlenmesi ve
gıda amaçlı kullanımının tespiti
Cansu Metin* ● Taçnur Baygar
Muğla Sıtkı Koçman University, Faculty of Fisheries, Department of Fisheries and Seafood Processing Technology, Kötekli, 48000 Muğla, Turkey * Corresponding author: [email protected]
Received date: 22.08.2017 Accepted date: 3.10.2017
How to cite this paper:
Metin, C. & Baygar, M. (2018).Determination of nutritional composition of Enteromorpha intestinalis and investigation of its usage as food. Ege Journal of Fisheries and Aquatic Sciences, 35(1): 7-14. doi:10.12714/egejfas.2018.35.1.02
Öz: Bu çalışmada Muğla Akyaka Kadın Azmağı’ından toplanan yeşil makroalg Enteromorpha intestinalis’in besinsel kompozisyonunun mevsimsel olarak belirlenmesi ve gıda amaçlı kullanımının tespiti amaçlanmıştır. Ortam koşulları ve ardından etüvde kurutma işleminden sonra, E. intestinalis çay, çorba ve baharat şeklinde hazırlanmış ardından duyusal değerlendirmeye alınmıştır. Besinsel kompozisyon analiz sonuçlarına göre; ancak E. intestinalis‘in içerdiği daha yüksek miktarda protein, ilkbaharda kül ve C vitamini, sonbaharda çoklu doymamış yağ asitleri nedeniyle, kullanım alanına bağlı olarak 12 ay boyunca değerlendirilebileceği düşünülmektedir. Duyusal analiz bulgularına göre ise; elde edilen ürünler Türk damak tadına çok yakın olmasa da, ürünlerin farklı içeriklerle çeşitlendirilmesinin kabul edilebilirliklerini arttırdığı sonucuna varılmıştır.
Anahtar kelimeler: Enteromorpha intestinalis, makroalg, besinsel kompozisyon, duyusal analizler
Abstract:The aim of this study was to determine the nutritional composition of green macroalgae Enteromorpha intestinalis, collected from Muğla Akyaka Kadın Azmağı seasonally and investigate for consumption as food. After drying process in ambient conditions and then oven, E. intestinalis was prepared as tea, soup and spice and offered to the panelist team for sensorial test. Based on the nutritional composition analysis results, E. intestinalis can be utilized in a variety of ways depending on its intended field of usage, due to its higher content of crude protein in summer, ash and vitamin C in spring and polyunsaturated fatty acids in autumn. According to sensory analysis; processed products are not very close to the Turkish palate, although flavoring of these products with different additives increased the acceptability.
Keywords: Enteromorpha intestinalis, macroalgae, nutritional composition, sensory analysis
INTRODUCTION
Macroalgae is an important coastal source for human consumption and environment in many countries ( Ratana-arporn and Chirapart, 2006). Because of its health benefits it had been used in many fields such as food, medicine, cosmetics, agriculture since ancient times. The importance of algae in human nutrition is due to the fact that it has the necessary ingredients at desired levels for healthy nutrition. Especially high protein, vitamins and minerals in its structure and the low amount of lipid puts the consumption of algae after fish for healthy nutrition as an attractive food. Green algae (Chlorophyta) are mostly used in the food industry due to their high content of protein, vitamins and minerals (Ova Kaykaç et al., 2008).
Seasonal changes in the life cycle of algae also change their chemical structure (Çetingül, 2001). Macroalgae, which
are beneficial for human health has oppurtunities to be used in many fields. Due to its nutritional content, it is utilized in many countries but although our country is surrounded by sea and has several inland waters and rich flora, macroalgae is not preferred as food.
In this study, our purpose was to determine nutritional composition of Enteromorpha intestinalis which is found in Muğla Akyaka Kadın Azmağı for each season in order to increase the interest and the awareness about the algae which has beneficial components for human health. After determining nutritional composition, alternative products like tea, soup and spice were prepared from this macroalgae to increase acceptability and were invastigated whether they are appealing to the Turkish palate with sensory analysis.
MATERIALS AND METHODS
Collection of material and drying procedure
E.intestinalis was used as material. Sampling was carried
out in Akyaka Kadın Azmağı (Muğla). For nutritional composition and other analysis, samples were collected manually from the coordinates of 37˚3̍ 11.83̎ N-28˚19̍ 47.32̎ E and 0.5-1m depth, between August 2013-April 2014, over four seasons; in August, November, January and April. Necessary permissions were taken from Republic of Turkey Ministry of Food, Agriculture and Livestock, General Directorate of Fisheries and Aquaculture. Collected samples were placed in opaque plastic bags and were brought to Muğla Sıtkı Koçman University, Faculty of Fisheries Quality Control Laboratory by placing in styrofoam boxes within half an hour. Subsequently the samples which were purified from debris (stone and sand) by washing with pure water and were kept in -18°C about one month for each sampling period until analysis were carried out.
Before starting analysis, algae samples were thawed at 25±2˚C ambient temperature. After thawing process, kept at 25±2˚C ambient temperature for the following 24 hours, according to Turan (2007) the samples were dried at 40°C in drying oven for 24 hours and milled by commercial blender (Waring commercial blender, Torington, USA).
Nutritional composition analysis
Seasonal crude protein (AOAC, 2002), crude lipid (AOAC, 2006), moisture (AOAC, 1995), ash (AOAC, 1990), carbohydrate (Varlık et al., 2007), chlorophyll-a ( Rohani-Ghadikolaei et al., 2012), fatty acid (AOAC, 2001), vitamin (AOAC, 2000; Gökmen et al., 2000; Reyes and Subryan, 1989) and mineral (Hussain et al., 2011) analysis were carried out for dried E. intestinalis. All analysis were carried out with dry material since the products were going to be prepared as dried material.
Product preparation and sensory analysis
Tea, soup and spice were produced for evaluation at sensory panels. After literature review and pre-trials, appropriate concentration ratios were determined as 1%, 3%, 5% and at these concentrations seaweed tea was prepared using 100% natural tea bags. All concentration groups were brewed at 100±2°C. Brewing lasted 3, 5 and 10 minutes. Sensory analysis were carried out for prepared seaweed teas for two panel days. At the first panel each concentration group that were brewed in three different brewing time were prepared as 9 different groups and offered to sensory evaluation (Table 1). The most admirable group in terms of concentration and brewing time was defined as control group for second panel. In the second panel, mint-lemon or apple-cinnamon mix were added to the control group with different concentrations to give different flavours (Table 2).
Table 1. Seaweed teas prepared at different brewing time and
concentrations
Table 2. Seaweed teas prepared at different content and ratios
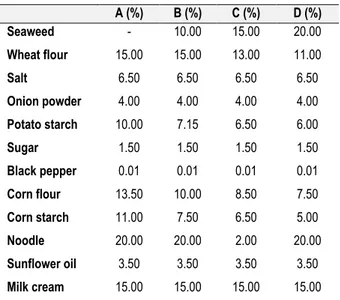
The most appropriate ingredient for seaweed soup was determined after pre-trials. Accordingly soups were prepared with wheat flour, corn flour, potato starch, corn starch for thickening, onion powder, salt, sugar, pepper, sunflower oil and noodle for flavouring. Dried and milled seaweed powders were added to this mix at different concentrations; 10% (B), 15% (C), 20% (D) and were presented to sensory analysis with seaweed-free group (A) by adding 150 ml drinking water (Table 3). Furthermore, milk cream was added to each group while cooking.
Table 3. Seaweed soup content for one panelist
A (%) B (%) C (%) D (%) Seaweed - 10.00 15.00 20.00 Wheat flour 15.00 15.00 13.00 11.00 Salt 6.50 6.50 6.50 6.50 Onion powder 4.00 4.00 4.00 4.00 Potato starch 10.00 7.15 6.50 6.00 Sugar 1.50 1.50 1.50 1.50 Black pepper 0.01 0.01 0.01 0.01 Corn flour 13.50 10.00 8.50 7.50 Corn starch 11.00 7.50 6.50 5.00 Noodle 20.00 20.00 2.00 20.00 Sunflower oil 3.50 3.50 3.50 3.50 Milk cream 15.00 15.00 15.00 15.00
Seaweed spices were prepared with dried and milled seaweeds. Different groups containing spices were prepared with 2:1 seaweed and spice mix ratio (2 parts of seaweed, 1 part of spice mix) (Table 4). During sensory panel, spice mixtures were mixed with sunflower oil and served on toast breads.
1
Table 4. Spice mix contents
A (g) B (g) C (g) D (g)
Seaweed 30 30 30 30
Thyme * 7.5 5 3.75
Red pepper flakes * 7.5 5 3.75
Onion powder * * 5 3.75
Cumin * * * 3.75
Panels for tea, soup and spice products derived from E.
intestinalis were carried out with 30 panelists in Sensory Panel
Room between 10.00-11.30 am and 14.00-15.00 pm. Sensory criterions for products were detected according to characteristics of products and scoring test evaluated between 1-9 points (1 point; Extreme poor, 2 points; Too bad, 3 points; Poor, 4 points; Better than bad, 5 points; Average, 6 points; Better than middle, 7 points; Good, 8 points; Very good, 9 points; Excellent) (Anonymous, 2010). Drinking water was presented to panelists for rinsing their mouths between sample tasting, each sample was encoded with 3 digit letters or numbers. In each panel, opinions of panelists were recorded. Statistical analysis was performed using the Statistical Package for Social Sciences (SPSS for Windows, SPSS Inc., Chicago, IL, USA). Experiments were performed in triplicate (N=3) for
three independent samples and a completely randomized design (CRD) was used. Data were presented as mean values standard deviations and a probability value of P>0.05 was considered significant. Analysis of variance (ANOVA) was performed and the mean comparisons were done by Duncan's multiple range tests.
RESULTS
Nutritional composition analysis results
As a result of nutritional composition analysis for dry material; protein content of dried material in summer, autumn, winter and spring was determined as 13.42±1.31%, 4.67±0.81%, 6.29±0.99% and 12.34±2.92%, respectively. The highest protein content was detected in summer with 13.42±1.31%, the lowest content was in autumn with 4.67±0.81% (P<0.05). Crude lipid content was determined between 0.02±0.01%-1.31±0.57% values seasonally, the highest content obtained in summer (P<0.05). Moisture values investigated seasonally were determined between 10.74±0.11-12.15±0.18%. Big differences were not observed seasonally (P>0.05). Highest ash content was obtained in spring (17.35±1.47%)(P<0.05). Carbohyrate and chlorophyll-a content changed between 58.03±2.31-70.64±0.76% and 4.07-5.89%, respectively (Table 5).
Table 5. Nutritional composition values of E. intestinalis obtained seasonally
Protein(%) Lipid(%) Moisture(%) Ash(%) Chlorophyll-a(%) Carbohydrate(%) Summer 13.42±1.31a 1.31±0.57a 12.14±1.11a 14.81±0.23b 4.07* 58.03±2.31b
Autumn 4.67±0.81b 0.22±0.10b 12.15±0.18a 11.75±0.55c 4.90* 70.64±0.76a
Winter 6.29±0.99b 0.22±0.06b 11.23±0.10b 12.45±0.70c 5.04* 69.01±1.03a
Spring 12.34±2.92a 0.02±0.01b 10.74±0.11b 17.35±1.47a 5.89* 59.79±1.33b
Values were given as average and ± standard deviation of 3 paralleled analysis. There are statistically important (P˂0.05) differences between values indicated by different letters in the same column. *Values were not evaluated statistically because they contain single data.
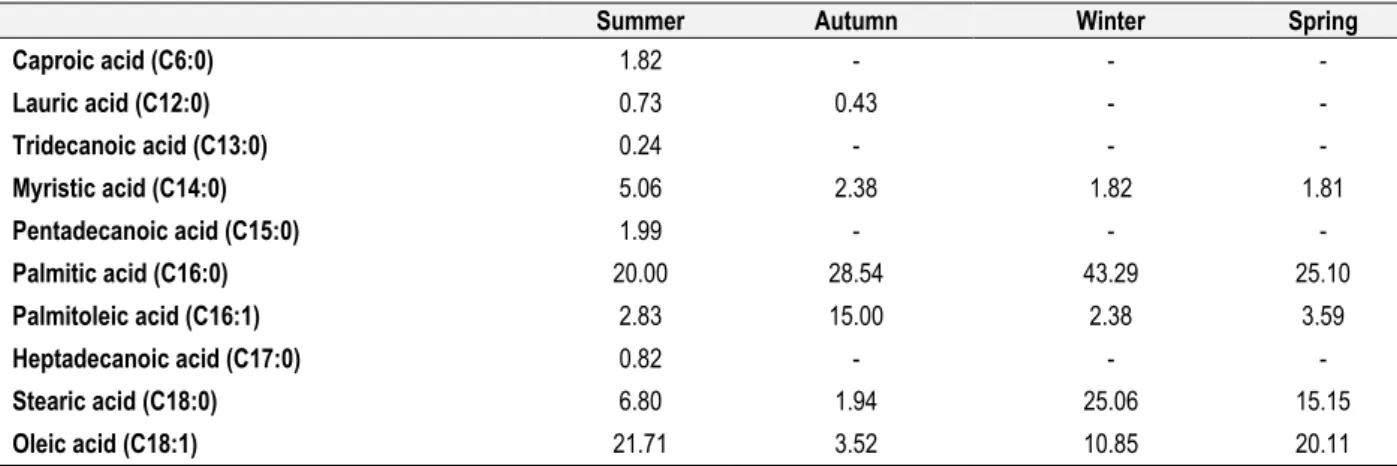
For fatty acids it stands out; high contents of linoleic acid (C18:2) (%11.11) in winter, linolenic acid (C18:3) (%14.93) and Cis-11,14-eicosadienoic acid (C20:2) (%17.76) in autumn,
among polyunsaturated fatty acids. High contents of palmitic (C16:0) and palmitoleic (C16:1) acid among saturated and monounsaturated fatty acids were detected (Table 6).
Table 6. Results of fatty acid composition obtained seasonally
Summer Autumn Winter Spring
Caproic acid (C6:0) 1.82 - - - Lauric acid (C12:0) 0.73 0.43 - - Tridecanoic acid (C13:0) 0.24 - - - Myristic acid (C14:0) 5.06 2.38 1.82 1.81 Pentadecanoic acid (C15:0) 1.99 - - - Palmitic acid (C16:0) 20.00 28.54 43.29 25.10 Palmitoleic acid (C16:1) 2.83 15.00 2.38 3.59 Heptadecanoic acid (C17:0) 0.82 - - - Stearic acid (C18:0) 6.80 1.94 25.06 15.15 Oleic acid (C18:1) 21.71 3.52 10.85 20.11
Summer Autumn Winter Spring Linoleic acid (C18:2) 3.77 7.51 11.11 19.42 Trans-linolenic acid (C18:3n6) 6.69 1.53 - - Linolenic acid (C18:3) 1.71 14.93 2.36 6.90 Cis-11,14-eicosadienoic acid (C20:2) - 17.76 - 5.52 Cis-8,11-14-eicosatrienoic acid (C20:3) - 0.37 - -
Cis-5,8,11,14,17 eikosapentaenoik asit(C20:5n3) - 3.32 1.89 2.40
Behenic acid (C22:0) - 0.67 - -
Cis-13,16-Dokosadienoik acid (C22:2) 3.89 - - -
Tricosanoic acid (C23:0) 19.93 - - -
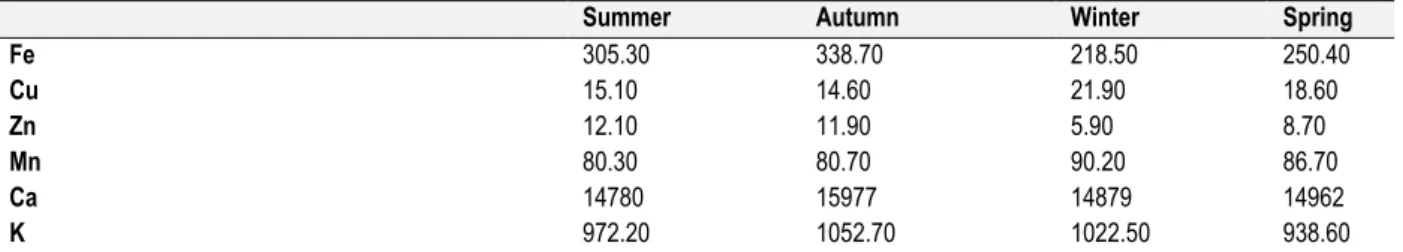
According to mineral contents investigated in the study, calcium was observed in each season with the maximum contents compared to other minerals.
The maximum calcium content (15977 mg/kg) was obtained in autumn. Micro minerals were obtained in this order; Fe> Mn> Cu> Zn (Table 7).
Table 7. Results of studied mineral analysis seasonally (mg/kg)
Summer Autumn Winter Spring
Fe 305.30 338.70 218.50 250.40 Cu 15.10 14.60 21.90 18.60 Zn 12.10 11.90 5.90 8.70 Mn 80.30 80.70 90.20 86.70 Ca 14780 15977 14879 14962 K 972.20 1052.70 1022.50 938.60
Mineral analysis results were not evaluated statistically because of containing single value.
The maximum vitamin A (0.156±2.83mg/100g) and vitamin E (7.91±0.11mg/100g) amounts were detected in winter, the difference between other seasons statistically significant (P<0.05).
While there was no difference statistically (P>0.05) between seasons in terms of vitamin B2, the highest B1 and B3 value were observed in spring and were statistically significant from other seasons (P<0.05) (Table 8).
Table 8. Results of vitamin analysis obtained seasonally (mg/100g)
Summer Autumn Winter Spring
Vitamin A (Retinol) 0.145±0.71b 0.033±0.50d 0.156±2.83a 0.081±1.54c
Vitamin B1 (Thiamine) 0.12±0.00b 0.12±0.00b 0.11±0.00b 0.17±0.02a
Vitamin B2 (Riboflavin) 0.97±0.01a 0.95±0.01a 0.95±0.06a 0.89±0.02a
Vitamin B3 (Niacin) 0.73±0.02b 0.81±0.03b 0.81±0.05b 2.42±0.09a
Vitamin B6 (Pyridoxine) 0.23±0.02a 0.18±0.01ab 0.20±0.02ab 0.15±0.01b
Vitamin C (Ascorbic acid) 2.78±0.08b 3.41±0.00b 2.56±0.02b 147±2.00a
Vitamin E (Tocopherol) 2.75±0.29c 1.23±0.01d 7.91±0.11a 5.13±1.03b
Values were given as average and ± standard deviation of 3 paralleled analysis. There are statistically important (P˂0.05) differences between values indicated by different letters in the same line
Sensory Analysis Results
According to the first panel of seaweed tea sensory analysis results, considering overall acceptability values the most
appreciated group was A-5 with 6.52±1.44 points (good), the least appreciated group was C-10 with 5.29±1.75 points (middle) and the difference between two groups was statistically significant (P<0.05) (Table 9).
Table 9. Sensory anaylsis results of seaweed teas prepared at different concentrations and brewing times
A-3 A-5 A-10 B-3 B-5 B-10 C-3 C-5 C-10 Colour 5.94±1.67abc 6.29±1.42a 6.09±1.33ab 6.00±1.65abc 5.55±2.08abc 5.52±2.06abc 5.22±1.80bc 5.00±1.95c 5.32±1.87abc Clarity 6.29±1.42ab 6.71±1.19a 6.42±1.26ab 6.00±1.24abc 5.74±1.63bc 5.77±1.69bc 5.19±1.92c 5.23±1.71c 5.29±1.79c Flavour 5.74±1.61a 6.10±1.83a 5.94±1.86a 6.39±1.67a 6.42±1.95a 6.35±1.68a 5.90±1.82a 6.42±1.78a 6.06±1.95a Odour 7.35±1.23a 7.32±1.33a 7.13±1.57ab 6.35±1.84bc 6.16±1.86c 5.74±1.83cd 4.58±1.61e 5.16±1.81de 4.71±1.64e Fish/
seaweed aroma 5.21±1.95a 5.10±1.99a 5.55±1.96a 5.10±2.14a 5.14±2.01a 5.34±2.41a 5.62±2.03a 4.93±2.43a 5.48±1.96a After-taste liking 5.84±1.42abc 6.35±1.23a 6.10±1.68ab 5.81±1.51abc 5.55±1.77abc 5.58±1.75abc 5.32±2.14bc 5.03±2.27c 5.13±2.05bc Overall acceptability 6.05±1.40ab 6.52±1.44a 6.23±1.59ab 5.90±1.49ab 5.65±1.87ab 5.73±1.70ab 5.39±1.84b 5.39±1.78b 5.29±1.75b
Values were given as average and ± standard deviation of 3 paralleled analysis. There are statistically important (P˂0.05) differences between values indicated by different letters in the same line.
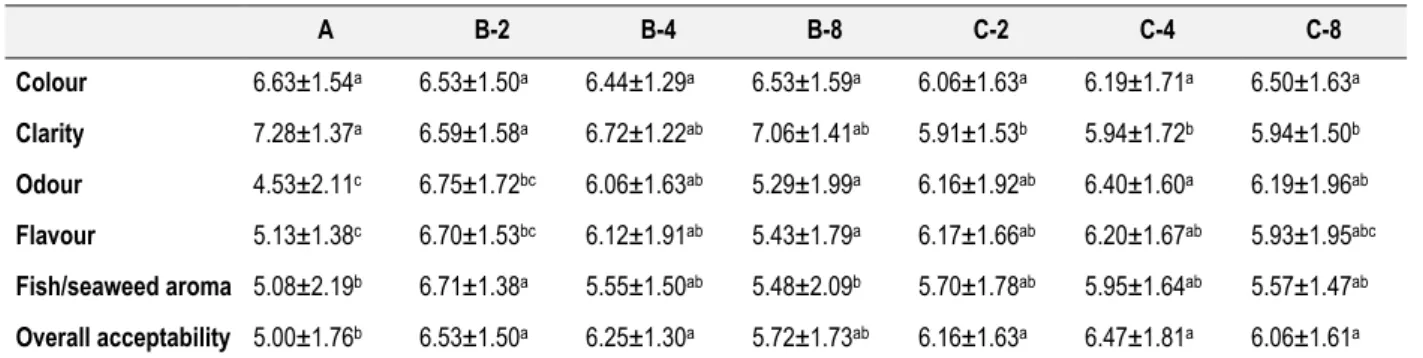
For overall acceptability criterion of seaweed teas constituted for second panel, it was detected that the most admirable group was B-2 with 6.53±1.50 points (good), the least admirable group was A with 5.00±1.76 points (middle).
The difference between two groups was statistically significant (P<0.05). Each criterions dealed individually and in terms of overall acceptability it is observed group B-2 reached maximum point (Table 10).
Table 10. Sensory analysis results of seaweed prepared at different contents
A B-2 B-4 B-8 C-2 C-4 C-8 Colour 6.63±1.54a 6.53±1.50a 6.44±1.29a 6.53±1.59a 6.06±1.63a 6.19±1.71a 6.50±1.63a Clarity 7.28±1.37a 6.59±1.58a 6.72±1.22ab 7.06±1.41ab 5.91±1.53b 5.94±1.72b 5.94±1.50b Odour 4.53±2.11c 6.75±1.72bc 6.06±1.63ab 5.29±1.99a 6.16±1.92ab 6.40±1.60a 6.19±1.96ab Flavour 5.13±1.38c 6.70±1.53bc 6.12±1.91ab 5.43±1.79a 6.17±1.66ab 6.20±1.67ab 5.93±1.95abc Fish/seaweed aroma 5.08±2.19b 6.71±1.38a 5.55±1.50ab 5.48±2.09b 5.70±1.78ab 5.95±1.64ab 5.57±1.47ab Overall acceptability 5.00±1.76b 6.53±1.50a 6.25±1.30a 5.72±1.73ab 6.16±1.63a 6.47±1.81a 6.06±1.61a
Values were given as average and ± standard deviation of 3 paralleled analysis. There are statistically important (P˂0.05) differences between values indicated by different letters in the same line.
Seaweed soup that was investigated in terms of overall acceptability, the most appreciated group was observed as
group B with 6.43±1.87 points, its difference from group C and D was statistically significant (P<0.05) (Table 11).
Table 11. Sensory analysis results of seaweed soup prepared at different concentrations
A B C D Appearance 6.50±2.06a 6.13±2.05a 5.73±2.02b 5.43±1.83b Colour 6.70±2.14a 6.20±2.04a 5.73±2.10b 5.70±1.95b Odour 6.35±1.68a 6.45±1.86a 6.26±1.83a 5.52±1.90b Fish/seaweed aroma - 6.40±1.90a 5.90±1.90b 5.62±1.97b Flavour 6.43±1.72a 6.53±1.81a 5.80±1.77b 5.97±1.75b Consistency 6.53±1.66a 6.63±1.54a 6.57±1.68a 6.13±1.85a Dissolution rate 6.30±2.45a 6.20±2.07a 6.00±1.84ab 5.70±1.76b After-taste liking 6.07±1.48a 6.17±1.88a 5.67±1.81b 5.67±1.66b Overall acceptability 6.33±2.07a 6.43±1.87a 5.83±1.66b 5.73±1.68b
Values were given as average and ± standard deviation of 3 paralleled analysis. There are statistically important (P˂0.05) differences between values indicated by different letters in the same line.
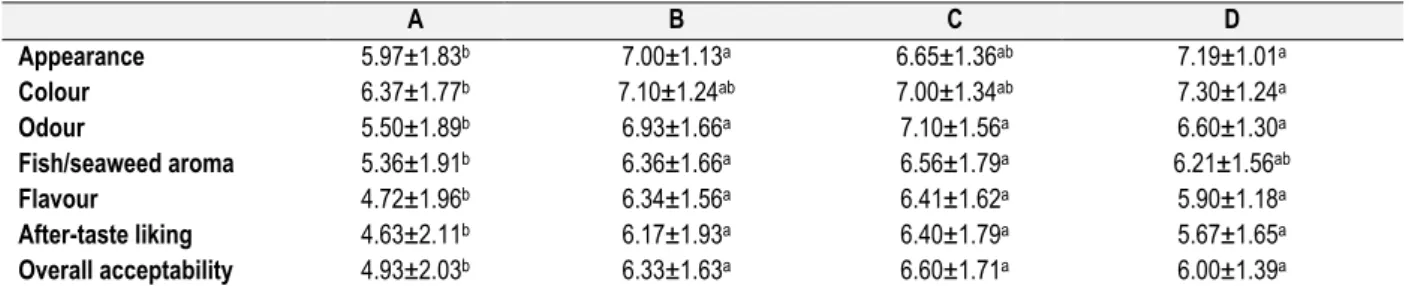
Table 12. Sensory analysis results of seaweed spice prepared with different concentrations A B C D Appearance 5.97±1.83b 7.00±1.13a 6.65±1.36ab 7.19±1.01a Colour 6.37±1.77b 7.10±1.24ab 7.00±1.34ab 7.30±1.24a Odour 5.50±1.89b 6.93±1.66a 7.10±1.56a 6.60±1.30a Fish/seaweed aroma 5.36±1.91b 6.36±1.66a 6.56±1.79a 6.21±1.56ab Flavour 4.72±1.96b 6.34±1.56a 6.41±1.62a 5.90±1.18a After-taste liking 4.63±2.11b 6.17±1.93a 6.40±1.79a 5.67±1.65a Overall acceptability 4.93±2.03b 6.33±1.63a 6.60±1.71a 6.00±1.39a
Values were given as average and ± standard deviation of 3 paralleled analysis. There are statistically important (P˂0.05) differences between values indicated by different letters in the same line.
When seaweed spices invastigated in terms of overall acceptability, group C was the most appreciated with 6.60±1.71 points. Group A was the least appreciated group with 4.93±2.03 points. The difference between group A and C was statistically significant (P<0.05) (Table 12).
DISCUSSION
Macroalgae has rich a nutritional composition in terms of protein, fatty acids, vitamins and minerals and they constitute quite valuable for nutrition. In this study, high protein contents were determined and specimens had quite high amounts in summer and spring compared to other seasons. Çetingül (2001) specified that the maximum protein content of algae is observed mostly in rapid growing period of the species and, the minimum content, when thallus structure deteriorates. Ova Kaykaç et al. (2008) indicated fluctuations among seasons arise due to the changing of the factors such as temperature, salinity, nitrogen and nutrients of aquatic environment in which the species live. Akköz et al. (2011) determined the protein content for E. intestinalis as 15.02±1.02% which was obtained from Konya Acıgöl. McDermid and Stuercke (2003) determined protein content of E. intestinalis collected from Hawaii as 11.40±0.80% on dry material, Manivannan et al. (2008) also determined protein content of E. intestinalis collected from Mandapam (India) coastal region as 16.38±0.50%. These results have similarities with the protein content in summer season in our study. The differences between protein values might arise due to differences of geographic region, species, the season of sampling, laboratory conditions, analysis variables and etc.
It was thought that the maximum lipid value obtained in summer depends on the maximum growth of the algae.
Siddique et al. (2013) reported that consumable algaes are not good lipid sources and contain crude lipid below 4%. Lipid content of green algaes show difference between 0.60% and 4.30% (Parekh et al., 1977). Mamatha et al. (2007) determined lipid content of Enteromorpha compressa that was used for snacks, 0.30%, Akköz et al. (2011) determined 1.63±0.09% for
E. intestinalis obtained from Konya Acıgöl. The values obtained
in our study shows similarities with the values obtained in other studies.
Pillai (1956) indicated moisture changes depend on growth stages of algaes and they have higher moisture content at young stages. Aguilera-Morales et al. (2005) determined moisture content in dry material of Enteromorpha spp. as 9.00±0.74 g/100g.
In the study the highest ash content (17.35±1.47%) was observed in spring (P<0.05) with the increase of sunlight and photosynthesis. Aguilera-Morales et al. (2005) determined ash content of Enteromorpha spp. as 36.38±0.42 g/100g. Changes of ash content show differences according to algae species, geographic origin and mineralization method (Nisizawa et al., 1987; Sanchez-Machado et al., 2004; Siddique et al., 2013). High levels of ash content is an indicator of high mineral content (Yaich et al., 2011; Siddique et al., 2013).
Fırat et al. (2007) indicated carbohydrate content of
Chlorophyceae is 1-47%. Mamatha et al. (2007) determined carbohydrate content of E. compressa that was used for snacks as 48,20%. Rohani-Ghadikolaei et al. (2012) also determined carbohydrate of U. lactuca and E. intestinalis as 59.1% and 35.5%, respectively. Also they determined chlorophyll-a value of E. intestinalis as 5.6% similar to our study.
Despite containing low levels of lipid, algaes have higher ratio than other land plants (Darcy-Vrillon, 1993). While land plants generally produce ω-6 fatty acids, some certain sea and fresh water plants produce ω-3 fatty acids. Yaich et al. (2011)
determined linoleic and linolenic acid of Ulva lactuca as 2.43 and 3.20% respectively. Rohani-Ghadikolaei et al. (2012)
determined EPA for E. intestinalis obtained from Persian Gulf of Iran as 0.3% and DHA is non-defined. Norziah and Ching (2000) determined fatty acids of Gracilaria changgi which was collected from Malaysia and found EPA as 33.10±6.30%, palmitic acid as 22.00±2.70% and oleic acid as 21.90±3.40%. This result was similar with palmitic and oleic acid amounts that were found to be dominant in our study.
Garcia-Sartal et al. (2013) reported macroalgaes bioaccumulate essential elements like Ca, Fe at high levels and more than land plants. It is known that karst sources occur from CaCO3 and the amount of calcium occurs discharge of karst sources collecting to Kadin Azmagi (Cesur et al., 2014). Important differences which occur seasonally may be associated with the increase in temperature, nutrient content
and other dissolved material in water by accession of materials to food chain with rain water. Aguilera-Morales et al. (2005)
determined potassium (1.10±0.56 g/100g), calcium (2.10±0.79 g/100g) amounts for Enteromorpha spp. and these results were similar with our results. Akköz et al. (2011) determined zinc content of E. intestinalis as 20.76±1.32% obtained from Konya Acıgöl.
Burtin (2003) reported that vitamin C content of green and brown algae may change between 50–300 mg/100g in dry material. Sarojini and Sarma (1999) concluded vitamin C content of 24 species of green algae annually ranged from 8.96 to 99.52 mg/100g. This result was similar with the vitamin C content that reached 147±2.00 mg/100g in our study. Vitamin C content of macroalgae may change seasonally in significant amounts. It was observed in the studies that vitamin C content of most of macroalgae reach the maximum amount twice a year including vegetative part of early growing phase of thallus and other proliferation phase. It is thought that differences that occur in vitamin contents may arise due to genetic differences among green, red and brown algae, region and seasonal differences.
According to the first seaweed tea panel; it is thought that A-5 was the most appreciated group because of its lowest algae concentration, the lightest colour and was the most pleasing to eye as well as, sensing less peculiar to seaweed odour with short brewing time, lightest seaweed aroma. For second seaweed tea panel it was commented that due to mint-lemon content, group B-2 repress fish/seaweed aroma that is unfamiliar to Turkish palate, gained more appreciation. When compared to first panel it is observed that points increased in second panel, this increase is thought to be because of the addition of mint-lemon and apple-cinnamon flavors which are familiar tastes for our palate and they repress seaweed aroma.
Lee et al. (2008) prepared green tea at different brewing time and temperature; as a result of sensory analysis green teas that brewed at 60°C 3 minutes and 80°C 1 minute were appreciated the most.
Intensive seaweed particles in groups C and D for seaweed soups did not leave a good feel in the mouth and, due to intensive seaweed aroma these groups were appreciated less. In their study Kılınç et al. (2013) prepared soups with Ulva rigida and Gracilaria verrucosa with the addition of flour, salt, yoghurt,
egg, lemon, onion, garlic, red pepper, mint, and water and applied cooking for 30 minutes. They evaluated that in terms of sensory analysis and as flavour both soups respectively got 7.54±0.71 and 7.84±0.58 points over 9, and both soups were determined as quite nice in terms of overall acceptability.
For seaweed spice sensory panel; it was detected that the most appreciated group in terms of odour was group C, onion powder in mix content was appreciated by panelists due to its similarities with spicy chips in stores. Group B was found bitter tasting compared to other groups because of its red pepper flake content. Comments show that other mixtures can be used in fish soup, breakfast sauce, cracker, flavour fish or red meat while cooking with barbecue and grill. Senthil et al. (2011) evaluated spice mixtures prepared at different concentrations for Eucheuma with descriptive quantitative analysis, according to seven-point hedonic scale for colour, aroma, after-taste liking, overall acceptability. In terms of aroma, after-taste liking, overall acceptability the highest concentration (25%) seaweed spice got the highest score.
Algae are rich sources in terms of protein, unsaturated fatty acids, vitamin and mineral. Nutrient content of E.intestinalis is not at extremely high levels but due to the changes in nutrient content seasonally, (highest protein content in summer; ash and vitamin C contents in spring; polyunsaturated fatty acids in autumn) E.intestinalis may be used in different seasons depending on the intended use. Tea, soup, spice products with additions recieved appreciation by consumers. The study revealed seaweed can also be used as an organic ingredient in some food products in the food industry. It is thought that, seasoning of these products will be a good alternative for fish consumers, healthy nutrition enthusiasts and people looking for new flavours. This will provide openings for new business areas with positive contributions to the economy. When emphasized benefits of these products on health are made public, people will gain new consumption habits and an alternative food source to land vegetables will be constituted.
ACKNOWLEDGEMENTS
This study was summarized from a master thesis and supported by Muğla Sıtkı Koçman University Scientific Research Projects (BAP) Coordinating Office with 2012/122 project no.
REFERENCES
Aguilera-Morales, M., Casas-Valdez, M., Carrillo-Dominguez, S., Gonzalez-Acosta, B., & Perez-Gil, F. (2005). Chemical composition and microbiological assays of marine algae Enteromorpha spp. as a potential food source. Journal of Food Composition and Analysis, 18: 79–88. doi:10.1016/j.jfca.2003.12.012
Akköz, C., Arslan, D., Ünver, A., Özcan, M.M., & Yılmaz, B. (2011). Chemical composition, total phenolic and mineral contents of Enteromorpha intestinalis (L.) Kütz. and Cladophora glomerata (L.) Kütz. Seaweeds, Journal of Food Biochemistry. 35: 513–523.
doi: 10.1111/j.1745-4514.2010.00399.x
Anonymous 2010. Milli Eğitim Bakanlığı, Gıda teknolojisi duyusal test teknikleri (in Turkish). Ankara, 72s.
AOAC (1990). AOAC Official Methods of Analysis (13th Ed.) Association of Official Analytical Chemists, Official Method 950.46, Washington, D.C., USA.
AOAC (1995). AOAC Offical Methods of Analysis, (14th. Ed.) Association of Official Analytical Chemists, Washington, DC., USA.
AOAC (2000). AOAC Official Method 992.03., AOAC, 2000 Official Method 985.30.
AOAC (2001). Official Method 996.06 Fat (Total, Saturated and Unsaturated) In Foods, Hydrolytic Extraction Gas Chromatographic Method, First Action 1996 Revised 2001.
AOAC (2002). Protein content in meat. 928.08. Official Method of Analysis (17th ed.). Gaithersburg, Maryland: Association of Official Analytical Chemists.
AOAC (2006). Crude Fat Determination-Soxhlet Method, Meat technology information sheet, 1-3.
Burtin, P. (2003). Nutritional value of seaweeds. Journal of Environmental Agricultural and Food Chemistry, 2(4): 498-503.
Cesur, A., Keskin Çıtıroğlu, A., Bacak, G., & Onur, İ. (2014). Akyaka Beldesi (Gökova Körfezi, Muğla) sahil sedimanlarının bazı jeolojik özellikleri (in Turkish). Karaelmas Science and Engineering Journal, 4(1): 5-26. doi:10.7212%2Fzkufbd.v4i1.127
Çetingül, V. (2001). Petalonia fascia (O.F.Müll.) Küntze’nin biyokimyasal kompozisyonunun mevsimsel değişimi (in Turkish). Ege Journal of Fisheries and Aquatic Sciences, 18(1-2): 103-105.
Darcy-Vrillon, B. (1993). Nutritional aspects of the developing use of marine macroalgae for the human food industry. International Journal of Food Sciences and Nutrition, 44: 23–35.
Fırat, C., Öztürk, M., Taşkın, E., & Kurt, O. (2007). Caulerpa racemosa (Forsskål) J. Agardh’nın (Chlorophyceae=Yeşil Algler) biyokimyasal içeriği (in Turkish). Ege Journal of Fisheries and Aquatic Sciences, 24(1-2): 89– 91.
Garcia-Sartal, C., Barcilea-Alonso, M.C., Moreda-Pineiro, A., & Bermejo-Barrera, P. (2013). Study of cooking on the bioavailability of As, Co, Cr, Cu, Fe, Ni, Se and Zn from edible seaweed. Microchemical Journal, 108: 92–99. doi: 10.1016/j.microc.2012.10.003
Gökmen, V., Kahraman, N., Demir, N., & Acar, J. (2000). Enzymatically validated liquid chromatographic method for the determination of ascorbic and dehydroascorbic acids in fruit and vegetables. Journal Choromotgraphy A, 881(1-2): 309-316.
doi: 10.1016/S0021-9673(00)00080-7
Hussain, S.,Liba, A., & McCurdy, E. (2011). Validating the Agilent 7700x ICP-MS for the determination of elemental impurities in pharmaceutical ingredients according to draft USP general chapters<232>/<233>, Agilent Technologies, Publication number: 5990-9365EN.
Kılınç, B., Turan, G., Tekoğul, H., & Cirik, S. (2013). Kırmızı ve yeşil alglerden farklı yosun çorbalarının üretimi (in Turkish). 17. Ulusal Su Ürünleri Sempozyumu 2013 (p. 367) İstanbul, Türkiye: Sempozyum Özet Kitabı. Lee, S. M., Chung, S., Lee, O., Lee, H., Kim, Y., & Kim, K. (2008).
Developement of sample preparation, presentation procedure and sensory descriptive analysis of green tea. Journal of Sensory Studies, 23: 450-467. doi: 10.1111/j.1745-459X.2008.00165.x
Mamatha, B.S., Namitha, K.K., Senthil, A., Smitha, J., & Ravishankar, G.A. (2007). Studies on use of Enteromorpha in snackfood. Food Chemistry, 101: 1707–1713. doi: 10.1016/j.foodchem.2006.04.032
Manivannan, K., Thirumaran, G., Devi, G.K., Hemalatha, A., & Anantharaman, P. (2008). Biochemical composition of seaweeds from Mandapam coastal regions along Southeast Coast of India. American-Eurasian Journal of Botany, 1(2): 32-37.
McDermid, K.J., & Stuercke, B. (2003). Nutritional composition of edible Hawaiian seaweeds. Journal of Applied Phycology, 15: 513–524. doi: 10.1023/B:JAPH.0000004345.31686.7f
Nisizawa, K., Noda, H., Kikuchi, R., & Watanabe, T. (1987). The main seaweed foods in Japan. Hydrobiologia, 151–152(1): 5–29.
doi: 10.1007/BF00046102
Norziah, M.H., & Ching, C.Y. (2000). Nutritional composition of edible seaweed Gracilaria changgi. Food Chemistry, 68:m69–76.
doi: 10.1016/S0308-8146(99)00161-2
Ova Kaykaç, G., Cirik, Ş., & Tekinay, A.A. (2008). Yeşil deniz alglerinden Ulva rigida (C. Agardh)’nın besin kompozisyonu ve aminoasit içeriklerinin mevsimsel değişimi. Ege Journal of Fisheries and Aquatic Sciences, 25(1): 9-12.
Parekh, R.G., Maru, L.V. & Dave, M.J. (1977). Chemical composition of green seaweeds of Saurashtra Coast, Botanica Marina, 20(6): 359-362. doi: 10.1515/botm.1977.20.6.359
Pillai, V.K. (1956). Chemical studies on Indian seaweeds I.Mineral Constituents. The Proceedings of the Indian Academy of Sciences, 45: 3-29.
Ratana-arporn, P., & Chirapart, A. (2006). Nutritional evaluation of tropical green seaweeds Caulerpa lentillifera and Ulva reticulata. Kasetsart Journal (Natural Science), 40: 75-83.
Reyes, E.S.P., & Subryan, L. (1989). An improved method of simultaneous HPLC assay of riboflavin and thiamine in selected cereal product. Journal of Food Composition and Analysis,2: 41-47.
doi: 10.1016/0889-1575(89)90061-6
Rohani-Ghadikolaei, K., Abdulalian, E., & Ng, W. (2012). Evaluation of the proximate, fatty acid and mineral composition of representative green, brown and red seaweeds from The Persian Gulf of Iran as potential food and feed resources. Journal of Food Science and Technology, 49(6): 774-780. doi: 10.1007/s13197-010-0220-0
Sanchez-Machado, D. I., Lopez-Cervantes, J., Lopez-Hernandez, J., & Paseiro-Losada, P. (2004). Fatty acids, total lipid, protein and ash contents of processed edible seaweeds. Food Chemistry, 85: 439–444. doi: 10.1016/j.foodchem.2003.08.001
Sarojini, Y., & Sarma, N.S. (1999) Vitamin C content of some macroalgae of Visakhapatnam, eastcost of India. Indian Journal of Marine Sciences, 28: 408-412.
Senthil, A., Mamatha, B.S., Vishwanath, P., Bhat, K.K., & Ravishankar, G.A. (2011). Studies on development and storage stability of instant spice adjunct mix from seaweed (Eucheuma). Journal of Food Science and Technology, 48(6): 712–717. doi: 10.1007/s13197-010-0165-3 Siddique, M.A.M., Khan, M.S.K., & Bhuiyan, M.K.A. (2013). Nutritional
composition and amino acid profile of a sub-tropical red seaweed Gelidium pusillum collected from St. Martin’s Island, Bangladesh. Food Research International, 20(5): 2287-2292.
Turan, G. (2007). Su yosunlarının thalassoterapi’de kullanımı (in Turkish). Doktora Tezi, Ege Üniversitesi, İzmir, 207s.
Varlık, C., Özden, Ö., Erkan, N., Üçök Alakavuk, D. (2007). Kalite kontrol yöntemleri (in Turkish). Su Ürünlerinde Temel Kalite Kontrol. (p 160). İstanbul: İstanbul Üniversitesi Yayınları.
Yaich, H., Garna, H., Besbes, S., Paquot, M., Blecker, C., & Attia, H. (2011). Chemical composition and functional properties of Ulva lactuca seaweed collected in Tunisia. Food Chemistry, 128: 895–901.