ABSTRACT
ESSAYS ON FINANCIAL CONNECTIVITY AND STABILITY
Demir, M¨uge
Ph.D. in Department of Management Supervisor: Assoc. Prof. Dr. Zeynep ¨Onder
November 2019
This thesis investigates the structure of cross-border lending market by using network analysis and examines the relationship between financial connectivity and probabil-ity of systemic crises, controlling for macroeconomic variables. A country-level panel data set of BIS locational banking statistics for bank-to-bank and bank-to-non-bank cross-border lending markets including 177 countries is used in the analysis for the 1978-2016 period. Systemic crisis periods are retrieved from European Systemic Risk Board ( Lo Duca et al. (2017)) and Laeven and Valencia (2013, 2018). In the literature, there are two conflicting arguments on the relationship between finan-cial connectivity and stability. On the one hand, it is argued that an increase in the level of financial connectivity enhances financial stability by allowing financial institutions to absorb the negative impacts of a shock among many counterparties through risk sharing. On the other hand, depending on the structure of the finan-cial markets, it can also deteriorate finanfinan-cial stability by facilitating the spread of a shock from one institution to another, leading to an increase in systemic risk. We, first, examine cross-border bank-to-bank and bank-to-non-bank lending markets of 13 advanced economies. We find that an increase in financial connectivity reduces the probability of systemic crises. However, this effect is found to be mitigated or completely eliminated in credit boom and capital inflow upsurge periods in both
lending markets. Second, we examine European bank-to-bank and bank-to-non-bank cross-border lending markets comprised of 25 countries, during 1978-2016 period, as it allows us to test the effect of the level of financial integration measured by the level of financial connectivity on the probability of crisis. We find that while using the single currency, Euro, helps to improve the resiliency of EU in response to crisis in both networks, legislative-regulatory integration across member states without eliminating currency risk undermines the resiliency of the EU bank-to-bank lending network. During the excessive cross-border lending period, an increase in connec-tivity is found to raise the probability of crisis for both lending networks, regardless of the membership status. Finally, we extend our data set to 177 countries and examine the relationship between financial connectivity and stability in the global lending network. We find that in bank-to-bank lending network, an increase in global financial connectivity decreases the probability of crises, but this effect is found to be eliminated only in credit boom periods. On the other hand, an increase in local connectivity is found to be associated with an increase in the probability of crisis. This effect seems to be mainly driven by emerging countries, rather than advanced countries. In both lending markets we find that capital inflow periods do not affect the relationship between connectivity and probability of crisis. The findings suggest that policy-makers should design a financial market mechanism that can reduce risks associated with an increase in financial connectivity, while maintaining its benefits.
Keywords: Cross-border Banking, Financial Connectivity, Network Analysis, Sys-temic Crises
¨
OZET
F˙INANSAL BA ˘GLANTILILIK VE ˙IST˙IKRAR ¨UZER˙INE MAKALELER
Demir, M¨uge Doktora, ˙I¸sletme
Tez Danı¸smanı: Do¸c. Dr. Zeynep ¨Onder
Kasım 2019
Bu tez, a˘g analizi kullanarak sınır ¨otesi kredi piyasasının yapısını ara¸stırmı¸s ve makroekonomik de˘gi¸skenleri kontrol ederek, finansal ba˘glantılılık ve sistemik kriz olasılı˘gı arasındaki ili¸skiyi incelemi¸stir. 1978-2016 d¨onemi i¸cin yapılan analizde, 177 ¨ulkenin bankalar arası ve bankadan banka olmayan sekt¨ore sınır ¨otesi bor¸c verme piyasaları i¸cin BIS yerel bankacılık istatistikleri veri setinden elde edilen ¨ulke d¨uzeyinde panel veri kullanılmı¸stır. Sistemik kriz d¨onemleri Avrupa Sistemik Risk Kurulu (European Systemic Risk Board, Lo Duca et al. (2017)) ve Laeven ile Valen-cia (2013, 2018) ¸calı¸smalarından elde edilmi¸stir. Literat¨urde, finansal ba˘glantılılık ve istikrar arasındaki ili¸ski konusunda iki farklı g¨or¨u¸s yer almaktadır. Bir taraftan, finansal ba˘glantılılık seviyesindeki bir artı¸sın, ¸sokun olumsuz etkilerinin pek ¸cok fi-nansal kurum arasında payla¸sılması yoluyla absorbe edilmesine olanak sa˘gladı˘gı ve finansal istikrarı artırdı˘gı iddia edilmektedir. Di˘ger taraftan, finansal piyasaların yapısına ba˘glı olarak, ¸sokun bir kurumdan di˘gerine yayılmasını kolayla¸stırarak fi-nansal istikrarı bozabilece˘gi ve sistemik riskte artı¸sa neden olabilece˘gi iddia edilmek-tedir. ¨Oncelikle, 13 geli¸smi¸s ekonominin bankalar arası ve bankadan banka olmayan sekt¨ore sınır ¨otesi bor¸c verme piyasaları incelenmi¸s ve finansal ba˘glantılılıktaki bir artı¸sın sistemik kriz olasılı˘gını azalttı˘gı tespit edilmi¸stir. Bununla birlikte, bu etkinin
kredi patlaması ve sermaye giri¸si artı¸s d¨onemlerinde hem bankalar arası hem de bankadan banka olmayan sekt¨ore sınır ¨otesi bor¸c verme piyasalarında hafifledi˘gi veya tamamen ortadan kalktı˘gı bulunmu¸stur. ˙Ikinci olarak, 1978-2016 d¨oneminde, 25 ¨
ulkeden olu¸san Avrupa sınır ¨otesi bankalar arası ve bankadan banka olmayan sekt¨ore bor¸c verme piyasaları incelenmi¸stir. Bu piyasanın incelenmesi finansal ba˘glantılılık seviyesi ile ¨ol¸c¨ulen ¸ce¸sitli seviyelerdeki finansal b¨ut¨unle¸smenin kriz olasılı˘gı ¨uzerindeki etkisini incelemeye imkan tanımı¸stır. Tek para birimi olan Avro kullanımının, AB’nin her iki a˘gdaki krize kar¸sı dayanıklılı˘gını artırmaya yardımcı oldu˘gunu, ancak ¨uye de-vletler arasında kur riskini ortadan kaldırmadan yapılan yasama-d¨uzenleyici b¨ut¨unle¸smenin AB’nin bankalar arası sınır ¨otesi kredi piyasasında direnci zayıflattı˘gı g¨or¨ulm¨u¸st¨ur. Sınır ¨otesi a¸sırı bor¸c verme d¨oneminde, ¨uyeli˘gin durumuna bakılmaksızın her iki bor¸c verme a˘gı i¸cin finansal ba˘glantılılıktaki artı¸sın kriz olasılı˘gını artırdı˘gı bulunmu¸stur. Son olarak, veri setimizi 177 ¨ulkeye geni¸sleterek analiz s¨ureci boyunca global kredi piyasaları a˘gındaki finansal ba˘glantılılık ve istikrar arasındaki ili¸ski incelenmi¸stir. Bankalar arası bor¸c verme a˘gında, k¨uresel finansal ba˘glantılılıktaki bir artı¸sın kriz olasılı˘gındaki bir d¨u¸s¨u¸sle ili¸skili oldu˘gu bulunmu¸s, ancak bu etkinin sadece kredi pat-laması d¨onemlerinde ortadan kalktı˘gı tespit edilmi¸stir. ¨Ote yandan, yerel ba˘glantılılıktaki bir artı¸sın kriz olasılı˘gındaki bir artı¸sla ili¸skili oldu˘gu bulunmu¸stur. Bu etkinin, geli¸smi¸s ¨ulkelerden ziyade geli¸smekte olan ¨ulkelerden kaynaklandı˘gı g¨or¨ulm¨u¸st¨ur. Her iki bor¸c verme piyasasında da sermaye giri¸si d¨onemlerinin ba˘glantılılık ve kriz olasılı˘gı arasındaki ili¸skiyi etkilemedi˘gi g¨or¨ulm¨u¸st¨ur. Bulgular, politika yapıcının finansal ba˘glantılılıktaki artı¸sın faydalarını korurken, bununla ili¸skili riskleri azalta-bilecek bir piyasa mekanizması tasarlamayı hedeflemesi gerekti˘gini g¨ostermi¸stir.
Anahtar Kelimeler: A˘g Analizi, Finansal Ba˘glantılılık, Sınır ¨Otesi Bankacılık, Sis-temik Krizler
ACKNOWLEDGEMENTS
First and foremost, I would like to express my gratitude to my advisor, Assoc. Prof. Zeynep ¨Onder for her constant support throughout my Ph.D. studies. I am thankful for the trust she has put on me. I sincerely hope that I continue to work with her long into the future.
Second, I would like to thank the members of my thesis committee Assoc. Prof. S¨uheyla ¨Ozyıldırım and Prof. Nadir ¨Ocal, for their valuable time and comments throughout my dissertation research.
My special appreciation is reserved for Prof. Tanju Yorulmazer, who gave me the opportunity to visit University of Amsterdam. The time I spent there turned out to be a quite productive period for my Ph.D. studies. Moreover, I would like to thank Assist. Prof. G¨unseli T¨umer Alkan for her kindness and support throughout my visit.
Special thanks to the Faculty of Business Administration at Bilkent University for giving me a solid background and the opportunity to carry out my doctoral
research. I would like to also thank Assist. Prof. Ahmet S¸ensoy for his
encouragement and kind words at critical moments. Moreover, I would like to thank the members of our administrative staff for their constant assistance.
I am forever grateful to my mother Emel Esim and my beloved husband Engin Demir, for their constant, unconditional love and support, and for encouraging me to pursue my interests.
In addition, I would like to thank ˙Idil Ayberk, Pelin S¨umer, Murat Tini¸c, Zeynep Akg¨ul and Meltem Ba¸stan for their invaluable friendship and their support throughout my dissertation research .
I gratefully acknowledge the financial support provided by the Jean Monnet Scholarship Program Committee for funding part of this thesis.
TABLE OF CONTENTS
ABSTRACT . . . iii ¨ OZET . . . v ACKNOWLEDGEMENTS . . . vii TABLE OF CONTENTS . . . ixLIST OF TABLES . . . xii
LIST OF FIGURES . . . xxi
CHAPTER I: INTRODUCTION 1 1.1 Overview . . . 1
CHAPTER II: FINANCIAL CONNECTIVITY AND EXCESSIVE LIQUID-ITY: BENEFIT OR RISK? 6 2.1 Introduction . . . 6
2.2 Literature Review . . . 9
2.2.1 Empirical Literature . . . 10
2.3 Methodology . . . 13
2.3.1 Hypotheses and Empirical Model . . . 13
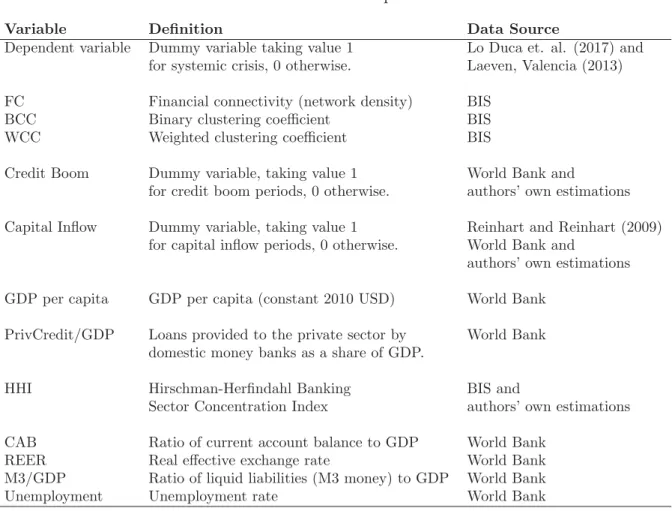
2.3.2 Definition of Variables . . . 15
2.3.3 Data . . . 20
2.4 Characteristics of the BB and the BNB Lending Networks . . . 22
2.4.1 Connectivity Measures . . . 22
2.4.2 Other Network Characteristics . . . 22
2.5 Regression Results . . . 26
2.5.1 The Relationship Between Financial Connectivity and Finan-cial Stability . . . 26
2.5.2 Credit Boom Periods . . . 27
2.5.3 Capital Inflow Periods . . . 29
2.5.4 Robustness Tests . . . 30
2.6 Conclusion . . . 34
CHAPTER III: DID EU(Z) AFFECT THE ROLE OF CONNECTIVITY ON FINANCIAL STABILITY? 46 3.1 Introduction . . . 46
3.2 Legislative-Regulatory Harmonization of EU Financial Markets . . . . 50
3.3 Data and Methodology . . . 53
3.4 Characteristics of the EU lending network . . . 59
3.4.1 Pre- and post- EU period . . . 59
3.4.2 Pre- and post- EUZ period . . . 60
3.5 Regression Results . . . 63
3.6 Robustness Tests . . . 65
3.7 Conclusion . . . 66
CHAPTER IV: FINANCIAL CONNECTIVITY AND STABILITY: EVI-DENCE FROM GLOBAL CROSS-BORDER LENDING MARKET 76 4.1 Introduction . . . 76
4.2 Data and Methodology . . . 77
4.3 Characteristics of the Global BB and BNB Lending Network . . . 79
4.4 Regression Results . . . 81
4.4.1 The relationship between financial connectivity and financial stability . . . 81
4.5 Robustness Tests . . . 86 4.6 Conclusion . . . 88
CHAPTER V: CONCLUSIONS 97
REFERENCES . . . 102 APPENDIX A: Data Description and Descriptive Statistics . . . 109 APPENDIX B: Robustness Tests Results for Core to Core Network . . . . 114 APPENDIX C: Robustness Tests Results for EU Network . . . 151 APPENDIX D: Global Lending Network Regression Results . . . 156 APPENDIX E: Robustness Tests Results for Global Lending Network . . . 173
LIST OF TABLES
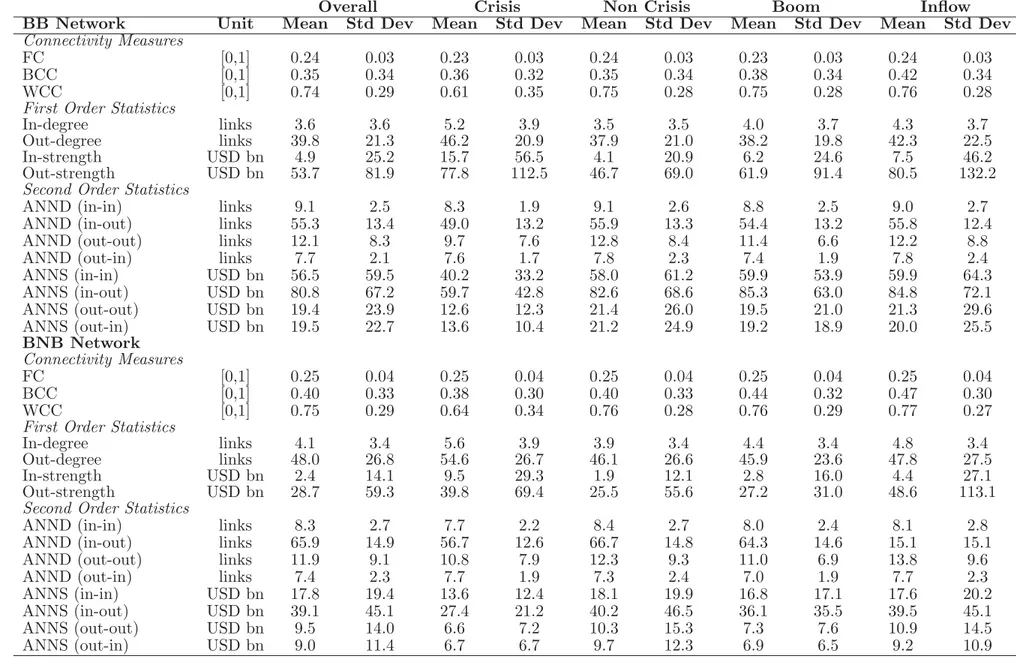
2.1 Descriptive network statistics . . . 39
2.2 Descriptive network statistics in selected years . . . 40
2.3 Results of the probit models controlling for credit boom periods . . . 41
2.4 Results of the probit models controlling for capital inflow periods . . 42
2.5 Results of probit models with interaction variable between credit boom periods and connectivity measures . . . 43
2.6 Results of probit models with interaction variable between capital inflow periods and connectivity measures . . . 44
2.7 Hypothesis testing . . . 45
2.8 Marginal effects . . . 45
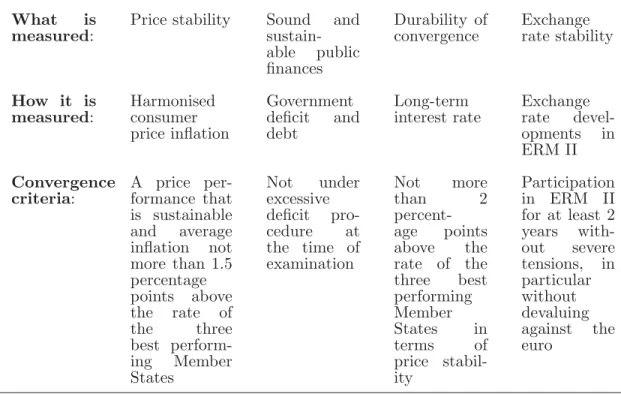
3.1 The four convergence criteria . . . 51
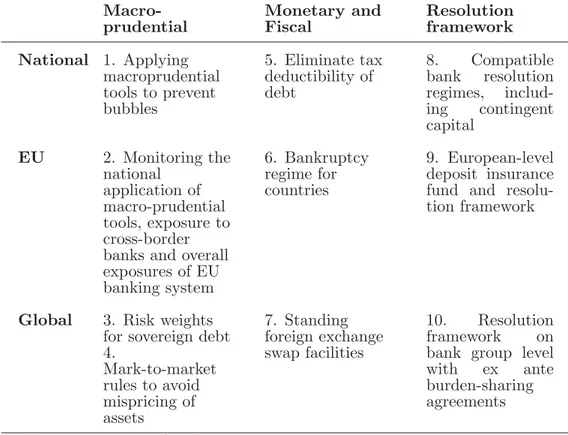
3.2 Policy recommendations for cross-border banks . . . 53
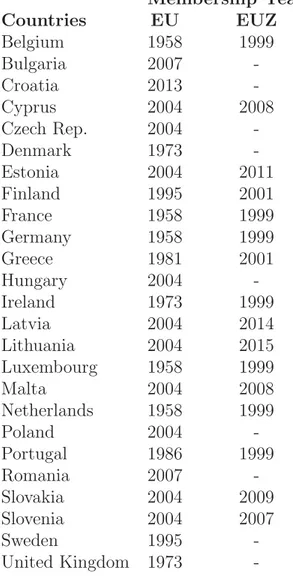
3.3 Membership years of the EU(Z) countries . . . 68
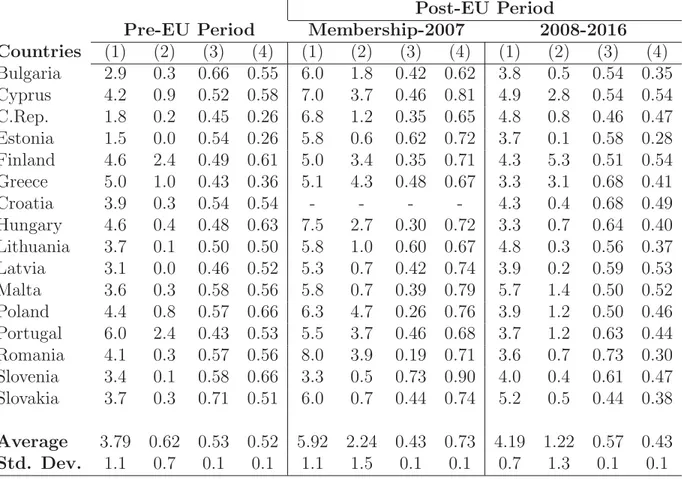
3.4 Mean values of network characteristics during the pre- and post-EU period for peripheral EU countries in BB lending market . . . 69
3.5 Mean values of network characteristics during the pre- and post-EU period for peripheral EU countries in BNB lending market . . . 70
3.6 Mean values of network characteristics during the pre- and post-EUZ period for core EU countries in BB lending market . . . 71
3.7 Mean values of network characteristics during the pre- and post-EUZ
period for core EU countries in BNB lending market . . . 72
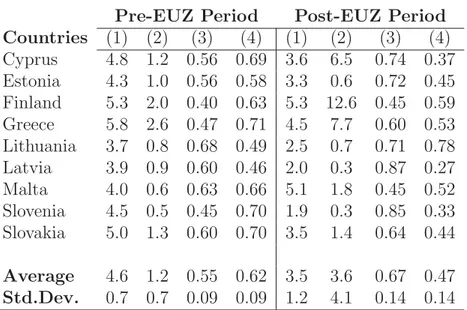
3.8 Mean values of network characteristics during the pre- and post-EUZ period for peripheral EU countries in BB lending market . . . 73
3.9 Mean values of network characteristics during the pre- and post-EUZ period for peripheral EU countries in BNB lending market . . . 73
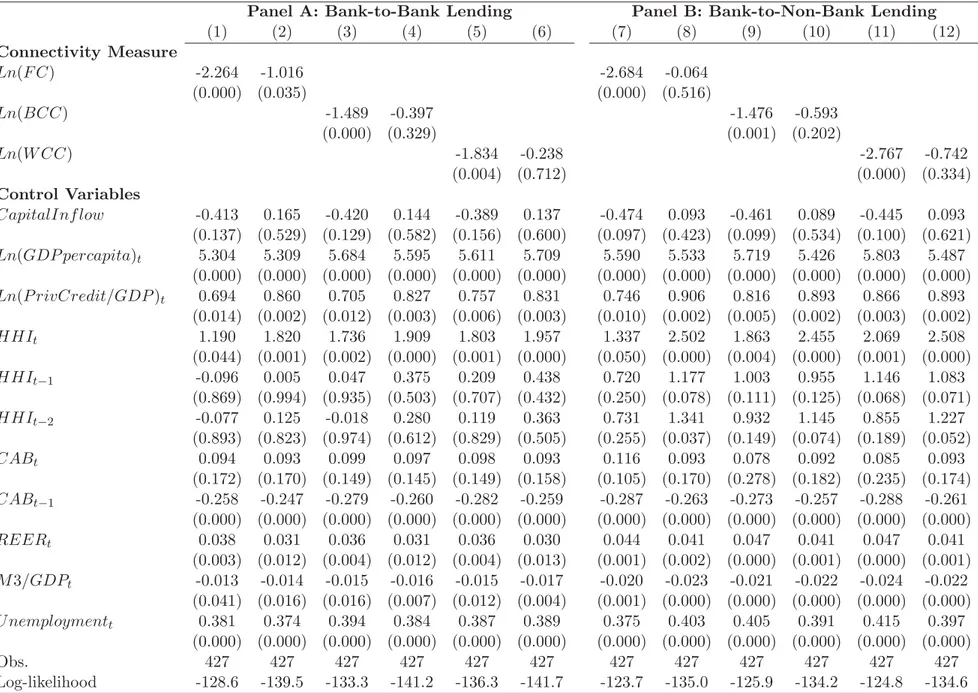
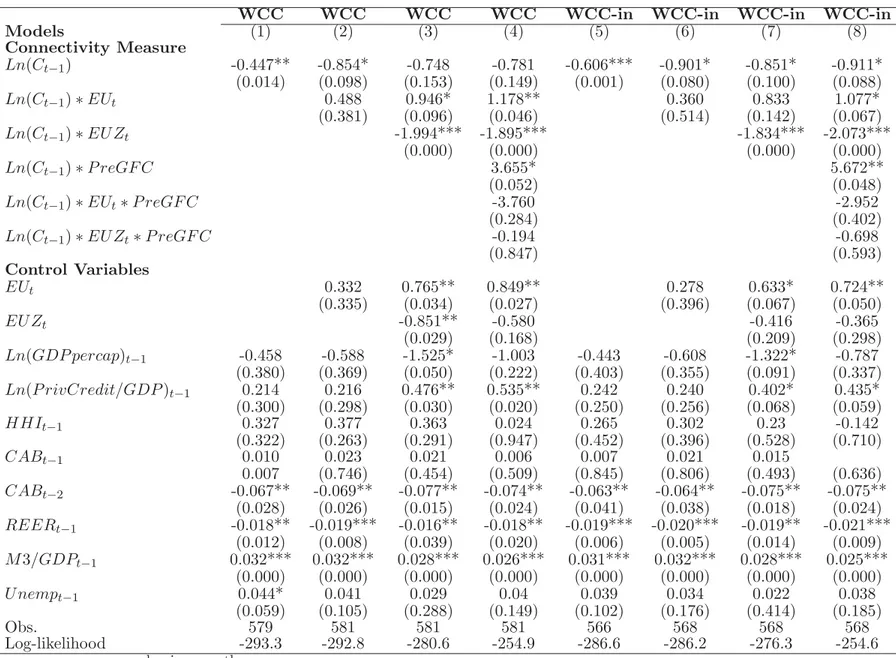
3.10 Probit model regression results for BB lending market . . . 74
3.11 Probit model regression results for BNB lending market . . . 75
4.1 Descriptive network statistics . . . 90
4.2 Descriptive network statistics in selected years . . . 91
4.3 Regression results summary for BB lending market . . . 92
4.4 Regression results summary for BNB lending market . . . 93
A.1 Data description . . . 109
A.2 Descriptive statistics . . . 110
B.1 Results of probit models for BB lending with interaction variable be-tween credit boom periods and connectivity measures, estimated with crisis dates from Laeven and Valencia(2013) . . . 115
B.2 Results of probit models for BNB lending with interaction variable between credit boom periods and connectivity measures, estimated with crisis dates from Laeven and Valencia(2013) . . . 116
B.3 Results of probit models for BB lending with interaction variable be-tween capital inflow periods and connectivity measures, estimated with the crisis dates from Laeven and Valencia (2013) . . . 117
B.4 Results of probit models for BNB lending with interaction variable between capital inflow periods and connectivity measures, estimated with the crisis dates from Laeven and Valencia (2013) . . . 118
B.5 Results of probit models for BB lending with interaction variable be-tween credit boom periods and connectivity measures, estimated with crisis dates from Laeven and Valencia(2018) . . . 119 B.6 Results of probit models for BNB lending with interaction variable
between credit boom periods and connectivity measures, estimated with crisis dates from Laeven and Valencia(2018) . . . 120 B.7 Results of probit models for BB lending with interaction variable
be-tween capital inflow periods and connectivity measures, estimated with the crisis dates from Laeven and Valencia (2018) . . . 121 B.8 Results of probit models for BNB lending with interaction variable
between capital inflow periods and connectivity measures, estimated with the crisis dates from Laeven and Valencia (2018) . . . 122 B.9 Results of probit models for BB lending with interaction variable
be-tween credit boom periods and connectivity measures, estimated with the end of crisis dates from ESRB Lo Duca et al. (2017) . . . 123 B.10 Results of probit models for BNB lending with interaction variable
between credit boom periods and connectivity measures, estimated with the end of crisis dates from ESRB Lo Duca et al. (2017) . . . . 124 B.11 Results of probit models for BB lending with interaction variable
be-tween capital inflow periods and connectivity measures, estimated with the end of the crisis date from ESRB Lo Duca et al. (2017) . . . 125 B.12 Results of probit models for BNB lending with interaction variable
between capital inflow periods and connectivity measures, estimated with the end of the crisis date from ESRB Lo Duca et al. (2017) . . . 126 B.13 Results of probit models for BB lending with interaction variable
B.14 Results of probit models for BNB lending with interaction variable between credit boom periods and connectivity measures, GFC excluded128 B.15 Results of probit models for BB lending with interaction variable
be-tween capital inflow periods and connectivity measures, GFC excluded 129 B.16 Results of probit models for BNB lending with interaction variable
between capital inflow periods and connectivity measures, GFC excluded130 B.17 Results of probit models for BB lending with interaction variable
be-tween credit boom periods and connectivity measures, Luxembourg excluded . . . 131 B.18 Results of probit models for BNB lending with interaction variable
between credit boom periods and connectivity measures, Luxembourg excluded . . . 132 B.19 Results of probit models for BB lending with interaction variable
be-tween capital inflow periods and connectivity measures, Luxembourg excluded . . . 133 B.20 Results of probit models for BNB lending with interaction variable
be-tween capital inflow periods and connectivity measures, Luxembourg excluded . . . 134 B.21 Results of probit models for BB lending with interaction variable
be-tween credit boom periods and connectivity measures, US excluded . 135 B.22 Results of probit models for BNB lending with interaction variable
between credit boom periods and connectivity measures, US excluded 136 B.23 Results of probit models for BB lending with interaction variable
be-tween capital inflow periods and connectivity measures, US excluded 137 B.24 Results of probit models for BNB lending with interaction variable
B.25 Results of probit models for BB lending with interaction variable be-tween credit boom periods calculated as two standard deviation above of its historical country average and connectivity measures . . . 139 B.26 Results of probit models for BNB lending with interaction variable
between credit boom periods calculated as two standard deviation above of its historical country average and connectivity measures . . . 140 B.27 Results of probit models for BB lending with interaction variable
between capital inflow periods calculated as two standard deviation above of its historical country average and connectivity measures . . . 141 B.28 Results of probit models for BNB lending with interaction variable
between capital inflow periods calculated as two standard deviation above of its historical country average and connectivity measures . . . 142 B.29 Results of probit models for BB lending, controlling for three-way
interaction variable between connectivity, credit boom and capital in-flow periods (Ln(C) ∗ Boom ∗ Inf low) . . . 143 B.30 Results of probit models for BNB lending, controlling for three-way
interaction variable between connectivity, credit boom and capital in-flow periods (Ln(C) ∗ Boom ∗ Inf low) . . . 144 B.31 Results of logit models for BB lending, controlling for credit boom
periods . . . 145 B.32 Results of logit models for BB lending, controlling for capital inflow
periods . . . 146 B.33 Results of linear models for BB lending, controlling for credit boom
periods . . . 147 B.34 Results of linear models for BB lending, controlling for capital inflow
B.35 Results of probit models with random effects for BB lending, control-ling for credit boom periods . . . 149 B.36 Results of probit models with random effects for BB lending,
control-ling for capital inflow periods . . . 150 C.1 Probit model regression results controlling for Maastricht Criteria . . 151 C.2 Probit model regression results for BB lending market alternative
pre-crisis definitions . . . 152 C.3 Probit model regression results for BB lending market, estimated with
connectivity measures from global lending network . . . 153 C.4 Probit model regression results for BNB lending market, estimated
with connectivity measures from global lending network . . . 154 C.5 Probit model regression results controlling for ”EUt.P reGF C” and
”EU Zt.P reGF C” dummy variables . . . 155 D.1 Results of probit models for BB lending market controlling for credit
boom periods . . . 157 D.2 Results of probit models for BNB lending market controlling for credit
boom periods . . . 158 D.3 Results of probit models for BB lending market with interaction
be-tween connectivity and emerging country dummy variable, controlling for credit boom periods . . . 159 D.4 Results of probit models for BNB lending market with interaction
be-tween connectivity and emerging country dummy variable, controlling for credit boom periods . . . 160 D.5 Results of probit models for BB lending market controlling for capital
inflow periods . . . 161 D.6 Results of probit models for BNB lending market controlling for
D.7 Results of probit models for BB lending market with interaction be-tween connectivity and emerging country dummy variable, controlling for capital inflow periods . . . 163 D.8 Results of probit models for BNB lending market with interaction
be-tween connectivity and emerging country dummy variable, controlling for capital inflow periods . . . 164 D.9 Results of probit models for BB lending with interaction variable
be-tween credit boom periods and connectivity measures . . . 165 D.10 Results of probit models for BNB lending with interaction variable
between credit boom periods and connectivity measures . . . 166 D.11 Results of probit models for BB lending with interaction variable
be-tween connectivity, credit boom periods and emerging country dummy variable . . . 167 D.12 Results of probit models for BNB lending with interaction variable
be-tween connectivity, credit boom periods and emerging country dummy variable . . . 168 D.13 Results of probit models for BB lending with interaction variable
be-tween capital inflow periods and connectivity measures . . . 169 D.14 Results of probit models for BNB lending with interaction variable
between capital inflow periods and connectivity measures . . . 170 D.15 Results of probit models for BB lending with interaction variable
between connectivity, capital inflow periods and emerging country dummy variable . . . 171 D.16 Results of probit models for BNB lending with interaction variable
between connectivity, capital inflow periods and emerging country dummy variable . . . 172
E.1 Results of probit models for BB lending, controlling for interaction variable between credit boom periods and emerging country dummy variable (Boom ∗ Emergingt) . . . 174 E.2 Results of probit models for BNB lending, controlling for interaction
variable between credit boom periods and emerging country dummy variable (Boom ∗ Emergingt) . . . 175 E.3 Results of probit models for BB lending, controlling for interaction
variable between capital inflow periods and emerging country dummy variable (Inf low ∗ Emergingt) . . . 176 E.4 Results of probit models for BNB lending, controlling for interaction
variable between capital inflow periods and emerging country dummy variable (Inf low ∗ Emergingt) . . . 177 E.5 Results of probit models for BB lending, controlling for three-way
interaction variable between connectivity, credit boom and capital in-flow periods (Ln(C) ∗ Boom ∗ Inf low) . . . 178 E.6 Results of probit models for BNB lending, controlling for three-way
interaction variable between connectivity, credit boom and capital in-flow periods (Ln(C) ∗ Boom ∗ Inf low) . . . 179 E.7 Results of probit models for BB lending with interaction between the
variables and the dummy variable taking value of one for the post-crisis (2008-2016) period, controlling for credit boom periods. . . 180 E.8 Results of probit models for BNB lending with interaction between
the variables and the dummy variable taking value of one for the post-crisis (2008-2016) period, controlling for credit boom periods. . . 181 E.9 Results of probit models for BB lending with interaction between the
variables and the dummy variable taking value of one for the post-crisis (2008-2016) period, controlling for capital inflow periods. . . 182
E.10 Results of probit models for BNB lending with interaction between the variables and the dummy variable taking value of one for the post-crisis (2008-2016) period, controlling for capital inflow periods. . 183
LIST OF FIGURES
2.1 Bank-to-Bank and Bank-to-Non-Bank Lending Networks in 2007 and 2009 . . . 36 2.2 Financial Connectivity and International Bank Flows, Bank-to-Bank
Lending . . . 37 2.3 Financial Connectivity and International Bank Flows,
Bank-to-Non-Bank Lending . . . 38
3.1 Real Cross-Border Flows and Average Local Connectivity for EU Bank-to-Bank Lending Market, 1978-2016 . . . 47
4.1 Network Statistics, 1978-2016 . . . 94 4.2 Network Statistics, 1978-2016 . . . 95 4.3 Network Statistics, 1978-2016 . . . 96 4.4 Network Statistics, 1978-2016 . . . 96
CHAPTER I
INTRODUCTION
1.1.
Overview
This dissertation explores the structure of bank-to-bank and bank-to-non-bank cross-border lending markets and examines the relationship between financial connectivity across countries and probability of crises by using network analysis. Network analysis allows us to model complex linkages across countries and to understand the structure of the cross-border lending market and to measure its connectivity.
In the literature there are two conflicting arguments on the relationship between financial connectivity and stability. Based on a Diamond and Dybvig (1983) model, Allen and Gale (2000) show that in a fully integrated economy without frictions the higher the level of financial connectivity across agents, the higher the resiliency of the financial markets. However, there could be important deviations from this result in real world examples, as observed in the recent global financial crisis. Depending on the structure of the financial markets, an increase in financial connectivity can also deteriorate financial stability by facilitating the spread of a shock from one institution to another, leading to an increase in systemic risk. For example, Gai and Kapadia (2010) show that higher connectivity decreases
probability of default. Acemoglu et al. (2015) show that the extent of contagion across financial institutions determines the relationship between financial
connectivity and stability. In particular, financial networks in which banks are highly connected would be more resilient to shocks when the magnitude of negative shock is below a certain threshold; but above this threshold, financial connections deteriorate the resiliency of the system through shock propagation. Nier et al. (2007) find that at low levels of connectivity, even a small amount of increase in connectivity rises the probability of contagion, but at higher levels of connectivity, any increase in connectivity improves system’s resilience to shocks. By introducing different market characteristics such as excessive liquidity, imperfect information, moral hazard, asymmetric information, and indirect asset price contagion channels, Battiston et al. (2012a), Brusco and Castiglionesi (2007), Battiston et al. (2012b), Elliott et al. (2014), Caballero and Simsek (2013), Allen et al. (2012), and Caccioli et al. (2014) show that an increase in financial connectivity does not necessarily ensure financial stability.
Theoretical and empirical literature indicates that financial stability of the system is crucially dependent on the level of financial connectivity. Yet, how and in which direction financial connectivity affects financial stability are not clear. This
research, first contributes to this debate by investigating the relationship between probability of crisis and connectivity during normal, credit boom, and capital inflow periods, as excessive liquidity periods have a potential to cause systemic crisis by facilitating negative spillover effects across countries through cross-border holdings. In particular, empirical literature shows that credit boom and capital inflow periods at which financial markets are exposed to excessive liquidity, are associated with higher probability of crisis and instabilities in developed countries (e.g., Caballero, 2014; Jord`a et al., 2011; Schularick and Taylor, 2012). Second, we analyze the relationship between connectivity and stability for different borrower
types (banks and non-banks), as differences in characteristics of the borrowing sector may affect the relationship between financial connectivity and the
probability of crisis. For example, since bank-to-non-bank lending has a potential to be channeled into real economy through investments it may not lead to credit booms. Avdjiev et al. (2018) show that bank-to-bank cross-border lending is associated with credit booms whereas bank-to-non-bank lending is associated with credit busts. As another contribution, in examining the relationship between financial stability and connectivity, we calculate the financial connectivity both at global and at individual country levels. Fourth, we analyze the relationship between connectivity and stability within European cross-border lending market and show that while using the single currency, Euro, helps to improve the resiliency of European Union (EU) in response to crisis in both networks, legislative-regulatory integration across member states without eliminating currency risk damages the resiliency of the EU financial system for bank-to-bank lending network. Finally, the time coverage of the data allows us to analyze not only the recent global financial crisis of 2007-2008, but also all systemic crises in 177 countries and all systemic and idiosyncratic crisis in 25 European countries within the period of 1978–2016.
Throughout the analysis, a country-level panel data set for those countries is used for the 1978–2016 period. Cross-border flows are obtained from Bank for
International Settlements (BIS) Locational Banking Statistics (LBS).
In the second chapter of this thesis, we analyzed cross-border bank-to-bank and bank-to-non-bank lending markets of 13 advanced economies because any crisis initiated in the developed countries is likely to have more detrimental effects on the rest of the world, as observed in the recent global financial crisis of 2007-2008. In this chapter, we try to answer the following questions for bank-to-bank and
bank-to-non-bank cross-border lending markets: (i) is there a relationship between financial connectivity and financial stability measured by probability of systemic
crisis? (ii) does the observed relationship between financial stability and financial connectivity among countries change in credit boom and capital inflow periods? We find that a rise in financial connectivity reduces the probability of systemic crises. However, this effect is found to be mitigated or completely eliminated in credit boom and capital inflow upsurge periods in both markets.
In the third chapter, we examine bank-to-bank and bank-to-non-bank cross-border exposures across 25 European countries, including core members of European Union (EU), as well as candidate countries which joined the EU before the end of our analysis period, in the year 2016. Establishment of EU as early as 1958 and introduction of the Euro as a common currency in 1999 are important steps towards the financial integration of EU. To understand whether deeper financial integration is beneficial for the resiliency of the overall system, we analyze the European
cross-border lending market as it allows us to test the effect of the differing levels of financial integration through time on the probability of systemic as well as
idiosyncratic crises. In this chapter, we try to answer the following research questions for bank-to-bank and bank-to-non-bank cross-border lending market of 25 European countries during 1978-2016 period: (i) did legislative-regulatory integration of member states through EU membership enhance the positive effect of financial connectivity on financial stability, as documented by the theoretical literature? (ii) did the elimination of currency risk through single currency, Euro, contribute to financial stability benefits of connectivity? (iii) did being an EU and Eurozone (EUZ) member change these benefits during the pre-crisis period of 2004-2007 in which cross-border exposures rise rapidly and uninterruptedly? We find that while using the single currency, Euro, helps to improve the resiliency of EU in response to crisis in both networks, legislative-regulatory integration across member states without eliminating currency risk damages the resiliency of the EU in bank-to-bank lending network. During the excessive cross-border lending period,
an increase in connectivity is found to raise the probability of crisis for both lending networks, regardless of the membership status.
In the last chapter, we extend the coverage of our financial network to 177 countries, including advanced as well as emerging countries. This enables us to construct the global lending network and examine whether the relationship
documented between financial connectivity and stability and the interplay between this relationship and credit boom and capital inflow periods for cross-border
lending network of advanced economies change for the global cross-border lending network. We also test whether the so-called relationship between connectivity and stability change for emerging countries during excessive liquidity periods. As in the previous chapters, we analyze bank-to-bank and bank-to-non-bank lending
networks separately for the 1978-2016 period. We find that in bank-to-bank lending network, an increase in global financial connectivity is found to be
associated with a decline in the probability of crises, but this effect is found to be eliminated in credit boom periods, only. On the other hand, an increase in local connectivity is found to be associated with an increase in the probability of crisis. This relationship seems to be driven by emerging countries. In both lending markets we find that capital inflow periods do not affect the relationship between connectivity and probability of crisis.
CHAPTER II
FINANCIAL CONNECTIVITY AND
EXCESSIVE LIQUIDITY: BENEFIT OR RISK?
12.1.
Introduction
The global financial crisis (GFC) has increased the interest in understanding the relationship between financial connectivity and financial stability. In the literature there are two conflicting arguments on this relationship. On the one hand, it is argued that increase in the level of financial connectivity enhances financial
stability by allowing financial institutions to absorb the negative impacts of a shock among many counterparties through risk sharing (Allen and Gale, 2000). On the other hand, depending on the structure of the financial market, it can also deteriorate financial stability by facilitating the spread of a shock from one
institution to another, leading to an increase in systemic risk (for example, Gai and Kapadia, 2010; Nier et al., 2007). In this study, we analyze the relationship
between financial stability and financial connectivity in bank-to-bank (BB) and bank-to-non-bank (BNB) cross-border lending market of 13 advanced countries2 during the 1978-2016 period. We employ network analysis which is a useful tool for
1
This chapter is published in Demir and ¨Onder (2019). 2
We examine only advanced countries because any crisis initiated in the developed countries is likely to have more detrimental effects on the rest of the world, as observed in the recent GFC. Cross-border flows among these countries represent more than 85% of global cross-border flows.
modelling linkages across countries in order to understand the structure of the cross-border lending market and to measure its connectivity.3
We try to answer the following questions: (i) is there a relationship between financial connectivity and financial stability measured by probability of systemic crisis? (ii) does the observed relationship between financial stability and financial connectivity among advanced economies change in credit boom and capital inflow periods? Excessive liquidity periods have a potential to cause systemic crisis by facilitating negative spillover effects across countries through cross-border holdings, as observed in the recent GFC. Empirical literature show that credit boom and capital inflow periods at which system is exposed to excessive liquidity, are
associated with higher probability of crisis and instabilities in developed countries (e.g., Caballero, 2014; Jord`a et al., 2011; Schularick and Taylor, 2012).
We analyze cross border flows4 going to banking and non-banking sector,
separately, because differences in characteristics of the borrowing sector may affect the relationship between financial connectivity and the probability of crisis. For example, cross-border lenders incur higher monitoring efforts with respect to the non-bank borrowers (e.g. Avdjiev et al., 2018; Martinez, 2015). The shorter maturity of BB loans compared to BNB loans makes it easier to cut back lending and may cause instabilities (Aiyar et al. (2014). The relation between the
borrowing sector and the phase of the credit cycle that the economy underwent are likely to affect the relationship between the probability of crisis and the level of connectivity in each lending market. In Avdjiev et al. (2018) study, while BB cross-border lending is found to be associated with credit booms, BNB lending is found to be associated with credit busts. One may expect this result as BB lending
3
For examples of the use of network analysis to examine financial crisis, see Allen et al. (2009). For review of different applications of network analysis in finance, see Allen and Babus (2009).
4
The importance of analyzing cross-border capital flows for macroprudential policymakers is discussed in the Amiti et al. (2019) study.
has a potential to accelerate money creation process, leading to a credit boom whereas BNB lending has a potential to be channeled to real economy through investments.
Our work contributes to the literature in three ways. First, we show that the observed relationship between financial connectivity and the probability of crisis changes during excessive liquidity periods, represented by credit boom and capital inflow periods in both networks. Second, we show that this relationship also depends on the type of the borrowing sector: banking versus non-banking. Third, the time coverage of the data allows us to analyze all systemic crises within the period of 1978-2016, including the recent GFC as well as the 2014 European debt crisis.
We find that an increase in the level of financial connectivity among advanced economies reduces the probability of systemic crises controlling for macroeconomic and other country characteristics. However, this effect is found to be mitigated or completely eliminated in credit boom and capital inflow periods. In particular, we find that an increase in the level of connectivity has a substantial destabilizing effect during credit boom periods in BB lending market, but we do not observe this effect in BNB lending market. On the other hand, an increase in the level of
connectivity during capital inflow periods is found to have destabilizing effects in both markets, but the effect is found to be limited to short-term in the BNB lending market. The results of network analysis indicate that cross-border flows and connectivity decrease considerably in the year when the GFC hit a country; a funding shift may have occurred from bank towards non-bank sector lending during crisis periods; and BNB lending market is more stable both in terms of the number and the amount of lending relationships and recovered faster than the BB lending market following the GFC.
2.2.
Literature Review
This study is related to two lines of literature. The first line of literature argues that the financial stability of the system depends crucially on the level of
connectivity among financial institutions. In their pioneering work, Allen and Gale (2000), based on a Diamond and Dybvig (1983) model, show that complete
networks, in which all possible symmetric bilateral relationships exist among banks, are much more resilient to liquidity shocks than incomplete networks, in which banks are only linked to one neighbor. The theoretical literature developed in the aftermath of the GFC has challenged the view that an increase in connectivity ensures financial stability (see Gai and Kapadia (2010), Battiston et al.
(2012a),Brusco and Castiglionesi (2007), Battiston et al. (2012b), Elliott et al. (2014), Caballero and Simsek (2013), Allen et al. (2012), Caccioli et al. (2014), Acemoglu et al. (2015)). This line of literature argues that the assumptions of the Allen and Gale model are extremely simplifying and do not reflect real complex linkages among financial institutions. They modify the assumptions of the Allen and Gale model by introducing different market characteristics such as imperfect information, moral hazard, asymmetric information, heterogeneity in terms of shock size, and indirect asset price contagion channels. For example, by extending the assumptions of the Allen and Gale model, Gai and Kapadia (2010)
demonstrate that higher connectivity decreases probability of default, but once contagion begins, rise in connectivity increases probability of default. More
recently, Acemoglu et al. (2015) show that the extent of contagion across financial institutions determines the relationship between financial connectivity and
stability. In particular, financial networks in which banks are highly connected would be more resilient to shocks when the magnitude of negative shock is below a certain threshold; but above this threshold, financial connections deteriorate the
resiliency of the system through shock propagation. The main implication is that increase in financial connectivity could damage the resiliency of the system
whenever the amount of total interbank lending within the market is large. Tonzer (2015), by investigating banking systems of 18 advanced economies during
1994-2012 period, reports that cross-border interbank linkages across countries could serve as an important channel of banking risk in financial turmoil times. It is important to note that although there are several theoretical studies showing that the relationship between financial connectivity and stability changes under different market characteristics, the empirical literature is relatively scarce.
The second line of literature that this study is related to argues that credit boom and capital inflow periods are associated with higher probability of crisis in developed countries. For example, Schularick and Taylor (2012) show that credit booms increase probability of crisis and amplify moral hazard and adverse selection problems in 14 developed economies during 1870-2008 period. By using the same data-set, Jord`a et al. (2011) report that for developed countries credit booms are found to be the single best predictor of financial instabilities and that capital inflows also plays role in increasing probability of crisis. This finding is supported by Caballero (2014) who shows that capital inflow upsurges increase probability of crisis from 4 percent to 14 percent, using 47 crisis periods experienced in 57
countries.
2.2.1
Empirical Literature
Empirical part of this study is related to the literature that uses network methodology to measure financial connectivity across financial institutions or countries. In measuring financial connectivity, we use network methodology because it allows us to assess not only the connectedness of the global lending network, but also how centrally located a country is within that network, and how
much that country is exposed to risks emanating from the relationships it has established among its neighbours, both in terms of the number and the amount of cross-border lending relationships 5.
Several studies examine the characteristics of the bank-to-bank lending network before and during the financial crisis. For example, by using the BIS cross-country data set similar to ours, Minoiu and Reyes (2013) show that the level of financial connectivity measured by network density is pro-cyclical for 184 countries during 1978-2010; it rises before banking and debt crises and diminishes in the aftermath. Although the coverage of network used by the authors are larger than ours, our results support this view by suggesting that cross-border flows and connectivity decrease considerably on the date when the recent GFC first hits a country, but tend to increase afterwards in both networks. In an another study, Chinazzi et al. (2013) find that network density decreased, but the asymmetry of network
statistics increased in the recent GFC for global cross country equity and debt markets of 70 countries. Hattori and Suda (2007) construct a network of cross-border bank exposures during the 1985-2006 period, for 215 countries, by using BIS consolidated cross-border exposure data, and find that the connectivity of the global banking network as measured by several network statistics has increased over time. Using more granular dataset, Hale (2012) studies syndicated loan market to construct a bank level network of bank-to-bank exposures during 1980-2010, and demonstrates that the connectivity of the network has increased
5
There are alternative ways of measuring financial connectivity. For example, Tonzer (2015) measures financial connectivity as the ratio of the sum of a country’s exposures within that network to the GDP and banking sector assets of that country. However, these measures do not show the position and importance of a country within the network. When the bilateral exposure data among financial institutions was not available, correlations among asset returns of financial institutions are widely employed in the literature (for example, see Billio et al. (2012)) to capture increased communalities across asset returns. Yet, the correlations specify the relationships between countries, but not within a network. Connectivity could also be measured through the return and volatility spillovers proposed by Diebold and Yilmaz (2009) and Diebold and Yılmaz (2014) (for example, see Chevallier et al. (2018) and Dungey et al. (2018)). Although this measure gives insights about bilateral connections and transmission of shocks across countries, it does not reflect how the overall network and the connections across countries evolve over time within that network.
over time, but the distributions of network measures used in the analysis have become more skewed and asymmetric. Kubelec and S´a (2012) support the view that the level of connectivity has increased over time, by using stock bilateral external asset and liabilities data of 18 countries during the 1980-2005 period. However, none of these studies examines the network characteristics of bank to non-bank lending market and assess its relationship with financial stability.
There are studies that examine the explanatory power of financial connectivity measured by network statistics as an early warning indicator. They find that financial connectivity has an early warning potential in predicting the incidence and the severity of crisis. For example, Minoiu et al. (2015) construct a global banking network by using BIS data on locational cross-border exposures of
countries during the 1978-2010 period, and demonstrate that financial connectivity has early warning potential in predicting systemic banking crisis, especially for the recent GFC. Chinazzi et al. (2013), by using bilateral cross country debt flows and equity investments data during the 2007-2008 period for 70 countries, show that higher connectivity reduces the severity of the crisis, yet, centrally located
countries within the network are more vulnerable in times of crisis. Studies using more granular bank level data sets have similar implications. For example,
Caballero (2015) estimates a financial integration measure based on several network statistics (indegree, outdegree, betweenness, clustering coefficients,
authority, and hub centrality) for interbank syndicated loan market and argue that financial integration measure has explanatory power in predicting the incidence of banking crisis. Although our aim is not to study the early warning power of financial connectivity as derived from network statistics, we use these outcomes as a rationale for examining the relationship between financial connectivity and stability.
connectivity and stability by simulating the possible impacts of a shock resulting from the failure of one or more financial institutions on the rest of the financial network. Some of these papers use actual balance sheet data (see for example, Dasgupta (2004); Degryse and Nguyen (2007); Furfine (2003); Gai and Kapadia (2010); Iyer and Peydro (2011); Levy-Carciente et al. (2015); Nier et al. (2007); Upper and Worms (2004)), and some of them use predicted balance sheet data (see for example, Mistrulli (2011); Paltalidis et al. (2015); Wells (2004)) due to the lack of bilateral, disaggregated data on bank exposures. In simulating shocks, they assume that total interbank exposures are equally distributed across banks.
However, this is a strong assumption that might affect the reliability of the results. Also, simulation studies often provides results for one country at a specific time period that can not be generalized.
2.3.
Methodology
2.3.1
Hypotheses and Empirical Model
Based on the existing literature, first we test whether there is a negative
relationship between financial connectivity and the probability of systemic crisis, controlling for macroeconomic and country characteristics. Second, we test whether the observed relationship changes in credit boom and capital inflow periods at which there is excessive liquidity in the market. Hypotheses are tested separately for BB and BNB lending networks.
The following probit models are estimated to test the hypotheses by using the annual bilateral cross-border exposures of 13 advanced economies 6 during the 1978-2016 period:
6
These countries are Belgium, Denmark, France, Finland, Germany, Ireland, Japan, Luxem-bourg, Netherlands, Sweden, Switzerland, UK and US.
P (crisisit= 1 | Cit, Dit, Xit) = Φ(αi+ β1.Cit+ β2.Dit+ Γ.Xit) (2.1)
P (crisisit = 1 | Cit, Dit, Xit) = Φ(αi+ β1.Cit+ β2.Dit+ β3.Cit.Dit+ Γ.Xit) (2.2)
where i and t stand for country and time, respectively. The dependent variable is a financial stability indicator that takes a value of 1 if there is a systemic crisis in country i in year t, and 0; otherwise. Cit represents financial connectivity measure. It is measured for the overall network (globally) and for individual countries
(locally). Dit corresponds to a dummy variable taking a value of 1 in credit boom or capital inflow periods, and 0; otherwise. Xit represents a vector of
macroeconomic control variables and αi represents the country fixed effects. The models are estimated with the lagged values of connectivity measures and dummy variables, as well to analyze whether the impact of financial connectivity and excessive liquidity on the probability of crisis changes with lag.
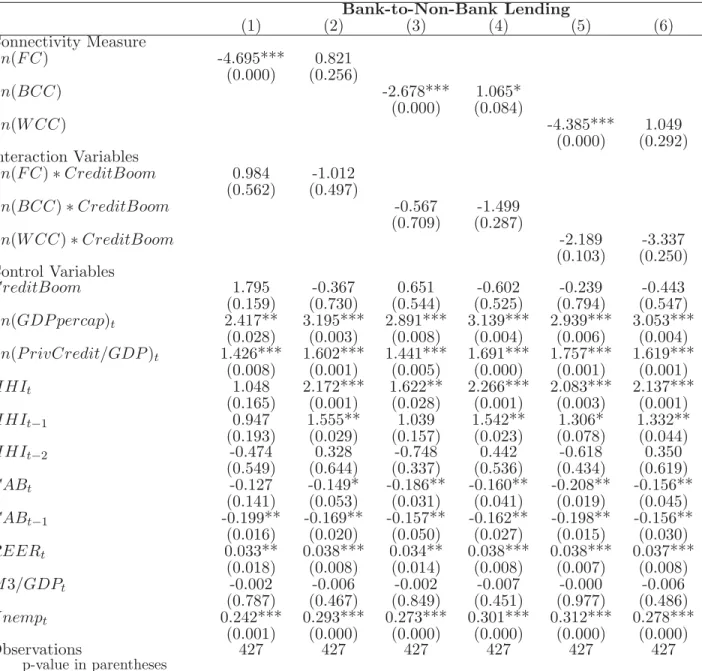
Financial connectivity is calculated by using three connectivity measures of network analysis. The first one measures connectivity of the overall network. The other two measure the unweighted and weighted connectivity of a country where weights are determined by the normalized cross-border flows between any two countries. These measures are calculated for BB and BNB lending networks, separately. We also investigate whether the results are sensitive to the connectivity measure used in the analysis.
Based on the results of Allen and Gale (2000), the coefficient of β1 is expected to be negative; that’s an increase in financial connectivity would reduce the
and/or capital inflow periods, we expect this effect to deteriorate because increased liquidity could facilitate the distribution of negative spillovers among countries, as documented in the theoretical and empirical literature. Hence, the coefficient of the interaction variable between financial connectivity and the dummy variable
indicating credit boom or capital inflow periods, namely β3, is expected to be positive. The significance of this coefficient will be more pronounced in the BB lending network than the BNB lending network because banking sector lending may enhance credit boom through money creation process whereas BNB lending does not enhance booms as loans are channelled into real economy. Finally, both theoretical and the empirical literature predicts a positive coefficient for dummy variables indicating capital inflows and credit boom periods, as booms and inflows are found to be associated with financial crisis in developed countries.
2.3.2
Definition of Variables
Crisis Variable: We use the systemic crisis definition of the European Systemic Risk Board (Lo Duca et al., 2017). They determine the start and the end dates of crises in European countries by using a quantitative approach based on a financial stress index and an expert judgment from national and European authorities. They assume that a crisis starts if at least one of the following occurs in that year: “(i) the emergence of systemic financial stress in asset markets, (ii) the first policy response in relation to the crisis, or (iii) the first failure of a major market player, depending on which date is earlier and/or considered appropriate by national authorities (Lo Duca et al., 2017).” The end date of a crisis is defined as a date when the post crisis adjustment period is completed, and fiscal and monetary policies become broadly neutral.7 The systemic crisis dates for 11 EU countries are
7
Lo Duca et al. (2017) propose two approaches regarding the end date of the crisis; end of crisis management date and system back to normal date. The former one points out the end of the acute phase of the crisis and does not include post-crisis adjustment period. We adopt the second approach to become more conservative in our crisis definition, as systemic risk may increase during
taken from Lo Duca et al. (2017). The crisis dates for Japan and US are retrieved from Laeven and Valencia (2013).8
Financial Connectivity Measures:9 Financial connectivity measures are calculated by using network analysis. In the network analysis, each country
represents a node, and cross-border lending relationships across countries represent links. The links are weighted by normalized cross border flows across countries. The network is assumed to be directed as there are cross border flows from a lender to a borrower country, but not necessarily vice versa. Each year is modelled as a separate, weighted and directed network. Three measures are used in estimating financial connectivity. They are network density (also known as global financial connectivity, FC), binary clustering coefficient (BCC), and weighted clustering coefficient (WCC).
FC measures the global connectivity level of a network in the year t. It is defined as the number of links observed in the network divided by the total possible number of links. It represents the probability of a connection between two
countries in the network. This statistic is widely used in the literature to define the topology of the overall network (see Minoiu and Reyes, 2013; Minoiu et al., 2015; Chinazzi and Fagiolo, 2013; Hale, 2012; Hattori and Suda, 2007; Caballero, 2015).
The second connectivity variable, BCC measures a country’s own level of (i.e., local) connectivity within the network. It expresses the likelihood that any two the adjustment period and countries may experience another crisis.
8
Lo Duca et al. (2017) specify the systemic crisis dates for the European countries as follows: Belgium (2008-2016), Switzerland (1991-1994; 2010-2016) Germany (2001-2004; 2007-2016), Den-mark (1987-1994; 2008-2013), Finland (1991-1998), France (1991-1999; 2008-2016), United King-dom (1991-1994; 2007-2016), Ireland 2016), Luxembourg 2016), Netherlands (2008-2016), and Sweden (1991-1997; 2008-2016). According to Laeven and Valencia (2013), the crisis dates for Japan is the period of 1997-2001, and for US it is 1988 and the period of 2007-2011.
Although we use the systemic crisis dates suggested by the European Systemic Risk Board for European countries, we also estimate the models by using the banking crisis dates suggested by Laeven and Valencia (2013) for all countries in the sample. The results are discussed in the Robustness Tests section in detail.
9
For technical definitions and detailed discussions of connectivity measures and other network statistics, see Network Measures section in Appendix A.
counterparties of a country are also counterparties of themselves. In other words, it is the probability that two counterparties of a country are connected to each other, so that all three form a closed triangle pattern relationship. In estimating financial connectivity, BCC assumes an unweighted and directed network. Similar to FC, BCC ignores the amount of cross-border flows between countries and considers only the number of lending relationships across countries. Its value ranges between 0 and 1; such that the higher the value of the BCC, the higher the probability of the country to form tightly connected neighborhoods.10
The third measure of financial connectivity, WCC also measures a country’s local connectivity level. Unlike BCC, it calculates the weighted probability that two counterparties of a country are also counterparties among themselves by putting more weight on stronger interactions with higher amount of cross-border flows. The weighted network analysis is particularly essential because it might provide
different insights regarding the network characteristics, as there has been significant increase in size of the cross-border flows during recent years. By definition, the higher the BCC and cross-border flows, the higher the value of WCC; the higher the number of countries that country of interest borrows or lends (i.e.counterparties of a country), the lower the WCC, due to the denominator effect. Any increase in WCC implies that cross-border flows grow faster than the
10
BCC takes into account the direction of linkages across countries with given flow patterns, as shown in the figure below.
number of the counterparties of a country.11
Credit Boom and Capital Inflow Periods: These periods are used to define excessive liquidity periods. To identify credit boom periods, we apply
Hodrick-Prescott (HP) filter to the percentage growth rate of
private-credits-to-GDP ratio12 and obtain de-trended series for each country and each year. If the de-trended series in a year for a country is one standard deviation above its country related historical average, that year is assumed to be a credit boom period for that country, as in Fielding and Rewilak (2015) and Caballero (2014). The credit boom dummy variable (CreditBoomit) takes the value of 1 in country i, at time t for credit boom periods, and 0 otherwise.
11
Example: The figure in the left hand side shows a hypothetical bidirectional (i.e. there is a two-way relationship between each node) weighted network composed of eight nodes (|V |= 8) and eleven bidirectional links (|E|= 2 ∗ 11) across the nodes. For a given node v, Nv is defined to be the number of adjacent nodes of v and b(v′, v′′) is defined to be the number of links between neighbours of v such that Nv= 4 and b(v′, v′′) = 2 ∗ 1, as links are bidirectional. Weights are normalized to 1. Then, the global (FC) and local (BCC and WCC) connectivity measures are calculated as follows: F C = |E| |V |×(|V |−1) = 2 ∗ 11 8 ∗ (8 − 1) = 11 28 BCC(v) = P v′,v′′∈Nvb(v ′, v′′) |Nv|×(|Nv|−1) = 2 ∗ 1 4 ∗ 3 = 2 ∗ 1 4 ∗ 3 = 1 6 W CC(v) = P v′,v′′∈Nvw(v ′, v′′) |Nv|×(|Nv|−1) = (2 ∗ 1) ∗ 30 ∗ 1 50 4 ∗ 3 = 1 10 12
Private-credits-to-GDP is defined as a ratio of loans provided to the private sector by domestic money banks to GDP. Using the ratio of private-credit-to-GDP, instead of the level of private credits, allows us to correct for pro-cyclical bank lending because the level of private credits is adjusted with the size of the economy.
Capital inflow dates during the 1978-2008 period are taken from Reinhart and Reinhart (2008). The method proposed by Caballero (2014) and Fielding and Rewilak (2015) is used to identify those dates for the rest of the sample. Using HP filter, we obtain the de-trended series of the ratio of foreign direct
investment-to-GDP for each country and the year. If the de-trended series in a year for a country is one standard deviation above its country related historical average, that year is assumed to be a capital inflow period for that country. Capital inflow dummy variable (CapitalInf lowit) takes the value of 1 in country i, at time t for capital inflow periods, and 0 otherwise.
Control Variables: The control variables are macroeconomic indicators that are widely used in the literature to examine the probability of crisis (see for example, Demirguc-Kunt and Detragiache, 1998; Demirg¨u¸c-Kunt and Detragiache, 2005; Minoiu et al., 2015). They include13 real GDP per capita, real effective exchange rate, private credit-to-GDP ratio, current account balance-to-GDP ratio, M3 money-to-GDP ratio, and unemployment rate. As suggested by Tonzer (2015), we also include the Herfindahl-Hirschman banking sector concentration index (HHI) in the model. It is measured as the summation of the squared value of the lenders’ share in borrower country’s total inflows, calculated separately for each borrower country in each network. In order to control for any other unobserved,
time-invariant, country specific factors that may affect probability of crisis, we incorporate country fixed effects into the model. All of the significant lagged values of macroeconomic variables are included in the model.
13
Descriptive statistics of all variables used in the estimations are presented in Table A.2 at the Appendix A.
2.3.3
Data
International banking flows from banks to banks and from banks to non-banks are defined as exchange rate adjusted flows in cross-border bank claims, from banks located in a particular country to another country in the sample. These flows include loans and deposits, debt securities, and other assets. Flows between any two countries correspond to either an increase or a decrease in cross-border assets of a reporting country with respect to another country. In the analysis, following Minoiu and Reyes (2013), we consider only positive flows and replace negative flows with zeros because positive flows are net investments (i.e. investments minus
repayments) whereas negative flows are net repayments. We sum the exchange rate adjusted changes of the four quarters to obtain annualized cross-border flows. Those flows are expressed in terms of constant 2016 US dollars.
Cross-border flows are obtained from BIS Locational Banking Statistics (LBS). Following the balance of payments approach, LBS is collected on a residency basis. Cross-border exposures are reported based on the location (i.e. residency) of the reporting bank, regardless of their owners’ nationality. In this respect, LBS covers the cross-border positions of all banks domiciled in the reporting area, including positions vis-a-vis their foreign affiliates. BIS also reports international banking statistics on a consolidated basis (CBS). CBS captures the consolidated positions of banks’ worldwide offices, including the positions of banks’ foreign subsidiaries and branches, but excluding inter-office activity with respect to the counterparty
country. Hence, in CBS, unlike LBS, it is the nationality of the reporting bank that matters, not the residency. Similar to Minoiu and Reyes, 2013, Minoiu et al., 2015, Tonzer, 2015 and Kalemli-Ozcan et al., 2013, we use LBS, rather than CBS for the following reasons: (i) Since, LBS follows balance of payments principle, it is
of capital flows; (ii) LBS has a longer time coverage than CBS; (iii) LBS provides exchange rate adjusted flow data, as well as stock data whereas CBS provides only stock data. For more information regarding BIS consolidated and locational
banking statistics, see McGuire and Wooldridge, 2005.
In BIS international banking statistics, bilateral cross-border balance sheet
positions of all individual banks from reporting countries are aggregated by bank, but they are disaggregated by the recipient country so that we can distinguish lender and borrower countries. The source of funds is the banking sector, whereas the recipient of funds can either be the banking sector or non-banking sector. The recipients of funds are used in identifying BB and BNB networks. The banking sector is composed of deposit money banks, offices controlled by the same banking group (subsidiaries and branches), and central banks. The non-bank sector includes non-bank financial corporations such as hedge funds, securities brokers, money market funds, pension funds, insurance companies, central clearing counterparties, development banks and other financial entities, non-financial corporations,
government entities, households and general government (public sector).14 HHI is calculated by using BIS data. All of the macroeconomic variables and series used to estimate credit boom and capital inflow dummy variables are obtained from the World Bank World Development Indicators and World Bank Global Financial Development Database.
14
2.4.
Characteristics of the BB and the BNB
Lend-ing Networks
2.4.1
Connectivity Measures
Before presenting the empirical findings about the relationship between financial connectivity and the probability of crisis, descriptive statistics of the characteristics of BB and BNB lending networks are presented in Table 2.1 for the period of 1978-2016, as well as for crisis, non-crisis, credit boom, and capital inflow periods.
The average global connectivity in BB lending network, that’s the probability that any two countries in the network are connected; is 58 percent during the sample period. The average local connectivity measured by BCC; the probability that any two counterparties of a country are also counterparties of themselves; is 60 percent. The BNB network is less connected than the BB network. Those figures are 54 percent and 57 percent, respectively in the BNB network. Connectivity measured by WCC rises up to 81 percent in both networks. This reflects the intensity of cross-border lending relationships among countries. On average, the highest levels of connectivity measures are observed in non-crisis periods in both networks, whereas the lowest levels are observed in crisis periods.
2.4.2
Other Network Characteristics
In addition to connectivity measures, several characteristics of the cross-border BB and BNB lending networks are presented in Table 2.1. These measures include in-and out-degree, in- in-and out-strength, average-nearest-neighborhood degree
(ANND), and average-nearest-neighborhood strength (ANNS).
out-degree statistics. We observe that in the BB network, countries borrowed from (lent to), on average, 7.5 (7.4) countries in non-crisis periods, whereas countries reduced the number of countries that they have borrowing (lending) relationship to 5.6 (5.8) in crisis periods. Similarly, in the BNB network, countries borrowed from (lent to), on average, 6.7 (7.3) countries in non-crisis periods whereas the figure reduced to 5.8 (6.1) during crisis periods. In both networks, the highest number of lending relationships was attained in non-crisis periods.
Strength measures indicate the amount of lending relationship across countries. We observe that during the overall analysis period, average cross-border flows
borrowed/lent across BB network (in- and out-strength statistics) is almost two times that of the BNB network, although there were, on average, similar number of creditors(debtors) in both networks (in- and out-degree statistics). The highest amount of average cross-border flows are observed at capital inflow periods in both networks. In particular, average cross-border flows received by the non-banking sector increased by 23.7 bn USD (from 20.6 bn USD to 44.3 bn USD) and those received by banking sector increased by 27 bn USD (from 46.5 bn USD to 73.5 bn USD) during capital inflow periods in comparison to non-crisis periods.
In the BNB network, we observe less fluctuation and lower amount of transactions. For example, countries borrowed from (lent to), on average, 21.5 bn USD (23.4 bn USD) during the overall analysis period. Those figures were 23.8 bn USD (25.8 bn USD) in crisis periods, 23.8 bn USD (20.2 bn USD) in credit booms, but increased to 44.3 bn USD (38.9 bn USD) in capital inflow periods. Cross-border flows are found to be more volatile during capital inflow periods in both networks, as observed by high standard deviations of the in- (out-) strength measures.15 Our findings also show that in the BNB network, average cross-border flows borrowed
15
The reason of higher volatility could be attributed to the large amount of cross-border flows to and from UK, US, France and Germany during 2005-2007 period.
from (lent to) increased from 20.6 bn USD (22.5 bn USD) in non-crisis periods to 23.8 bn USD (25.8 bn USD) in crisis periods. Similarly, in the BB lending network, average cross-border flows lent is increased from 44.1 bn USD in non-crisis periods to 51.5 bn USD in crisis periods.
The second order statistics support the previous finding that the average
connectivity in both networks declined during the crisis periods. For example, in the BB network, ANND (in-in) measure suggests that debtors of a debtor country received funding from, on average, 7.4 countries in non-crisis periods, but from only 6 countries in crisis periods. Similarly, the ANND (in-out) figure suggests that debtors of a creditor country received funding from, on average, 8.1 countries in non-crisis periods and 6.6 countries in crisis periods. In the BB network, average second order cross-border flows were highest in credit boom periods, and lowest at crisis periods, whereas in the BNB lending network, the flows were highest in crisis periods. For example, in BB network, the average ANNS (in-out) indicates that debtors of a creditor country received, on average, 60 bn USD in credit boom periods, but the figure declined to 49 bn USD in crisis periods. In BNB network, this figure was 24.2 bn USD in credit boom periods and reached to 31.1 bn USD in crisis periods. These values suggest that banks may prefer non-bank borrowers to bank borrowers during crisis periods.
In addition, we examine how both networks evolve during the pre- and the post-GFC periods (see Table 2.2 for detailed analysis). According to the Figure 2.1, that illustrates the BB and BNB lending networks in the pre- and the
post-GFC periods, BNB lending network seem closer to a complete network where all countries are connected with each other and denser than the BB lending
network in the post-GFC. This suggests that the BNB lending network was less severely affected from the recent GFC. These differences between networks may be explained by a funding shift from bank borrowers towards non-bank borrowers