To my beloved family…
DECIPHERING IKBKE INVOLVEMENT
IN
HEPATOCELLULAR CANCER HEPG2 CELLS
A THESIS SUBMITTED TO
THE GRADUATE SCHOOL OF ENGINEERING AND SCIENCE OF BILKENT UNIVERSITY
IN PARTIAL FULFILLMENT OF THE REQUIREMENTS FOR THE DEGREE OF MASTER OF SCIENCE
IN
MOLECULAR BIOLOGY AND GENETICS
By Erta Xhafa
ii
Deciphering IKBKE involvement in hepatocellular cancer HepG2 cells By Erta Xhafa
June 2020
We certify that we have read this thesis and that in our opinion it is fully adequate, in scope and in quality, as a thesis for the degree of Master of Science.
Serkan İsmail Göktuna (Advisor)
Onur Çizmecioğlu
Mesut Muyan
Approved for the Graduate School of Engineering and Science:
Ezhan Karaşan
iii Abstract
DECIPHERING IKBKE INVOLVEMENT IN HEPATOCELLULAR CANCER HEPG2 CELLS
Erta Xhafa
M.S. in Molecular Biology and Genetics Advisor: Serkan İsmail Göktuna
June, 2020
Hepatocellular carcinoma (HCC) is the second leading cause of cancer related deaths worldwide. The reasons behind high mortality in HCC patients include late diagnosis and lack of therapeutic option. Sorafenib is the only FDA approved systemic therapy for advanced HCC patients but it improves patients’ survival with only 4 months. For this reason, better understanding of the mechanisms of tumor initiation, development and drug resistance in HCC would create new treatment opportunities for HCC patients. In this study, the role of IKKε in HCC tumorigenesis is analysed. HCC development is tightly related to inflammation and IKKε is an inflammation related kinase with very well-known roles in regulating NF-κb and interferon signalling upon viral infection. However, it has also been linked to tumorigenesis of multiple cancers including breast cancer, pancreatic cancer and ovarian cancer. Loss of function models via shRNA or CRISPR/Cas9 are used to study the role of IKKε in HCC tumorigenesis. Depletion of IKKε in HepG2 cells improves the proliferation and anchorage-independent growth of the cells in vitro and it induces a decrease in the expression of EMT markers. Similarly, IKKε depleted HepG2 cells withstand higher doses of Sorafenib, hence, supporting a tumor suppressive potential of IKKε in tumor initiation stages. However, IKKε appears to be involved in EMT and upregulated in EGF and TGFβ1 signalling, two important signalling inducing EMT in HepG2 cells. IKKε is also shown to be upregulated in Sorafenib resistant HepG2 cells where its pharmacological inhibition sensitized Sorafenib resistant HepG2 cells to Sorafenib.
iv
These finding show an oncogenic potential of IKKε in later stages of tumor development including metastasis and drug resistance. The results presented in this study suggests a dual role of IKKε in HCC development and drug resistance. Therefore, further mechanistic analysis on this involvement could reveal IKKe inhibition as a potential therapeutic strategy for overcoming Sorafenib resistance in HCC patients.
v Özet
HEPATOSELÜLER KANSER HEPG2 HÜCRELERİNDE IKBKE’NİN NASIL YER ALDIĞININ ÇÖZÜMLENMESİ
Erta Xhafa
Moleküler Biyoloji ve Genetik Yüksek Lisansı Tez Danışmanı: Serkan İsmail Göktuna
Haziran, 2020
Hepatoselüler karsinom (HSK/HCC), dünya çapında kansere bağlı ölümlerin önde gelen ikinci nedenidir. Hepatoselüler karsinom hastalarındaki yüksek ölüm oranının altında yatan nedenler arasında geç tanı konulması ve yeterli terapötik seçeneklerin olmaması yer almaktadır. Sorafenib, ileri derece HCC hastaları için FDA tarafından onaylanmış tek sistemik terapi olmasına karşın hastaların yaşam süresini sadece 4 ay kadar uzatabilmektedir. Bu nedenle HCC’de tümör başlangıcı, gelişimi ve ilaç direnci mekanizmalarının daha iyi anlaşılması, HCC hastaları için yeni tedavi olanaklarının sunulması açısından büyük önem arz etmektedir. Bu çalışmada, IKKε’un HCC tümör oluşumundaki rolü incelenmiştir. HCC gelişiminin inflamasyon ile yakından ilişkili olmasının yanında IKKε, viral enfeksiyon durumunda interferon sinyal yolağının ve NF-κb’nin regülasyonunda rol oynayan inflamasyon ilişkili kinaz olarak bilinmektedir. Ek olarak meme kanseri, pankreas kanseri ve yumurtalık kanseri gibi pek çok kanserde, tümör oluşumunun başlaması ile ilişkilidir. Fonksiyon kaybı modelleri shRNA ya da CRISPR/Cas9 yöntemleri ile oluşturulmuş olup bu modeller kullanılarak IKKε’un HCC tümör oluşumu başlangıcındaki rolleri çalışılmıştır. HepG2 hücrelerinde IKKε delesyonu, hücrelerin in vitro proliferasyonlarını ve yüzey-bağımsız büyümelerini arttırmakta ve EMG (epitel-mezenkimal geçiş) belirteçlerinin ekspresyon seviyesinde düşüşe neden olmaktadır. Aynı doğrultuda; IKKε delesyonu gerçekleştirilen HepG2 hücreleri, Sorafenib’in yüksek dozlarına karşı direnç
vi
göstermekte ve buna bağlı olarak IKKε’un tümör başlangıç aşamalarındaki tümör baskılayıcı potansiyelinin bu sayede arttığı görülmektedir. Fakat, IKKε’un EMG’de rol aldığı ve HepG2 hücrelerinde EMG’yi indükleyen iki önemli sinyal yolağı olan EGF ve TGFß1 sinyal yolağında yukarı doğru düzenlendiği diğer bir deyişle ekspresyon seviyesi artmış durumda olduğu görülmektedir. Buna ek olarak; farmakolojik inhibisyon ile Sorafenib’e karşı dirençli olan HepG2 hücrelerinin Sorafenib’e duyarlı hale getirilmesi üzerine bu hücrelerde de IKKε’un yukarı doğru düzenlendiği gösterilmiştir. Bu bulgular, metastaz ve ilaç direnci gibi tümör gelişiminin ileri aşamalarında IKKε’un onkojenik potansiyelini göstermiştir. Dolayısıyla bu mekanizmayı anlamaya yönelik ileri analizler, HCC hastalarında Sorafenib direncinin üstesinden gelebilmek için IKKε inhibisyonunun yeni bir terapötik strateji olarak sunulması yolunda yeni olanaklar yaratabilme kapasitesine sahiptir.
vii
Acknowledgements
I would like to express my very great appreciation to my advisor Assist. Prof. Serkan İsmail Göktuna for his supervision throughout my graduate studies and trusting me with the projects. I have gained immense knowledge and experience all thanks to his guidance, support and feedback and I will always be grateful.
I am deeply in debt to Dr. Tieu Lan Chau for sharing all her expertise in the field with me. Her instructions, advices and support have been absolutely beneficial to me and to the finalization of this Master thesis and I will always be grateful.
I would like to express my deepest appreciation to my former professors and committee members: Assist. Prof. Onur Çizmecioğlu and Prof. Mesut Muyan for their intellectual guidance throughout my studies and in completion of this thesis.
I would like to acknowledge all the faculty, staff and members of the MBG Department in Bilkent University. They have made my graduate studies valuable, easier and unforgettable.
I owe my deepest gratitude to my family for the unconditional love. Nothing would have been possible without their full trust in my choices. They have been my daily inspiration.
I am grateful to the unconditional support, love and patience that my Suard has given to me, motivating and encouraging me in the most difficult days.
Lastly, I thank TÜBİTAK (117Z277) for funding this research study and Bilkent University for supporting my graduate study.
viii Table of content Approval Page ... ii Abstract ... iii Özet ... v Acknowledgements ... vii
Table of content ... viii
List of Figures ... xi
List of Tables ... xii
CHAPTER 1: Introduction ... 1
1.1. Hepatocellular carcinoma ... 1
1.1.1. Molecular events in HCC ... 2
1.1.2. Surveillance, diagnosis, staging system and therapeutic options for HCC 1.1.1. Molecular events in HCC ... 4
1.1.3. Systemic therapy for advanced HCC patients ... 5
1.1.4. Mechanisms of sorafenib resistance ... 6
1.2. IKBKE gene ... 7
1.2.1. The role of IKBKE in innate immunity response ... 7
1.2.2. The role of IKBKE in oncogenesis ... 9
1.2.2.1. IKBKE expression levels in different cancers. ... 9
1.3. IKBKE’s association with different pathways in cancer ... 11
1.3.1. IKBKE and NF-κB ... 11
1.3.2. IKBKE and PI3K/AKT ... 12
1.3.3. IKBKE and HIPPO signalling pathway ... 13
1.3.4. IKBKE and other pathways ... 13
CHAPTER 2: Materials and Methods ... 15
2.1. Materials ... 15
ix
2.1.2. Kits ... 16
2.1.3. Cell culture components ... 17
2.1.4. Buffers ... 19
2.1.5. Antibodies ... 20
2.1.6. Primers ... 22
2.2. Methods ... 24
2.2.1. Cell lines, cell culture and reagents ... 24
2.2.2. Cryopreservation ... 24
2.2.3. Recovery of cryopreserved cells ... 24
2.2.4. Cell maintenance and propagation ... 25
2.2.5. Lentiviral shRNA/CRISPR-Cas9 transfection/ transduction ... 25
2.2.6. IKKε overexpression ... 26
2.2.7. CellTiter-Glo Luminescent cell viability assay ... 26
2.2.8. Cell Proliferation Reagent WST-1 ... 27
2.2.9. Real Time Cell Analysis (RTCA) – Proliferation ... 27
2.2.10. Colony Formation Assay ... 27
2.2.11. Anchorage independent growth assay ... 27
2.2.12. Cell cycle analysis through Propidium Iodide staining ... 28
2.2.13. Wound healing assay ... 28
2.2.14. Western Blotting ... 28
2.2.15. Real-Time PCR ... 29
CHAPTER 3: Results ... 30
3.1. HepG2 cell proliferation negatively correlates to IKKε expression. ... 30
3.2. HepG2 cells show more anchorage independence growth upon IKKε depletion ... 30
3.3. EMT status of HepG2 cells shifts upon depletion or ectopic expression of IKKε. ... 33
x
3.4. TGFβ1 induced proliferation in HepG2 cells is dependent on IKKε expression
... 35
3.5. IKKε is involved in TGFβ1 signalling through AKT activation ... 36
3.6. EGF signalling in HepG2 cells activates IKKε ... 37
3.7. Sorafenib resistance of HepG2 cells improves upon IKKε depletion or pharmacological inhibition ... 38
3.8. Preparation of HepG2 Sorafenib resistant cell lines ... 38
3.9. Sorafenib resistance of HepG2 SORA/B cells reduces upon pharmacological inhibition of IKKε ... 44
CHAPTER 4: Discussion ... 46
CHAPTER 5: Conclusion and Future Perspective ... 51
xi List of Figures:
Figure 1.1: Estimated worldwide incidences and mortality of top 10 cancer types ... 1 Figure 1.2: Molecular alterations contributing to HCC development ... 2 Figure 1.3: BCLC staging system for HCC patients ... 5 Figure 3.1: HepG2 cell proliferation negatively correlates to IKKε expression. ... 31 Figure 3.2: HepG2 cells show more anchorage independence upon IKKε depletion ... 32 Figure 3.3: EMT status of HepG2 cells is altered upon IKKε depletion ... 33 Figure 3.4: Ectopic expression of IKKε in HepG2 cells induces EMT shift ... 34 Figure 3.5: TGFβ1 induced proliferation in HepG2 cells is dependent on IKKε expression ... 35 Figure 3.6: IKKε is involved in TGFβ1 signalling through AKT activation ... 37 Figure 3.7: EGFR signalling in HepG2 cells activates and upregulates IKKε ... 38 Figure 3.8: Resistance of HepG2 cells to Sorafenib treatment improves upon IKKε depletion or pharmacological inhibition ... 39 Figure 3.9: Schematic represeantation of Sorafenib resistant HepG2 cell line
development ... 40 Figure 3.10: Sorafenib IC50 of HepG2 SOR cells ... 41 Figure 3.11: Stability of Sorafenib IC50 of HepG2 SORB9 cells upon removal of Sorafenib from culture medium ... 42 Figure 3.12: Morphology and expression of EMT markers in HepG2 SOR cells .... 43 Figure 3.13: IKKε is important for the survival of Sorafenib resistant HepG2 cells ... 45
xii List of Tables:
Table 2.1. Chemicals and reagents used in this study ... 15
Table 2.2. Kits used in this study ... 16
Table 2.3. Cell culture media, chemicals and reagents used in the study ... 17
Table 2.4. Buffers and their compositions ... 19
Table 2.5. Antibodies used in this study ... 21
Table 2.6. Primers used in this study ... 23
Table 2.7. Components for calcium phosphate transfection and their amounts ... 26
Table 2.8. List of plasmids used in lentiviral transfection ... 26
1
CHAPTER 1
Introduction
1.1. Hepatocellular carcinoma
Liver cancer is ranked sixth as the most common diagnosed cancer with over 800.000 new cases only in 2018 alone. Additionally, it is the third cause of cancer-related deaths with a significantly high mortality rate (Figure 1.1) [1]. Reasons behind the high mortality rate in liver cancer patients include late diagnosis and lack of therapeutic options [1]. Liver cancer incidences and mortality show geographical heterogeneity with significantly more cancer cases in developing and under-developed countries [1]. Moreover, liver cancer occurs more often in males than in females with a ration 3:1 despite the geographical location [1].
Figure 1.1: Estimated worldwide incidences and mortality of top 10 cancer types. Reproduced with permission from John Wiley & Sons, Inc. [1]
Hepatocellular carcinoma (HCC) is the primary liver cancer representing 85-90% of all liver cancer cases [2]. The main risk factors contributing to HCC development are chronic liver disease, chronic inflammation with hepatitis B or/and C (HBV, HCV), and cirrhosis [2]. Other risk factors include alcoholic liver disease, non-alcoholic fatty
2
liver disease, metabolic disorders, toxins and other genetic conditions [2]. Majority of these risk factors lead to cirrhosis, present in more than 80% of HCC patients, and ultimately HCC [2]. Moreover, the risk factors contribute to a nonresolving inflammation in liver where macrophages and other immune cells get infiltrated, cytokine production is dysregulated and the wound-healing response perpetuates causing fibrosis, cirrhosis and HCC. Hence, HCC is considered an inflammation-associated cancer where the inflammation in the microenvironment plays a pivotal role in disease progression.
1.1.1. Molecular events in HCC
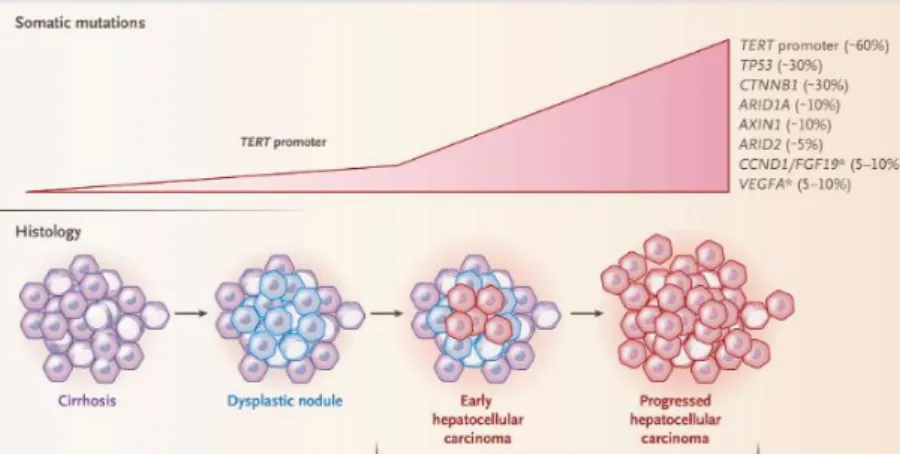
HCC develops in a multistep process. In most of the cases, it arises upon chronic liver damage, fibrosis and cirrhosis. Pre-cancerous nodules develop in cirrhotic livers and are known as low-grade dysplastic nodules (LGDNs) [3]. They advance into high-grade dysplastic nodules (HGDNs) which further progress into early stage HCC and latter advanced HCC (Figure 1.2.) [3]. As malignant transformation into HCC progresses, multiple genetic alternations accumulate inside a cancerous cell that affect aspects such as proliferation, invasion and metastasis. Very frequently, in different nodules of the same liver, more than 40 different somatic alternations can accumulate which can be a mixture of both genetic alternations and epigenetic modifications that can directly affect gene expression levels of tumor suppressors and oncogenes [3]. Hence, HCC is a very complex and heterogenous neoplasia where dysregulation of multiple pathways contributes to initiation, development and progression of the disease.
Figure 1.2: Molecular alterations contributing to HCC development. Reproduced with permission from Villanueva, 2019, Copyright Massachusetts Medical Society.
3
Frequently observed dysregulated signalling pathways that contribute to progression of nodules from LGDN to HGDN and finally HCC are WNT signalling, protein-folding machinery, expression of fetal genes and re-expression of telomerase enzyme due to mutations in TERT promoter [3]. Telomerase is not normally expressed in hepatocytes but its re-expression contributes to uncontrolled proliferation of hepatocytes in cirrhotic or non-cirrhotic liver and it is selected during malignant transformation. TERT promoter mutations are seen in more than 90% of HCC cases [3]. The most important promoters of HCC are HBV and HCV chronic infection. 80% of HCC cases occur in patients infected with HBV and 75% of patients infected with HCV develop HCC [3, 6]. HBV is a DNA virus that gets incorporated into the host genomic DNA. Even though the insertion is random, in some cases HBV infection is enough to induce the development of HCC in the absence of cirrhosis [3, 6]. Still, the most frequent insertion site for HBV is TERT promoter, hence telomerase gets activated upon infection [3]. Moreover, HBV X protein is shown to be able to regulate the important oncogenes such as c-Jun hence being an important effector in progression to HCC [6]. HCV is an RNA virus and its core protein affects the expression of RAS, an important oncogene, and has been shown to dysregulate p53 expression, an important tumor suppressor [6]. Furthermore, chronic infection with HBV and HCV contributes to a non-resolved inflammation in liver which in turn contributes to HCC development.
Multiple signalling pathways are associated with HCC progression. Activating mutation is CTNNB1 gene are frequently found in HCC patients infected with HBV [3, 7]. In these patients there is constitutive active WNT signalling due to active β-catenin. Constitutive active WNT signalling is also observed in patients with inactivating mutations in AXIN1 gene encoding for Axin-1 protein and more rarely in APC, a tumor suppressor gene [7]. RAS/RAF/MAPK and the PI3K–AKT–mTOR pathways are activated in many instances in HCC patients [3, 7]. Inactivating mutations in TSC1/2 (tuberous sclerosis 1/2) and in PTEN (phosphatase and tensin homologue) activate these pathways respectively. On the other hand, mutations in Ras family or BRAF are observed in less than 2% of HCC patients [3]. Other mechanisms altered in HCC include chromatin remodelling with mutations in enzymes epigenetically regulating gene expression and oxidative stress which is frequently found to be constitutively activated [3, 7].
4
Mutations in tumor suppressor genes are common in HCC patients. Continuous exposure to aflatoxin B1 (AFB) has been linked to p53 mutation and HCC progression [3, 6]. AFB is produced by aspergillus parasiticus and aspergillus flavus. It can be found in contaminated rice, corn and peanut and when consumed and metabolised is mutagenic [6]. It specifically induces p53 mutation in codon 249, a mutation which is not found in patients not exposed to AFB. Mutation in cyclin-dependent kinase inhibitor 2A (CDKN2A), retinoblastoma 1 (RB1), pI6INKa, and hypermethylation in p16 have also been observed in HCC patients contributing to disease progression [3, 6].
1.1.2. Surveillance, diagnosis, staging system and therapeutic options for HCC HCC development is asymptomatic till disease has progressed to advanced stages. For patients diagnosed at advanced stages, therapeutic options are limited and average overall survival (OS) is 6 months [4]. Hence, for patients at high risk of developing HCC regular surveillance is recommended. Under the high-risk group fall patients with or without cirrhosis but with chronic HBV or HCV infection [5]. Regular surveillance increases the chances of detecting HCC in earlier stages. Hence, patients can receive treatment and OS can be higher. Patients not under surveillance that are diagnosed with HCC have lower OS when compared to the under-surveillance peers due to diagnosis at an advanced stage and lack of therapeutic options [4].
Surveillance of patients for HCC development is performed mainly through abdominal ultrasound [4]. Lately, biomarkers are being used but their efficiency and accuracy remain controversial [4]. Detection of nodes bigger than 1cm in diameter is a sign of possible HCC development in the patient hence proper diagnosis should follow [4]. A diagnosis can be performed by non-invasive approaches such as radiology using MRI or CT or by invasive approaches such as biopsy and staining for HCC specific markers [4].
There are multiple HCC staging systems used in the world such as the Cancer of the Liver Italian Program (CLIP), the Hong Kong classification, the Japan Integrated Staging (JIS), the TNM system and the Barcelona Clinic Liver Cancer (BCLC) system [3, 4, 5]. None of them has been globally accepted but the most used one due to extensive validation is the BCLC system. A summarized representation of the BCLC system is represented in Figure 1.3. Patients with up to 3 nodules of 3cm in diameter
5
are considered very early or early stage (BCLC 0 and A) [3, 4, 5]. These patients can receive treatment options such as resection, transplantation and ablation [3, 4, 5]. Patients with multiple large tumors but asymptomatic and preserved liver functions are considered intermediate stage (BCLC B). These patients can receive transarterial chemoembolization. For advanced-stage HCC patients (BCLC C) having tumors spread beyond liver and showing cancer-related symptoms, systemic treatment with Sorafenib or Regorafenib are the only treatment options shown to improve survival [3, 4, 5].
Figure 1.3: BCLC staging system for HCC patients. Reproduced with permission from Springer Nature [3].
1.1.3. Systemic therapy for advanced HCC patients
Advances HCC has very poor prognosis due to lack of therapeutic options for patients. Sorafenib (Nexavar) is the only FDA approved systemic therapy for advanced HCC patients. It’s approval in 2007 was based on two randomized placebo-controlled phase III trials improving median patient survival from 7.9 months in placebo groups to 10.7 months in treatment groups [7, 9]. Despite the fact that these two trials were in geographically different locations (Sorafenib HCC Assessment Randomized Protocol (SHARP) in Europe, America and Australia and the sorafenib Asia-Pacific (AP) trial
6
in China, Taiwan and South Korea), they followed same criteria for patient inclusion and exclusion and the overall outcomes were comparable [9, 10]. Since then, Sorafenib is the standard treatment for HCC patients
Sorafenib is an orally administered tyrosine kinase inhibitor [8]. It has been shown to inhibit proliferation of cancer cells, induces cell death and blocks angiogenesis through inhibition of multiple receptor tyrosine kinases such as vascular endothelial growth factor receptor (VEGFR) 1, 2, 3, platelet-derived growth factor receptor β (PDGFR-β), KIT, RET, FLT-3, and some of the serine/threonine kinases in the MAPK signalling pathway including Ras, Raf, pSTAT3 [10, 13]. Moreover. Sorafenib is shown to induce downregulation of Bcl-2 proteins and induce p53 -upregulated-modulator-of-apoptosis hence promoting tumor cell death [10]. Additional data also suggest the role of Sorafenib in modulating an immune response against tumor cells through enhancing tumor-specific T cells [10].
Nonetheless, majority of the advanced HCC patients treated with Sorafenib, eventually develop resistance. In 2017, Regorafenib was approved as a second-line treatment for advanced HCC patients progressing on sorafenib [8]. In phase III trials, regorafenib showed survival benefit and an increase in median survival of patients tolerating sorafenib from 7.8 months in placebo group to 10.6 months [8]. Moreover, in 2019 ramucirumab and in 2020 combinatory treatment with nivolumab and ipilimumab were FDA approved for HCC patients progressing od Sorafenib [79, 80].
1.1.4. Mechanisms of sorafenib resistance
Despite the fact that Sorafenib is the only approved first-line systemic treatment for HCC patients, it can provide a survival advantage of only 3 months [12, 13]. Development of sorafenib resistance is a limiting factor for patients to fully benefit from treatment with this drug.
There are two types of resistance to Sorafenib: primary resistance and acquired resistance [11]. Primary resistance is due to the genetic heterogeneity of HCC making tumor cells resistant to Sorafenib. Even though the exact mechanisms are unknown, overexpression of EGFR, overactivation of Ras/Raf/MEK/ERK signalling pathway and amplification of VEGFR are some of the main genetic changes contributing to primary resistance to Sorafenib [11]. Furthermore, these molecular changes can be used as biomarkers to predict responsiveness of the patient to the drug.
7
Acquired resistance develops during treatment with Sorafenib [11]. Tumor cells undergo changes and activate certain mechanisms to overcome Sorafenib-induced cell death. One of the main signalling pathways activated in Sorafenib resistant tumor cells is PI3K/AKT pathway [11, 12]. PI3K/AKT signalling pathway activation provides proliferation and survival properties. Phosphorylation levels of AKT are higher in Sorafenib resistant cells, hence pharmaceutically inhibiting AKT is shown to resensitise cells to Sorafenib. c-Jun is also shown to be activated in Sorafenib resistant cells and similarly its inhibition improves Sorafenib-induced cell death [12].
Microenvironment is shown to be important in development of Sorafenib resistance. A hypoxic environment, common to many solid tumors, selects for transformed cancer cells able to survive under hypoxic conditions. Frequently these cells become extremely resistant to drug therapies including Sorafenib. This resistance is closely related to upregulation of HIF-1α and HIF-2α [11, 12].
Epithelial-mesenchymal transition (EMT) is also linked to Sorafenib resistance [11, 12, 13]. EMT occurs under hypoxic conditions in tumors and also under specific signalling such as TGFβ1 [13]. EMT is negatively affecting patient survival and contributes to drug resistance. The loop between Sorafenib resistance and EMT is still not fully understood. Sorafenib treatment inhibits EMT but sorafenib resistant tumor cells show reduced epithelial properties such as low E-cadherin and KRT19 expression levels and increase mesenchymal markers such as upregulated vimentin levels becoming more metastatic and invasive [12, 13].
1.2. IKBKE gene
1.2.1. The role of IKBKE in innate immunity response.
IKBKE, also known as IKKε and IKK-i, is a non-canonical serine/threonine kinase belonging to the inhibitor of κB (IκB) kinase family (IKK family). Other members of the IKK family include the canonical IKKs, IKKα and IKKβ which form a complex with NEMO, an adaptor protein also known as IKKγ, to activate NF-κB signalling through phosphorylation of IκB and subsequent Lys48-linked polyubiquitination and proteasomal degradation [14, 16]. TBK1 (Tank-binding kinase 1), as IKBKE, is also a non-canonical kinase of IKK family whose first discovery was based on sequence similarities to the canonical kinases and its interaction to TRAF family member-associated NF-κB activator (TANK) [15].
8
IKBKE gene is located at lq32 and contains 22 exons and its promoter contains active binding site for both NF-κB and STAT3 [14, 17]. IKBKE is an 80KD protein firstly isolated in 1999 as a novel kinase induced by lipopolysaccharide (LPS) and PMA in mouse macrophages, whereas its amino acid sequence was later analysed by Peters et al [18, 19]. IKBKE has 33% and 31% sequence homology to IKKα and IKKβ respectively, but 65% homology with TBK1 [14, 15]. Both IKBKE and TBK1 contain similar helix-loop-helix (HLH) and a leucine zipper (LZ) domain important in homo/heterodimerization and a ubiquitin-like domain essential in their kinase activities and regulation of downstream signalling [20]. IKBKE and TBK1 lack the NEMO-binding domain, present in IKKα and IKKβ, hence they cannot bind to NEMO and become part of the complex that activates NF-κB. Nevertheless, IKBKE and TBK1 are shown to form complexes with other scaffold proteins including TANK, NAK associated protein 1 (NAP1) and similar to NAP and TBK1 adaptor (SINTBAD) [16]. Moreover, it is suggested that IKBKE and TBK1 associate with different scaffold proteins in order to provide signal specificity [16]. An example of such case has been shown in specific interaction of IKBKE and TANK to phosphorylate and activate Interferon regulating factors (IRF) 3 upon LPS stimulation in TLR4 expressing cells [16].
Previous studies have shown that IKBKE is a viral-activated kinase very crucial in innate immune response [21]. It is activated by pattern-recognition receptors (PRR) found in the plasma membrane or cytoplasm of cells such as Toll-like receptors (TLR) 3 and 4 recognizing double stranded viral RNA and LPS respectively and RIG-1 recognizing cytosolic viral RNA [16]. Additionally, IKBKE is shown to be activated upon cytokines such as IL-6, IL-1, IFN-γ and TNF [14]. Upon adequate stimuli, IKBKE phosphorylates IκBα in Serine 536 and increase IκBα turnover when overexpressed in cells hence activate the NF-κB pathway [18]. Contradicting these results, IKBKE deficient mouse embryonic fibroblasts (MEFs) showed expected IκBα degradation upon TNF-α, LPS and IL-1β stimulation but deficient upregulation of numerous NF-κB-target genes including IL6, COX2 and MCP1 [22]. Possible reasons behind these results might rely on the fact that IKBKE was also found to phosphorylate p65/RelA subunit of NF-κB in Serine 536 required for further NF-κB activation and transcriptional response [14]. In IKBKE absence, adequate activation of NF-κB is not achieved. Moreover, IKBKE phosphorylates p65 in Serine 468 which further enhances
9
its activity [14]. Clearly, IKBKE plays a major role in modulating inflammatory responses through NF-κB pathway. However, this regulation of NF-κB cascade is not always positively affected Studies show that IKBKE and TBK1 are able to phosphorylate the canonical IKKs, IKKα and IKKβ, in their activation loops and negatively affect their kinase activity. TANK was shown to be necessary in mediating the interaction between these non-canonical and canonical IKKs [23].
In addition to regulating NF-κB signalling, IKBKE phosphorylates IRF3 and 7 in their C-terminal region and more specifically on Ser386, Ser396 and Ser402 of IRF3. IRF-3 and IRF-7 form homo- or heterodimers upon phosphorylation and are translocated to the nucleus where they transcriptionally regulate their target genes mainly type I IFN (IFN-α and IFN-β) [14].
There exists redundancy between IKBKE and TBK1 in IRF3 phosphorylation and activation. However, studies also show differences in their regulation mechanisms such as preferential abolishment of IKBKE activity by MyD88 upon TLR3 signalling [16]. Moreover, TBK1 is constitutively expressed in most tissues while IKBKE is an inducible kinase expressed in specific tissue types. Embryonic knockout of TBK1 in mice is lethal while IKBKE deficient mice are viable supporting the hypothesis that IKBKE and TBK1 control different aspects of signalling [21].
1.2.2. The role of IKBKE in oncogenesis
IKBKE’s role in activation of innate immunity has been established by multiple studies proving its importance. However, in recent years, new research has shown that IKBKE is not only involved in the innate immunity response and inflammation but also in oncogenic transformation and has been shown to be upregulated in many cancers including breast cancer, ovarian cancer and colon cancer and to modulate PI3K/AKT pathway, Hippo pathway and WNT signalling in addition to NF-κB pathways.
1.2.2.1. IKBKE expression levels in different cancers
IKBKE is normally expressed in thyroid, spleen pancreatic tissue, and peripheral blood leukocytes [20]. However, its expression has been related to many cancer types. Different studies on whole genome analysis have shown that IKBKE is highly expressed in both transcriptional and translational levels in multiple breast cancer cell
10
lines and in primary tumors [24, 25]. Moreover, IKBKE knockdown by using siRNA or its pharmacological inhibitors led to reduction in proliferation of breast cancer cells and cell cycle arrest in G0/G1 phase [26]. ICH staining and comparison of normal and esophageal squamous cancer tissue revealed IKBKE to be upregulated in 84% of cancer tissue [29]. High expression levels of IKBKE were also detected in gliomas through immunohistochemistry (ICH) on primary cancer tissues and IKBKE overexpression was shown to be directly correlating to the stage of glioma development [27]. IKBKE knockdown showed reduction in proliferation and G0/G1 cell arrest and inhibition of migration and invasion in in vitro and in vivo settings [28]. IKBKE was found to be overexpressed in gastric cancer and pancreatic ductal adenocarcinoma (PDAC) patients as shown by ICH analysis [30, 31, 32]. IKBKE silencing in PDAC cell lines showed inhibition of proliferation in vitro and slowed down tumor initiation and progression in vivo [33]. Additionally, IKBKE was shown to promote the establishment of an inflammatory tumor microenvironment and stimulated proliferation and cell survival of intestinal cell in colorectal cancer (CRC) [34]. IKBKE knockdown was shown to inhibit proliferation ability of some colorectal cancer cell lines and its overexpression contributed to Vincristine (VCR) resistance on colorectal cancer cells [35]. IKBKE was found to be overexpressed in ovarian cancer cells lines and primary tumor at both the protein and mRNA levels and its silencing resulted in a decrease in proliferation and invasion ability of ovarian cancer cell lines both in vitro and in vivo [36, 37]. Moreover, IKBKE expression levels were shown to be higher in metastatic carcinomas when compared to primary ovarian carcinomas [37]. Similar results were observed in renal clear cell carcinoma patients were metastatic tissues showed significantly higher IKBKE levels of expression than the primary carcinomas [38]. IKBKE expression levels were analysed by ICH in non-small cell lung cancer (NSCL) tumor samples and results showed IKBKE to be elevated in tumor tissues [39]. Additionally, NSCL cell lines showed elevated IKBKE expression [40]. Moreover, IKBKE expression was associated with smoking statues of the squamous cell carcinoma of lung (SCCL) patients and stage of tumor development in a study were paraffin-embedded tumor samples were analyzed [41]. Other cancer types were IKBKE was shown to be highly elevated include prostate cancer and adenocarcinomas, human T-cell leukemia virus type I (HTLV-1), acute myeloid leukemia (AML), melanoma and endometrial cancer [17]. Moreover, to our knowledge only one research has shown a correlation between IKBKE expression and
11
hepatocellular carcinoma (HCC). This study performed ICH analysis on primary tumor tissues and concluded that IKBKE was highly expressed (200 out of 220) in tumor tissue when compared to the adjacent non-tumorigenic tissues [42].
1.3. IKBKE’s association with different pathways in cancer 1.3.1. IKBKE and NF-κB
NF-κB is a regulator of hallmarks of cancer through transcriptional regulation of genes contributing to tumor initiation, development, metastasis and drug resistance [43]. NF-κB is constitutively expressed in many different types of human cancers. Constitutively active κB is a consequence on mutations in genes encoding for NF-κB transcription factors or in genes directly controlling NF-NF-κB activation [43]. Moreover, tumor cells secrete cytokines (IL-1β, Tα) that further more activate NF-κB activity to maintain a continuous inflammatory tumor microenvironment [43, 44]. Other stimuli apart from inflammatory cytokines that activate NF-κB include epidermal growth factor (EGF), LPS, viral infection, reactive oxygen species, DNA damage or other oncogenic stress [44]. Upon activation, NF-κB promotes cell proliferation through encoding of G1 cyclins like cyclin D1 and inhibition of apoptosis induced by TNF-α through activation of anti-apoptotic factors such as members of the BCL2 family and FLICE inhibitory protein (c-FLIP) [43]. Moreover, NF-κB promotes metastasis of tumors by activating transcription factors that stimulate epithelial-mesenchymal transition such as Twists1 and Snail [45]. Important involvement of NF-κB in tumor development include its direct regulation of tumor metabolism such as glucose intake through upregulation of GLUT3 and regulation of SCO2, very important in mitochondrial respiration. Lastly, oncogenic mutations in PI3K, EGFR, RAS and p53 promote NF-κB activation in tumor cells [45].
IKBKE is shown to be an activator of NF-κB pathway and display oncogenic properties in multiple cancer types. Different studies show that IKBKE promotes breast cancer tumorigenesis through activation of NF-κB pathway [24, 25, 26]. More specifically, IKBKE was shown to phosphorylate TRAF2 which promoted TRAF2 Lys63-linked polyubiquitination and recruitment and activation of the canonical IKKs, thereby activating NF-κB signalling and stimulating breast cancer development [46]. Moreover, IKBKE was shown to phosphorylate CYLD in breast cancer cell lines which diminished its suppressive impact on TRAF2 and NEMO, hence promoted
NF-12
κB activation and tumorigenesis [47]. Additionally, IKBKE stimulated the progression of glioma by promoting the translocation to the nucleus of two NF-κB subunits, p50 and p65 [27].
1.3.2. IKBKE and PI3K/AKT
The PI3K/AKT signalling pathway is constitutively activated in many cancers. It is one of the most important signalling pathways controlling cell survival, cell growth, cell metabolism, differentiation and motility in response to a variety of signals coming from G protein-coupled receptors (GPCR) and growth factor receptor tyrosine kinases (RTK) [48]. Oncogenic mutations including PIK3CA, PIK3R1, PTEN, AKT, TSC1, TSC2, LKB1, MTOR and various others contribute to aberrant activation of PI3K/AKT pathway observed in a wide range of cancers [49]. For this reason, a number of PI3K/AKT signalling pathway inhibitors have been approved for clinical use to chemotherapeutically treat cancer patients [48]. Examples of such drugs in use include temsirolimus, everolimus, idelalisib, and copanlisib [48].
IKBKE has been reported to activate AKT through direct phosphorylation on Ser-473, in AKT’s hydrophobic motif, and THR-308, in AKT’s activation loop, hence activating downstream signalling and promoting tumorigenesis [50].
A study in PDAC cell lines showed that IKBKE promote c-Myc nuclear translocation through phosphorylation and activation of a cascade involving AKT, GSK3β and lastly c-Myc, hence promoting tumorigenesis and metastatic potential of the cells [33]. Moreover, IKBKE was shown to be able to provide reactivation of AKT in mTOR inhibited PDAC cells contributing to insensitivity to mTOR inhibitors [51]. In breast cancer cell lines, TNF-dependent IKBKE expression was shown to be dependent on AKT2 activity where AKT2 deficient cells were unable to upregulate IKBKE upon TNF stimulation and AKT2 overexpressing cells increased IKBKE expression. Furthermore, IKBKE was downstream of AKT2 signalling, promoting breast cancer cell growth and survival [52]. Another study on breast cancer and NSCLC cells reported that IKBKE was able to phosphorylate FOXO3a, an important transcription factor downstream of AKT with known tumor suppressor roles, on Ser-644. Upon phosphorylation by IKBKE, FOXO3a is degraded hence apoptosis is inhibited and cell proliferation is promoted [53]. Such studies have shown that direct phosphorylation
13
and activation of AKT by IKBKE and regulation of downstream signalling is a possible mechanism of IKBKE contributing to oncogenesis.
1.3.3. IKBKE and HIPPO signalling pathway
Hippo signalling controls multiple function including tissue growth, tissue regeneration, and cell fate. Perturbation in the Hippo signalling and mutations or altered expression of genes related to Hippo signalling have been shown to promote tumorigenesis. Some of the main kinases involved in the Hippo signalling include mammalian Ste20-like kinases 1/2 (MST1/2), large tumor suppressor 1/2 (LATS1/2), yes association protein (YAP) and TAZ, its paralog [55]. Hippo signalling can be regulated upon a variety of intracellular and extracellular signalling including mechanical stress, cell adhesion, GPCRs such as lysophosphatidic acid (LPA) and sphingosine 1-phosphate (S1P) and EGFR and VEGFR signalling [54, 55]. Upon activation of the Hippo pathway, phosphorylated MST1/2 activates LATS1/2, which then in turn phosphorylates YAP/TAZ inhibiting their activity [42].
Recently, multiple studies have shown a role of IKBKE in regulating Hippo pathway through interactions with the kinases involved in this signalling pathway. IKBKE is shown to interact and phosphorylate YAP protein upon TNFα stimulation in MCF7, a breast cancer cell line. Moreover, IKBKE overexpression promoted YAP interaction to TEAD transcription factors [56]. In glioblastoma cell lines, IKBKE was shown to directly interact to YAP1 and TEAD2 and IKBKE downregulation inhibited EMT transition through Hippo pathway [57]. Additionally, the same research group showed that IKBKE regulated Hippo signalling by promoting the degradation of LATS1/2 kinases and inactivation of Hippo pathway, hence Amlexanox, IKBKE inhibitor, suppressed glioblastoma tumor growth [58]. Moreover, IKBKE was shown to promote the translocation of YAP1 to nucleus by preventing its phosphorylation on Ser127 and degradation, thereby promoting glioblastoma progression [58].
1.3.4. IKBKE and other pathways
IKBKE was demonstrated to be downstream of Epidermal Growth Factor Receptor (EGFR) and interacting with it in NSCLC cells lines [40]. Moreover, it was shown that IKBKE was activated by mutated EGFR through phosphorylation on two residues, Tyr153 and Tyr179, thereby promoting proliferation, invasion and resistance to EGFR inhibitors of NSCLC cells lines in both in vitro and in vivo settings [40]. In breast
14
cancer cells, knockdown of IKBKE negatively affected the EGFR expression levels, an association which was also shown through ICH in breast cancer specimens [59]. Moreover, IKBKE deficiency in β-catenin activated models of intestinal cancer development resulted in less tumor incidences and prolonged survival [34]. This study also shows that IKBKE promotes the establishment of an inflammatory microenvironment in intestine, hence promoting tumorigenesis [34].
15
CHAPTER 2
Materials and Methods
2.1. Materials
All materials used in this study are mentioned in the sections below. 2.1.1. Chemical and reagents
A full list of all the chemicals and reagents used throughout this study can be found in Table 2.1.
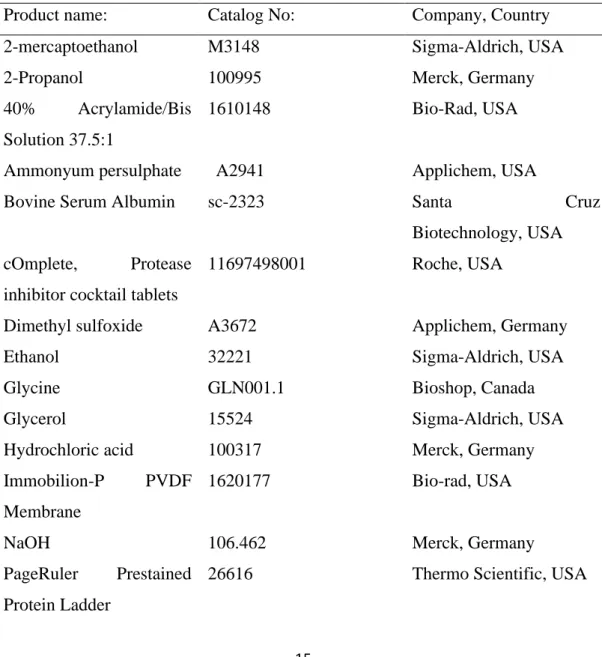
Table 2.1. Chemicals and reagents used in this study.
Product name: Catalog No: Company, Country
2-mercaptoethanol M3148 Sigma-Aldrich, USA
2-Propanol 100995 Merck, Germany
40% Acrylamide/Bis
Solution 37.5:1
1610148 Bio-Rad, USA
Ammonyum persulphate A2941 Applichem, USA
Bovine Serum Albumin sc-2323 Santa Cruz
Biotechnology, USA
cOmplete, Protease
inhibitor cocktail tablets
11697498001 Roche, USA
Dimethyl sulfoxide A3672 Applichem, Germany
Ethanol 32221 Sigma-Aldrich, USA
Glycine GLN001.1 Bioshop, Canada
Glycerol 15524 Sigma-Aldrich, USA
Hydrochloric acid 100317 Merck, Germany
Immobilion-P PVDF
Membrane
1620177 Bio-rad, USA
NaOH 106.462 Merck, Germany
PageRuler Prestained Protein Ladder
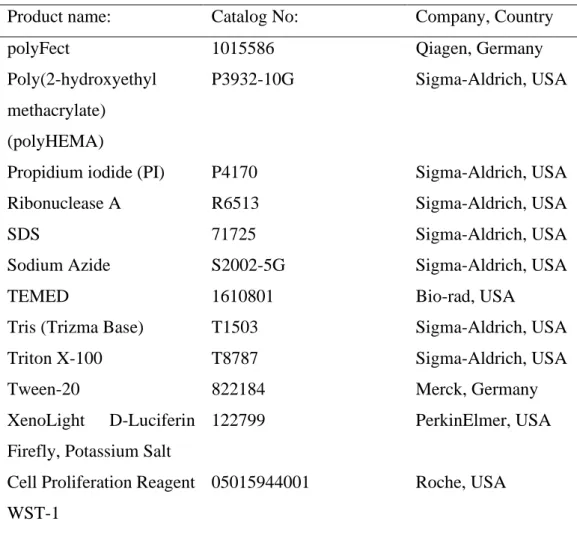
16 Table 2.1. Chemicals and reagents used in this study.
Product name: Catalog No: Company, Country
polyFect 1015586 Qiagen, Germany
Poly(2-hydroxyethyl methacrylate)
(polyHEMA)
P3932-10G Sigma-Aldrich, USA
Propidium iodide (PI) P4170 Sigma-Aldrich, USA
Ribonuclease A R6513 Sigma-Aldrich, USA
SDS 71725 Sigma-Aldrich, USA
Sodium Azide S2002-5G Sigma-Aldrich, USA
TEMED 1610801 Bio-rad, USA
Tris (Trizma Base) T1503 Sigma-Aldrich, USA
Triton X-100 T8787 Sigma-Aldrich, USA
Tween-20 822184 Merck, Germany
XenoLight D-Luciferin Firefly, Potassium Salt
122799 PerkinElmer, USA
Cell Proliferation Reagent WST-1
05015944001 Roche, USA
2.1.2. Kits
A list of all the kits used throughout this study can be found in Table 2.2. Table 2.2. Kits used in this study.
Product name: Catalog No: Company, Country
CellTiter-Glo® Luminescent Cell Viability Assay G7571 Promega, USA CellTiter-Glo® 3D Cell Viability Assay G9683 Promega, USA
Click-iT Plus EdU Alexa
Fluor 488 Flow
Cytometry Assay Kit
C10633 Invitrogen, USA
E.Z.N.A. Plasmid DNA Maxi Kit
17 Table 2.2. Kits used in this study.
Product name: Catalog No: Company, Country
E.Z.N.A. Plasmid DNA Mini Kit
D6943-01 Omega bio-tek, USA
E.Z.N.A. Total RNA Kit I R6834-02 Omega bio-tek, USA
eBioscience Annexin
V-FITC Apoptosis
Detection Kit
BMS500FI/300 Invitrogen, USA
iScript cDNA Synthesis Kit
170-8891 Bio-Rad, USA
LightCycler® 480
SYBR® Green Master
04887352001 Roche Diagnostics, USA
LookOut Mycoplasma
PCR detection kit
MP0035 Sigma-Aldrich, USA
Pierce BCA Protein Assay Kit
23227 Thermo Scientific, USA
Pierce ECL Western
Blotting Substrate
32106 Thermo Scientific, USA
SuperSignal West Femto
Maximum Sensitivity
Substrate
34095 Thermo Scientific, USA
SYBR Premix Ex Taq II (Tli RNaseH Plus), Bulk
RR820L TaKaRa, Japan
2.1.3. Cell culture components
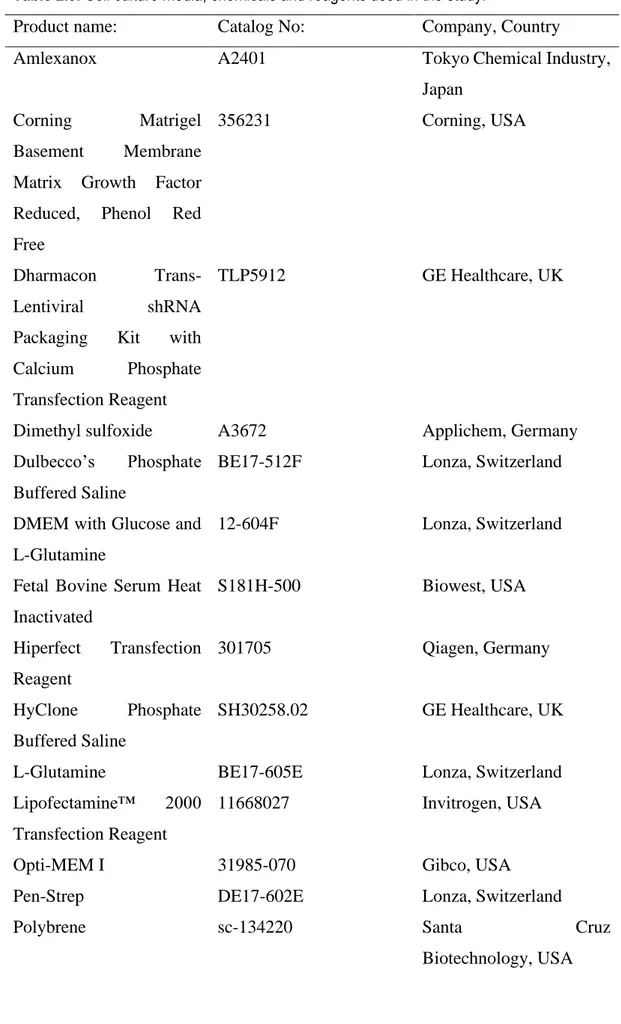
A list of all the components used in culturing cells can be found in Table 2.3. Table 2.3. Cell culture media, chemicals and reagents used in the study.
Product name: Catalog No: Company, Country
Animal-Free
Recombinant Human
EGF
18
Table 2.3. Cell culture media, chemicals and reagents used in the study.
Product name: Catalog No: Company, Country
Amlexanox A2401 Tokyo Chemical Industry,
Japan
Corning Matrigel
Basement Membrane
Matrix Growth Factor Reduced, Phenol Red Free
356231 Corning, USA
Dharmacon
Trans-Lentiviral shRNA
Packaging Kit with
Calcium Phosphate
Transfection Reagent
TLP5912 GE Healthcare, UK
Dimethyl sulfoxide A3672 Applichem, Germany
Dulbecco’s Phosphate Buffered Saline
BE17-512F Lonza, Switzerland
DMEM with Glucose and L-Glutamine
12-604F Lonza, Switzerland
Fetal Bovine Serum Heat Inactivated S181H-500 Biowest, USA Hiperfect Transfection Reagent 301705 Qiagen, Germany HyClone Phosphate Buffered Saline SH30258.02 GE Healthcare, UK
L-Glutamine BE17-605E Lonza, Switzerland
Lipofectamine™ 2000
Transfection Reagent
11668027 Invitrogen, USA
Opti-MEM I 31985-070 Gibco, USA
Pen-Strep DE17-602E Lonza, Switzerland
Polybrene sc-134220 Santa Cruz
19
Table 2.3. Cell culture media, chemicals and reagents used in the study.
Product name: Catalog No: Company, Country
PolyFect Transfection Reagent
301105 Qiagen, Germany
Puromycin ant-pr-1 Invivogen, USA
Recombinant Human
TGF-β1 (HEK293
derived)
100-21 Peprotech, USA
Trypsin-EDTA BE17-161E Lonza, Switzerland
Trypsin-EDTA 25200056 Gibco, USA
RPMI 1640 BE12-167F Lonza, Switzerland)
Sorafenib S7397-200MG Selleckchem, USA
2.1.4. Buffers
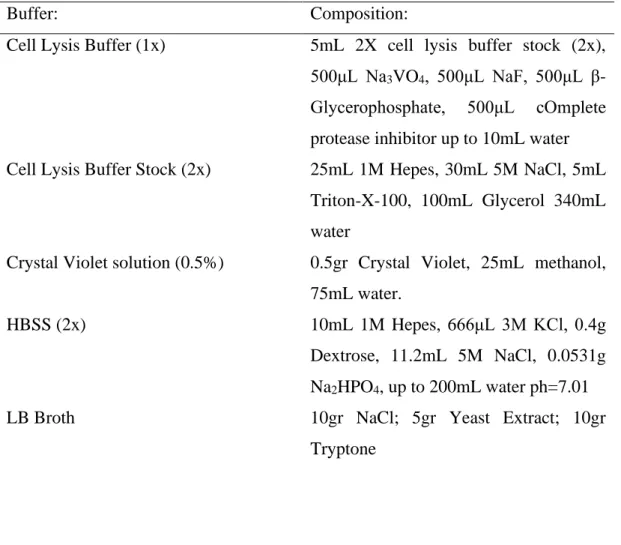
Buffers used in this study and their composition have been listed on Table 2.4. Table 2.4. Buffers and their compositions.
Buffer: Composition:
Cell Lysis Buffer (1x) 5mL 2X cell lysis buffer stock (2x), 500μL Na3VO4, 500μL NaF, 500μL β-Glycerophosphate, 500μL cOmplete protease inhibitor up to 10mL water
Cell Lysis Buffer Stock (2x) 25mL 1M Hepes, 30mL 5M NaCl, 5mL
Triton-X-100, 100mL Glycerol 340mL water
Crystal Violet solution (0.5%) 0.5gr Crystal Violet, 25mL methanol, 75mL water.
HBSS (2x) 10mL 1M Hepes, 666μL 3M KCl, 0.4g
Dextrose, 11.2mL 5M NaCl, 0.0531g Na2HPO4, up to 200mL water ph=7.01
LB Broth 10gr NaCl; 5gr Yeast Extract; 10gr
20 Table 2.4. Buffers and their compositions.
Buffer: Composition:
LB Agar 10gr NaCl; 5gr Yeast Extract; 10gr
Tryptone; 15gr Bacto agar
Mild Stripping Buffer 3g Glycine, 0.2g SDS, 20mL Tween, up
to 200mL water, pH= 2.2
PBS (1x) 1.702g Na2HPO4, 8g NaCl, 0.2g KCl,
0.2g KH2PO4, up to 1L water
Protein Loading Dye (2x) 6.25ml 1M Tris-HCl pH:6.8; 25ml 10%
SDS; 10ml β-Mercaptoethanol; 20ml glycerol; 0.008% Bromophenol blue Protein Loading Dye (4x) 12.5ml 1M Tris-HCl pH:6.8; 5gr SDS;
5ml β-Mercaptoethanol; 10ml glycerol; 0.004% Bromophenol blue
Running Buffer (10x) 144g Glycine, 10 gr SDS, 30.2g
Tris-Base, up to 1L water
Separating Gel (7%) 1.4mL Bis-Acrylamide, 3.1mL water,
0.75mL Glycerol, 1.875mL 1.5M Tris pH=8.8, 187.5μL 0.25M EDTA, 150μL 10% SDS, 62.5μL 10% APS, 7.5μL TEMED
Stacking Gel 0.3mL Bis-Acrylamide, 1.75mL water
312.5μL 1M Tris pH=6.8, 62.5μL 0.25M EDTA, 50μL 10%SDS 30μL 10% APS, 5μL TEMED
TBS-T (10x) 24.2g Tris-Base, 80g NaCl set pH=7.6
20mL Tween, up to 1L water
Transfer Buffer (10x) 144g Glycine, 30.2g Tris-Base, up to 1L
water
2.1.5. Antibodies
21 Table 2.5. Antibodies used in this study.
Product name: Catalog No: Company, Country
Actin Antibody (C-2) sc-8432 Santa Cruz
Biotechnology, USA Anti-alpha smooth muscle
Actin ab5694 Abcam, UK Anti-mouse IgG, HRP-linked Antibody 7076 Cell Signaling Technology, USA Anti-rabbit IgG, HRP-linked Antibody 7074 Cell Signaling Technology, USA
Akt Antibody 9272 Cell Signaling
Technology, USA c-Myc (D84C12) Rabbit mAb 5605 Cell Signaling Technology, USA E-cadherin Antibody (G-10) sc-8426 Santa Cruz Biotechnology, USA
ERK 1 Antibody (G-8) sc-271269 Santa Cruz
Biotechnology, USA
GAPDH Antibody (0411) sc-47724 Santa Cruz
Biotechnology, USA IKKε (D20G4) Rabbit
mAb
2905 Cell Signaling
Technology, USA
Integrin α5 Antibody 4705 Cell Signaling
Technology, USA Monoclonal Anti-α-Tubulin antibody produced in mouse T5168 Sigma-Aldrich, USA N-Cadherin (13A9) Mouse mAb 14215 Cell Signaling Technology, USA PCNA (PC10) Mouse mAb 2586 Cell Signaling Technology, USA Phospho-Akt (Ser473)
(D9E) XP® Rabbit mAb
4060 Cell Signaling
22 Table 2.5. Antibodies used in this study.
Product name: Catalog No: Company, Country
Phospho-IKKε (Ser172) (D1B7) Rabbit mAb 8766 Cell Signaling Technology, USA Phospho-p44/42 MAPK (Erk1/2) (Thr202/Tyr204) (D13.14.4E) XP® Rabbit mAb 4370S Cell Signaling Technology, USA Phospho-SAPK/JNK (Thr183/Tyr185) (G9) Mouse mAb 9255S Cell Signaling Technology, USA Phospho-TBK1/NAK (Ser172) (D52C2) XP® Rabbit mAb 5483 Cell Signaling Technology, USA
TANK Antibody (D-2) sc-166643 Santa Cruz
Biotechnology, USA
TBK1/NAK Antibody 30133 Cell Signaling
Technology, USA Twist Antibody (Twist2C1a) sc-81417 Santa Cruz Biotechnology, USA Vimentin (D21H3) XP® Rabbit mAb 5741S Cell Signaling Technology, USA YAP/TAZ (D24E4) Rabbit mAb 8418 Cell Signaling Technology, USA
ZEB1 Antibody (H-102) sc-25388 Santa Cruz
Biotechnology, USA ZO-1 (D6L1E) Rabbit
mAb
13663S Cell Signaling
Technology, USA
2.1.6. Primers
23 Table 2.6. Primers used in this study.
Primer: Sequence: CDH1 F CCCGGGACAACGTTTATTAC CDH1 R GCTGGCTCAAGTCAAAGTCC CDH2 F ACAGTGGCCACCTACAAAGG CDH2 R CCGAGATGGGGTTGATAATG CLAUDIN7 F CCACTCGAGCCCTAATGGTG CLAUDIN7 R GGTACCCAGCCTTGCTCTCA EPCAM F CGCAGCTCAGGAAGAATGTG EPCAM R TGAAGTACACTGGCATTGACG FN F CTGGCCGAAAATACATTGTAAA FN R CCACAGTCGGGTCAGGAG GAPDH F GCCCAATACGACCAAATCC GAPDH R AGCCACATCGCTCAGACAC IKBKE 1 F TGCGTGCAGAAGTATCAAGC IKBKE 1 R TACAGGCAGCCACAGAACAG IKBKE 2 F CTGCATCCCGACATGTATGA IKBKE 2 R CCGGTACATGATCTCCTTGTT IKBKE 3 F GAGCATCTACAAGCTGACAGAC IKBKE 3 R CAATGCTCCAGAGATCCACAG KRT18 F TGATGACACCAATATCACACGA KRT18 R GGCTTGTAGGCCTTTTACTTCC KRT19 F CTTCCGAACCAAGTTTGAGAC KRT19 R GAATCCACCTCCACACTGAC MMP9 F GAACCAATCTCACCGACAGG MMP9 R GCCACCCGAGTGTAACCATA SNAI2 F TGGTTGCTTCAAGGACACAT SNAI2 R GTTGCAGTGAGGGCAAGAA TANK 1 F CAAAGCCCTCAAATCTCGTAAAC TANK 1 R GTCCAGAAGTGGGAAGCTATTT TANK 2 F CAGCTGTCACTTCAACAGACTA TANK 2 R GCAGAGGAACACAGCCATAA TBK1 1 F GTGGTGGGTGGAATGAATCAT
24 Table 2.6. Primers used in this study.
Primer: Sequence: TBK1 1 R ATCACGGTGCACTATACCATTCTC TBK1 2 F CAACCTGGAAGCGGCAGAGTTA TBK1 2 R ACCTGGAGATAATCTGCTGTCGA TBK1 3 F GAAGGGCCTCGTAGGAATAAAG TBK1 3 R CCCGAGAAAGACTGCAAGAA VIMENTIN F GGTGGACCAGCTAACCAACGA VIMENTIN R TCAAGGTCAAGACGTGCCAGA ZEB1 F GGGAGGAGCAGTGAAAGAGA ZEB1 R TTTCTTGCCCTTCCTTTCTG ZEB2 F AAGCCAGGGACAGATCAGC ZEB2 R CCACACTCTGTGCATTTGAACT ZO-1 F CAGAGCCTTCTGATCATTCCA ZO-1 R CATCTCTACTCCGGAGACTGC 2.2. Methods
2.2.1. Cell lines, cell culture and reagents
Cell line used in this study is HepG2, kindly received from Prof. Florian Greten. Mycoplasma testing is conducted to ensure cells are not contaminated and analysis on their morphology and proliferation where performed before conducting experiments.
2.2.2. Cryopreservation
Cells intended to be stored or stocked for long time periods are cryopreserved. 10% DMSO is used as cryoprotectant agent in the freezing medium (100% FBS). Once cells are carefully collected and centrifuged (1000rpm, 5 minutes at RT), supernatant is removed and the pellet of the cells is resuspended in the freezing medium with a maximum cell density of 1million cells/mL. 1-2mL of cell suspension is added on the cryovials. Cryovials of cells are placed into the Mr. Frosty Cell Freezing Container and placed directly at -80ºC. Cells are kept at -80ºC for short-term storage and at N2 liquid for long-term storage.
25
The frozen cryovials are wormed rapidly in a water bath set at 37ºC. Just before they completely thaw, the cryovials are sterilized, opened and full growth medium is slowly added to completely thaw the cells. Depending on the cell status and fragility, centrifugation (1000rpm, 5 minutes at RT), is or is not performed in order to wash the cells of the DMSO. Lastly the cells are plated into appropriate dish in their full growth medium.
2.2.4. Cell maintenance and propagation
HepG2 cells are maintained in RPMI growth medium (Lonza) supplemented with 10% Fetal Bovine Serum (FBS) and 1% Penicillin/Streptomycin. Growth medium is changed regularly every 2-3 days and cells are passaged when they reach 80-90% confluency with a subcultivation ratio of maximum ¼. Cells are incubated at 37 ºC, 5% CO2 and humid cell incubators.
2.2.5. Lentiviral shRNA/CRISPR-Cas9 transfection/ transduction
HEK293T are used as lentiviral producer cell line. They are cultured in DMEM High Glucose (Lonza) supplemented with 8% FBS. At 70% confluency in a 6cm dish, calcium chloride transfection is used to transfect them with plasmids containing the shRNA/CRISPR-cas9 targeting the gene of interest (Table 2.8.) and packaging plasmids that generate the lentiviral particles. The amounts of the components for calcium phosphate transfection can be found on Table 2.7. The DNA and CaCl2 are prepared as a separate mixture. 2xHBSS is then added dropwise while the CaCL2-DNA mixture is being vortexed at room temperature. After a 15-minute incubation period the mixture is added on top of HEK293T cells. 16 hours post transfection the medium of HEK293T cells is changed. 72 hours post transfection the HEK293T medium containing the viral particles is collected, filtered through 0.2μm filters (Sartorius AG) and added on top of the recipient cells, HepG2, seeded one day prior to reach 30% confluency. Polybrene at a concentration of 10μg/mL is used to improve transduction efficiency. The medium containing lentiviral particles is left on HepG2 cells for two days then removed. To select the efficiently transduced HepG2 cells, 7μg/mL Puromycin is used throughout all the time the cells are kept in culture. CRISPR/Cas9 HepG2 cells are polyclonal. Single colony selection is not performed before experimentation.
26
Table 2.7. Components for calcium phosphate transfection and their amounts.
Component: Amount:
shRNA / CRISPR/cas9 plasmids 9μg
Packaging plasmid 1: VSVG 3μg
Packaging plasmid 2: R891 6μg
CaCl2 (2M) 38μL
HBSS (2x) 300μL
ddH2O Up to 600μL
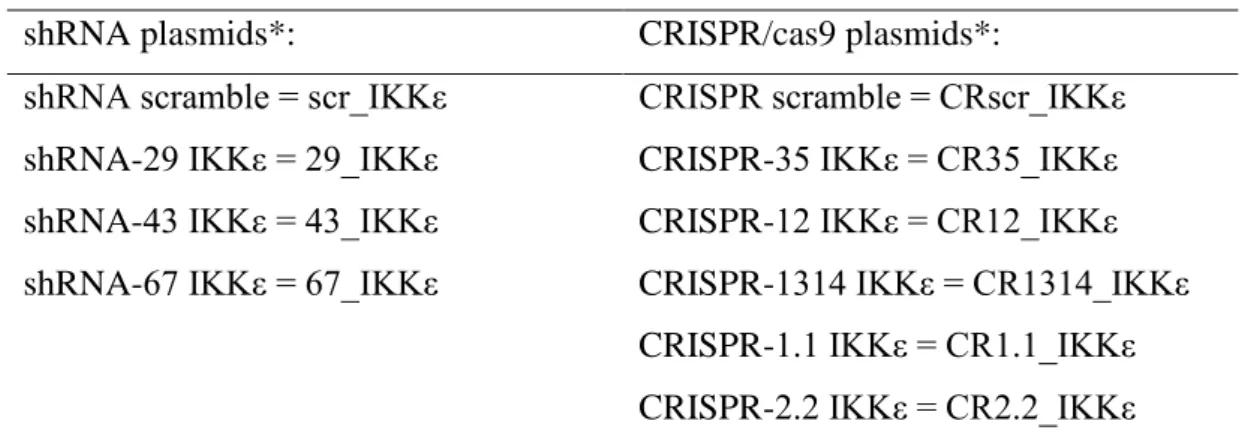
Table 2.8. List of plasmids used in lentiviral transfection.
shRNA plasmids*: CRISPR/cas9 plasmids*:
shRNA scramble = scr_IKKε CRISPR scramble = CRscr_IKKε
shRNA-29 IKKε = 29_IKKε CRISPR-35 IKKε = CR35_IKKε
shRNA-43 IKKε = 43_IKKε CRISPR-12 IKKε = CR12_IKKε
shRNA-67 IKKε = 67_IKKε CRISPR-1314 IKKε = CR1314_IKKε
CRISPR-1.1 IKKε = CR1.1_IKKε CRISPR-2.2 IKKε = CR2.2_IKKε *Numbering on the plasmids is random.
2.2.6. IKKε overexpression
HepG2 cells are seeded to reach 60% confluency in 3cm dishes the following day. 2μg of empty plasmid (pcDNA), IKKε-Myc overexpressing plasmid or IKKε(KD)-Myc overexpressing plasmid are transiently transfected using Lipofectamine transfection reagent according to the manufacturer protocol. 24h post transfection, the transfected cells are seeded for further analysis or RNA and protein samples are taken.
2.2.7. CellTiter-Glo Luminescent cell viability assay
For end-point cell viability analysis, CellTiter-Glo Luminescent cell viability assay (Promega) was used. The CellTiter-Glo Luminescent cell viability assay quantifies the viable, metabolic cells through detection of ATP present in them. Cells are seeded in 96-well plate formats. Cells are treated and viability upon treatment is assessed following the protocol provided by the kit. The luminescence reading is performed in opaque-walled 96-well plates using Synergy HT Microplate reader.
27 2.2.8. Cell Proliferation Reagent WST-1
For cell proliferation analysis of cells seeded in polyHEMA coated plates, Cell Proliferation Reagent 1 (Roche) was used. The Cell Proliferation Reagent WST-1 is based on the activity of cellular mitochondrial dehydrogenase to cleave tetrazolium salt to formazan dye which is directly proportional to the number of alive cells. Cells are seeded in 96-well plate formats and the manufacture’s protocol is followed. Formazan dye can be detected by measuring absorbance at 440nm using Synergy HT Microplate reader.
2.2.9. Real Time Cell Analysis (RTCA) - Proliferation
RTCA is a novel technique used to analyse cell proliferation in real time using xCELLigence® Real-Time Cell Analyzer instrument (ACEA Biosciences, San Diego, CA, USA). HepG2 cells are seeded at a density of 8000 cells/well into the wells of E-plate according to manufacturer’s protocol and cell proliferation was monitored for 48 hours. Data are normalized to the first possible time point to assure cell seeding differences do not affect the final proliferation results.
2.2.10. Colony Formation Assay
HepG2 cells were seeded at a density of 2000 cells/well in 12-well plate format. Cells medium was changed regularly and colony formation was observed. When colonies reached a density of more than 50 cells/colony, cells were fixed with 100% methanol for 10 minutes at -20ºC and stained with 0.5% Crystal violet for 20 minutes at RT. The wells were scanned or pictures were taken and colonies were counted using Colony counter (settings: threshold: 100, minimum: 20, Gray width:50).
2.2.11. Anchorage independent growth assay
2 weeks prior to cell seeding, 96-well plates are double coated with 35uL of polyHEMA (10mg/mL in 95% EtOH) and the plates were incubated in a non-humid incubator at 37 ºC till ethanol fully evaporated and coating is formed. Final amount of polyHEMA on the surface of the dish is 0.7mg. HepG2 cells are seeded at a cell density of 3000 cells/well. Daily images of the wells were taken using inverted microscope and cell proliferation was measures using WST-1 assay.
28
2.2.12. Cell cycle analysis through Propidium Iodide staining.
HepG2 cells are seeded in 3cm dish to reach 70% confluency next day. 24h after seeding, cells are trypsinized, collected and kept on ice at all time. Following washing with cold 1xPBS, cells are fixed using ice-cold 70% freshly prepared ethanol. Ethanol is added dropwise on top of the pellet of cells while vertexing then cells are incubated in ice for 20 minutes. Ethanol is washed away using 1xPBS. Cells are pelleted and washed twice with 1xPBS. To ensure specific binding of the PI only to DNA, cells are incubated for 15 minutes at 37ºC with 50μL of 100μg/mL Ribonuclease A(Sigma-Aldrich). 200μL of 50μg/mL PI (Sigma-Aldrich) is added on top (final volume=250 μL). BD Accuri™ C6 Cytometer and NovoExpresss cell cycle analysis module are used to analyse the cells for cell cycle distribution.
2.2.13. Wound healing assay
HepG2 cells are seeded in 12 or 24 well plate formats to reach 100% confluency next day. 24 hours after seeding and at 100% confluency wound was introduced using 200uL tip. Wound healing is observed for 72h and images are taken to document it. The gap area was measured using ImageJ MRI Wound_Healing_Tool.
2.2.14. Western Blotting
Total protein is isolated using cell lysis buffer. Protein concentration is determined using BCA Protein Assay Reagent Kit (Thermo Scientific, Rockford, IL) according to the manufacturer’s instructions. Absorbance readings are performed using Synergy HT microplate reader at 562nm. Protein lysate is mixed with 2x or 4x loading dye and denatured at 75ºC for 10 minutes. SDS-PAGE is used to separate the protein samples. Equal amounts of protein are loaded from each sample into each lane of SDS-PAGE. Proteins are transferred to PVDF-membranes through wet transfer. Blocking of the membranes is performed at RT for 30minutes using 10% milk solution in TBS-T 1x. Washing of the membranes is done using TBS-T 1x. Following blocking and washing, membranes are incubated in primary antibodies then secondary antibodies linked to HRP enzyme. Pierce ECL western blotting substrate (Thermo Fisher Scientific, USA) is used to develop the membranes in AmershamTM Imager 600 (Cytiva, UK).
29 2.2.15. Real-Time PCR
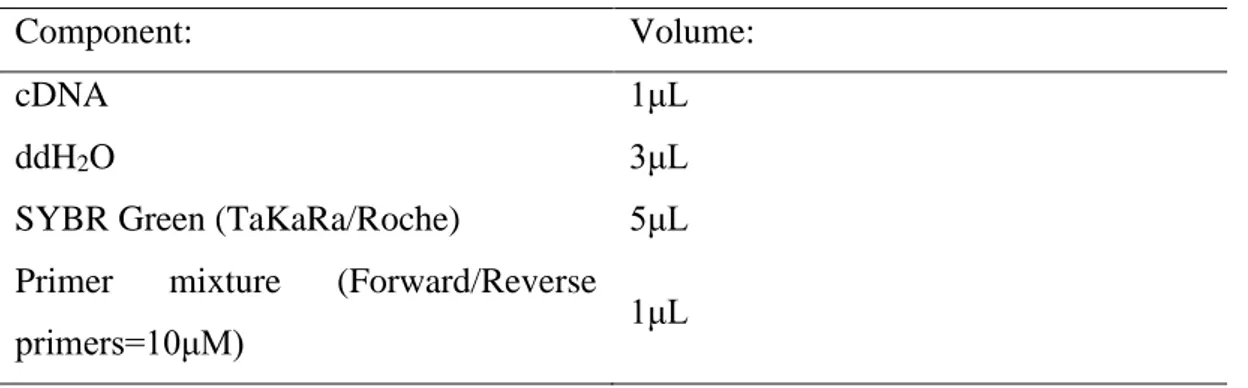
Total RNA was isolated using E.Z.N.A. Total RNA Kit I (Omega Bio-Tek, USA) according to manufacturer’s instructions. The concentration of RNA was measured using NanoDrop™ One/OneC Microvolume UV-Vis Spectrophotometer (ThermoFisher Scientific). iScript cDNA Synthesis Kit (Bio-Rad, USA) is used to synthesise 1μg of RNA into cDNA following manufacturer’s instructions in Techne thermal cycler. Synthesized cDNA is diluted 1:4 in ddH2O. RT-PCR mixture is prepared as explained in the Table 2.9. and run in Light Cycler® 480 II (Roche). The reaction conditions are set as explained in TaKaRa or Roche SYBR Green manuals.
Table 2.9. Components in RT-PCR mixture.
Component: Volume:
cDNA 1μL
ddH2O 3μL
SYBR Green (TaKaRa/Roche) 5μL
Primer mixture (Forward/Reverse
30
CHAPTER 3
Results
3.1. HepG2 cell proliferation negatively correlates to IKKε expression.
Our group previously reported that proliferation of Hep3B cells, another HCC cell line, increases upon IKKε depletion [71]. In the same way, our studies with IKKε-depleted HepG2 cells has yielded similar results. In Figure 3.1 A and B, viability of IKKε-depleted HepG2 cells was analysed. IKKε-IKKε-depleted HepG2 cells via lentiviral shRNA (Figure 3.1 A) or CRISPR/Cas9 IKKε (Figure 3.1 B) were both observed to proliferate more when compared to corresponding control cells as measured by Cell-Titer Glo luminescent cell viability -assay. Moreover, proliferative ability of lentiviral shRNA IKKε-depleted HepG2 cells was analysed using RTCA where IKKε-depleted cells proliferate significantly more than control cells (Figure 3.1 C). Additionally, colony formation ability increases in shRNA IKKε-depleted HepG2 cells (Figure 3.1 D) and cell population in S-phase, is increased in CRISPR/Cas9 IKKε-depleted HepG2 cells (Figure 3.1 E). The opposite is observed in IKKε overexpressing HepG2 cells were the population of the cells in S phase decrease by 5% (Figure 3.1 F) Despite the increase in proliferation, phosphor-AKT levels decrease in IKKε-depleted cells and are upregulated upon IKKε overexpression in HepG2 cells (Figure 3.1 G).
3.2. HepG2 cells show more anchorage independence growth upon IKKε depletion.
To assess the effect of IKKε on anchorage independent growth, control or IKKε -depleted HepG2 cells were seeded on the polyHEMA coated 96 well plates. Images are taken at day 3, 5 and 7 post-seeding and show a difference in the growth pattern of IKKε depleted cells compared to control cells (Figure 3.2. A). To quantify anchorage independent growth, stainings at day 1, 3, 5 and 7 was performed with WST-1 reagent. (Figure 3.2 B and C). Anchorage independent growth of HepG2 cells improves upon IKKε depletion. In shRNA IKKε depleted HepG2 cells we can also see a trend but it
31
Figure 3.1: HepG2 cell proliferation negatively correlates to IKKε expression. Cell viability in HepG2 cells, in which IKKε is depleted via A) shRNA or B) CRISPR/Cas9, is measured using Cell-Titer Glo Luminescent cell viability assay for 5 consecutive days. Data shown are mean ± SD of triplicate wells representative of two independent experiments; multiple t-test using Holm-Sidak method; ns not significant, * p<0.05, ** p<0.01, *** p<0.001, **** p<0.0001. C) Cell growth in control or shRNA IKKε-depleted HepG2 cells were analysed via Real Time Cell Analysis (RTCA). Data shown are mean ± SD of duplicate wells representative of one experiment; linear regression, differences in slope ns not significant, * p<0.05, ** p<0.01, *** p<0.001, ****
32
p<0.0001 D) Colony formation assay on shRNA IKKε-depleted HepG2 cells. Quantification on the right. E-F) Cell cycle distribution of control and CRISPR/Cas9 IKKε-depleted HepG2 cells or IKKε overexpressing HepG2 cells is analysed through PI staining. Data are representative of one experiment of 100.000 Cells/condition. G) Western blot image showing AKT phosphorylation level in shRNA, CRISPR/Cas9 depleted HepG2 cells and IKKε-overexpressing HepG2 cells.
is not significant (Figure 3.2. B) but in CRISPR/Cas9 IKKε depleted HepG2 cells this increase in anchorage independent growth is significant. Additionally, integrin αV, a very important integrin regulating anchorage-independent potential of the cells [60], appears to be downregulated upon CRISPR/Cas9 IKKε depletion in HepG2 cells (Figure 3.2 D).
Figure 3.2: HepG2 cells show more anchorage independence upon IKKε depletion. A) Bright-field microscopy images of control and IKKε-depleted HepG2 cells growing on
poly-33
HEMA coated 96 well plates. B-C) Anchorage independent growth of IKKε deficient HepG2 cells were quantified by WST-1 staining at day 1, 3, 5 and 7. Data shown are relative to each construct’s day 1 value. D) Western blot analysis of protein markers in CRISPR/Cas9 IKKε deficient HepG2 cells. Data shown are mean ± SD of duplicate wells representative of two independent experiments; multiple t-test using Holm-Sidak method; ns not significant, * p<0.05, ** p<0.01, *** p<0.001, **** p<0.0001. Scale bar = 300μm
3.3. EMT status of HepG2 cells shifts upon depletion or ectopic expression of IKKε.
To evaluate whether IKKε plays a role in EMT in HepG2 cells, IKKε-depleted HepG2 cells by both shRNA and CRISPR/Cas9 methods were analysed for expression levels
Figure 3.3: EMT status of HepG2 cells is altered upon IKKε depletion. A-B) qPCR analysis of EMT markers in IKKε depleted HepG2 cells. C-D) Western blot analysis of E-cadherin and

![Figure 1.3: BCLC staging system for HCC patients. Reproduced with permission from Springer Nature [3]](https://thumb-eu.123doks.com/thumbv2/9libnet/5660241.113057/19.892.178.781.377.779/figure-bclc-staging-patients-reproduced-permission-springer-nature.webp)