Climate Change
and water
Intergovernmental Panel on Climate Change
C
l
im
a
t
e
C
h
a
n
g
e
a
n
d
w
a
t
e
r
iPCC technical Paper Vi
O
are vulnerable and have the potential to be strongly impacted by climate change, with wide-rangingconsequences for human societies and ecosystems.
The Intergovernmental Panel on Climate Change (IPCC) Technical Paper Climate Change and Water draws together and evaluates the information in IPCC Assessment and Special Reports concerning the impacts of climate change on hydrological processes and regimes, and on freshwater resources – their availability, quality, use and management. It takes into account current and projected regional key vulnerabilities, prospects for adaptation, and the relationships between climate change mitigation and water. Its objectives are:
• To improve understanding of the links between both natural and anthropogenically induced climate change, its impacts, and adaptation and mitigation response options, on the one hand, and water-related issues, on the other;
• To communicate this improved understanding to policymakers and stakeholders.
Text in the Technical Paper carefully follows the text of the underlying IPCC Reports, especially the Fourth Assessment. It reflects the balance and objectivity of those Reports and, where the text differs, this is with the purpose of supporting and/or explaining further the conclusions of those Reports. Every substantive paragraph is sourced back to an IPCC Report.
The Intergovernmental Panel on Climate Change (IPCC) was set up jointly by the World Meteorological Organization and the United Nations Environment Programme to provide an authoritative international assessment of scientific information on climate change. Climate Change and Water is one of six Technical Papers prepared by the IPCC to date. It was prepared in response to a request from the World Climate Programme – Water and the International Steering Committee of the Dialogue on Water and Climate.
WMO UNEP
Climate Change and Water
Shaohong Wu
Chinese Academy of Sciences
China
Bryson Bates
CSIRO
Australia
Zbigniew W. Kundzewicz
Polish Academy of Sciences, Poland
and Potsdam Institute for Climate
Impact Research, Germany
Jean Palutikof
Met Office Hadley Centre
United Kingdom
This is a Technical Paper of the Intergovernmental Panel on Climate Change prepared in response to a decision of the Panel. The material herein has undergone expert and government review, but has not been considered by the Panel for possible acceptance or approval.
Edited by
June 2008
This paper was prepared under the management of the IPCC Working Group II Technical Support Unit
Bates, B.C., Z.W. Kundzewicz, S. Wu and J.P. Palutikof, Eds., 2008: Climate Change and Water. Technical
Paper of the Intergovernmental Panel on Climate Change, IPCC Secretariat, Geneva, 210 pp.
© 2008, Intergovernmental Panel on Climate Change
ISBN: 978-92-9169-123-4
Preface
vii
Acknowledgments viii
Executive Summary 1
1. Introduction to climate change and water 5
1.1 Background 7
1.2 Scope 7
1.3 The context of the Technical Paper: socio-economic and environmental conditions 8
1.3.1 Observed changes 8
1.3.2 Projected changes 9
1.4 Outline 11
2. Observed and projected changes in climate as they relate to water 13
2.1 Observed changes in climate as they relate to water 15
2.1.1 Precipitation (including extremes) and water vapour 15
2.1.2 Snow and land ice 19
2.1.3 Sea level 20
2.1.4 Evapotranspiration 20
2.1.5 Soil moisture 21
2.1.6 Runoff and river discharge 21
2.1.7 Patterns of large-scale variability 22
2.2 Influences and feedbacks of hydrological changes on climate 23
2.2.1 Land surface effects 23
2.2.2 Feedbacks through changes in ocean circulation 24
2.2.3 Emissions and sinks affected by hydrological processes or biogeochemical feedbacks 24
2.3 Projected changes in climate as they relate to water 24
2.3.1 Precipitation (including extremes) and water vapour 25
2.3.2 Snow and land ice 27
2.3.3 Sea level 28
2.3.4 Evapotranspiration 29
2.3.5 Soil moisture 29
2.3.6 Runoff and river discharge 29
2.3.7 Patterns of large-scale variability 31
3. Linking climate change and water resources: impacts and responses 33
3.1 Observed climate change impacts 35
3.1.1 Observed effects due to changes in the cryosphere 35
3.1.2 Hydrology and water resources 35
3.2 Future changes in water availability and demand due to climate change 38
3.2.1 Climate-related drivers of freshwater systems in the future 38
3.2.5 Impacts of climate change on water stress in the future 45 3.2.6 Impacts of climate change on costs and other socio-economic aspects of freshwater 45 3.2.7 Freshwater areas and sectors highly vulnerable to climate change 47 3.2.8 Uncertainties in the projected impacts of climate change on freshwater systems 47
3.3 Water-related adaptation to climate change: an overview 48
4. Climate change and water resources in systems and sectors 53
4.1 Ecosystems and biodiversity 55
4.1.1 Context 55
4.1.2 Projected changes in hydrology and implications for global biodiversity 55
4.1.3 Impacts of changes in hydrology on major ecosystem types 55
4.2 Agriculture and food security, land use and forestry 59
4.2.1 Context 59
4.2.2 Observations 60
4.2.3 Projections 60
4.2.4 Adaptation, vulnerability and sustainable development 63
4.3 Human health 67
4.3.1 Context 67
4.3.2 Observations 69
4.3.3 Projections 69
4.3.4 Adaptation, vulnerability and sustainable development 69
4.4 Water supply and sanitation 69
4.4.1 Context 69
4.4.2 Observations 69
4.4.3 Projections 70
4.4.4 Adaptation, vulnerability and sustainable development 71
4.5 Settlements and infrastructure 73
4.5.1 Settlements 73
4.5.2 Infrastructure 73
4.5.3 Adaptation 74
4.6 Economy: insurance, tourism, industry, transportation 74
4.6.1 Context 74
4.6.2 Socio-economic costs, mitigation, adaptation, vulnerability, sustainable development 75
5. Analysing regional aspects of climate change and water resources 77
5.1 Africa 79
5.1.1 Context 79
5.1.2 Current observations 79
5.1.3 Projected changes 81
5.1.4 Adaptation and vulnerability 85
5.2 Asia 85
5.2.1 Context 85
5.2.2 Observed impacts of climate change on water 85
5.2.3 Projected impact of climate change on water and key vulnerabilities 87
5.2.4 Adaptation and vulnerability 88
5.3 Australia and New Zealand 90
5.3.4 Adaptation and vulnerability 92
5.4 Europe 93
5.4.1 Context 93
5.4.2 Observed changes 93
5.4.3 Projected changes 93
5.4.4 Adaptation and vulnerability 95
5.5 Latin America 96
5.5.1 Context 96
5.5.2 Observed changes 96
5.5.3 Projected changes 98
5.5.4 Adaptation and vulnerability 100
5.6 North America 102
5.6.1 Context and observed changes 102
5.6.2 Projected change and consequences 102
5.6.3 Adaptation 104
5.7 Polar regions 106
5.7.1 Context 106
5.7.2 Observed changes 107
5.7.3 Projected changes 108
5.7.4 Adaptation and vulnerability 109
5.8 Small islands 109
5.8.1 Context 109
5.8.2 Observed climatic trends and projections in island regions 109
5.8.3 Adaptation, vulnerability and sustainability 111
6. Climate change mitigation measures and water 115
6.1 Introduction 117
6.2 Sector-specific mitigation 117
6.2.1 Carbon dioxide capture and storage (CCS) 117
6.2.2 Bio-energy crops 117
6.2.3 Biomass electricity 119
6.2.4 Hydropower 119
6.2.5 Geothermal energy 119
6.2.6 Energy use in buildings 119
6.2.7 Land-use change and management 119
6.2.8 Cropland management (water) 120
6.2.9 Cropland management (reduced tillage) 120
6.2.10 Afforestation or reforestation 120
6.2.11 Avoided/reduced deforestation 121
6.2.12 Solid waste management; wastewater treatment 121
6.2.13 Unconventional oil 122
6.3 Effects of water management policies and measures on GHG emissions and mitigation 122
6.3.1 Hydro dams 122
6.3.2 Irrigation 122
6.3.3 Residue return 122
6.3.7 Geothermal energy 124
6.4 Potential water resource conflicts between adaptation and mitigation 124
7. Implications for policy and sustainable development 125
7.1 Implication for policy by sector 127
7.2 The main water-related projected impacts by regions 128
7.3 Implications for climate mitigation policy 130
7.4 Implications for sustainable development 130
8. Gaps in knowledge and suggestions for further work 133
8.1 Observational needs 135
8.2 Understanding climate projections and their impacts 135
8.2.1 Understanding and projecting climate change 135
8.2.2 Water-related impacts 136
8.3 Adaptation and mitigation 136
References 139
Appendix I: Climate model descriptions 165
Appendix II: Glossary 167
Appendix III: Acronyms, chemical symbols, scientific units 183
Appendix IV: List of Authors 185
Appendix V: List of Reviewers 187
Appendix VI: Permissions to publish 191
The Intergovernmental Panel on Climate Change (IPCC) Technical Paper on Climate Change and Water is the sixth paper in the IPCC Technical Paper series and was produced in response to a proposal by the Secretariat of the World Climate Programme – Water (WCP-Water) and the International Steering Committee of the Dialogue on Water and Climate at the 19th Plenary Session of the IPCC which took place in Geneva in April 2002. A consultative meeting on Climate Change and Water was held in Geneva in November 2002 and recommended the preparation of a Technical Paper on Climate Change and Water instead of preparing a Special Report to address this subject. Such a document was to be based primarily on the findings of the Fourth Assessment Report of the IPCC, but also earlier IPCC publications. The Panel also decided that water should be treated as cross cutting theme in the Fourth Assessment Report.
The Technical Paper addresses the issue of freshwater. Sea-level rise is dealt with only insofar as it can lead to impacts on freshwater in coastal areas and beyond. Climate, freshwater, biophysical and socio-economic systems are interconnected in complex ways. Hence, a change in any one of these can induce a change in any other. Freshwater-related issues are critical in determining key regional and sectoral vulnerabilities. Therefore, the relationship between climate change and freshwater resources is of primary concern to human society and also has implications for all living species.
An interdisciplinary writing team of Lead Authors was selected by the three IPCC Working Group Bureaus with the aim of achieving a regional and topical balance. Like all IPCC Technical Papers, this product too is based on the material of previously approved/accepted/adopted IPCC reports and underwent a simultaneous expert and Government review, followed by a final Government review. The Bureau of the IPCC acted in the capacity of an editorial board to ensure that the review comments were adequately addressed by the Lead Authors in the finalisation of the Technical Paper.
The Bureau met in its 37th Session in Budapest in April 2008 and considered the major comments received during the final Government review. In the light of its observations and requests, the Lead Authors finalised the Technical Paper, after which the Bureau authorised its release to the public.
We owe a large debt of gratitude to the Lead Authors (listed in the Paper) who gave of their time very generously and who completed the Technical Paper according to schedule. We would like to thank Dr. Jean Palutikof, Head of the Technical Support Unit of IPCC Working Group II, for her skilful leadership through the production of this Paper.
Rajendra K. Pachauri
Chairman of the IPCC
Renate Christ
Secretary of the IPCC
Martin Parry
Co-Chair IPCC Working Group II
Osvaldo Canziani
We thank the Working Group II Technical Support Unit, especially Norah Pritchard and Clair Hanson, for their hard work in the preparation of this Technical Paper.
The Government of Canada kindly agreed to host the second Lead Author meeting, and we thank Terry Prowse for undertaking the hard work of organisation in Victoria, British Columbia.
Maurice Roos, from the State of California Department of Water Resources, and Bill Girling, from Manitoba Hydro, attended the second Lead Author meeting to provide advice and suggestions from a user perspective.
Marilyn Anderson prepared the Index and Nancy Boston copy edited the text.
Thanks go to all the authors, their families, institutions and governments, for making this paper possible.
Bryson Bates 23 June 2008
Zbyszek Kundzewicz Shaohong Wu Jean Palutikof
Coordinating Lead Authors
Bryson Bates (Australia), Zbigniew W. Kundzewicz (Poland) and Shaohong Wu (China)
Lead Authors
Nigel Arnell (UK), Virginia Burkett (USA), Petra Döll (Germany), Daniel Gwary (Nigeria), Clair Hanson
(UK), BertJan Heij (The Netherlands), Blanca Elena Jiménez (Mexico), Georg Kaser (Austria), Akio Kitoh
(Japan), Sari Kovats (UK), Pushpam Kumar (UK), Christopher H.D. Magadza (Zimbabwe), Daniel Martino
(Uruguay), Luis José Mata (Germany/Venezuela), Mahmoud Medany (Egypt), Kathleen Miller (USA), Taikan
Oki (Japan), Balgis Osman (Sudan), Jean Palutikof (UK), Terry Prowse (Canada), Roger Pulwarty (USA/
Trinidad and Tobago), Jouni Räisänen (Finland), James Renwick (New Zealand), Francesco Nicola Tubiello
(USA/IIASA/Italy), Richard Wood (UK) and Zong-Ci Zhao (China)
Contributing Authors
Julie Arblaster (Australia), Richard Betts (UK), Aiguo Dai (USA), Christopher Milly (USA), Linda Mortsch
(Canada), Leonard Nurse (Barbados), Richard Payne (Australia), Iwona Pinskwar (Poland) and Tom Wilbanks
(USA)
Climate Change and Water
This Technical Paper was requested by IPCC Plenary in response to suggestions by the World Climate
Programme - Water, the Dialogue on Water and other organisations concerned with the provision of water.
It was prepared under the auspices of the IPCC Chair, Dr. R.K. Pachauri.
Observational records and climate projections provide abundant evidence that freshwater resources
are vulnerable and have the potential to be strongly impacted by climate change, with wide-ranging
consequences for human societies and ecosystems.
1 See Box 1.1.
2 Numbers inside square brackets relate to sections in the main body of the Technical Paper.
3 Projections considered are based on the range of non-mitigation scenarios developed by the IPCC Special Report on Emissions Scenarios
(SRES).
4 This statement excludes changes in non-climatic factors, such as irrigation.
5 These projections are based on an ensemble of climate models using the mid-range SRES A1B non-mitigation emissions scenario. Consideration
of the range of climate responses across SRES scenarios in the mid-21st century suggests that this conclusion is applicable across a wider range
Observed warming over several decades has been linked to changes in the large-scale hydrological cycle such as:
increasing atmospheric water vapour content; changing precipitation patterns, intensity and extremes; reduced snow cover and widespread melting of ice; and changes in soil moisture and runoff. Precipitation changes show substantial spatial and inter-decadal variability. Over the 20th century, precipitation has mostly increased over land in high northern latitudes, while decreases have dominated from 10°S to 30°N since the 1970s. The frequency of heavy precipitation events (or proportion of total rainfall from heavy falls) has increased over most areas (likely1). Globally, the area of land classified as very dry has more than doubled since the 1970s (likely). There have been significant decreases in water storage in mountain glaciers and Northern Hemisphere snow cover. Shifts in the amplitude and timing of runoff in glacier- and snowmelt-fed rivers, and in ice-related phenomena in rivers and lakes, have been observed (high confidence). [2.12]
Climate model simulations for the 21st century are consistent in projecting precipitation increases in high latitudes (very
likely) and parts of the tropics, and decreases in some
sub-tropical and lower mid-latitude regions (likely). Outside
these areas, the sign and magnitude of projected changes varies between models, leading to substantial uncertainty in precipitation projections.3 Thus projections of future precipitation changes are more robust for some regions than for others. Projections become less consistent between models as spatial scales decrease. [2.3.1]
By the middle of the 21st century, annual average river runoff and water availability are projected to increase as a result of climate change4 at high latitudes and in some wet tropical
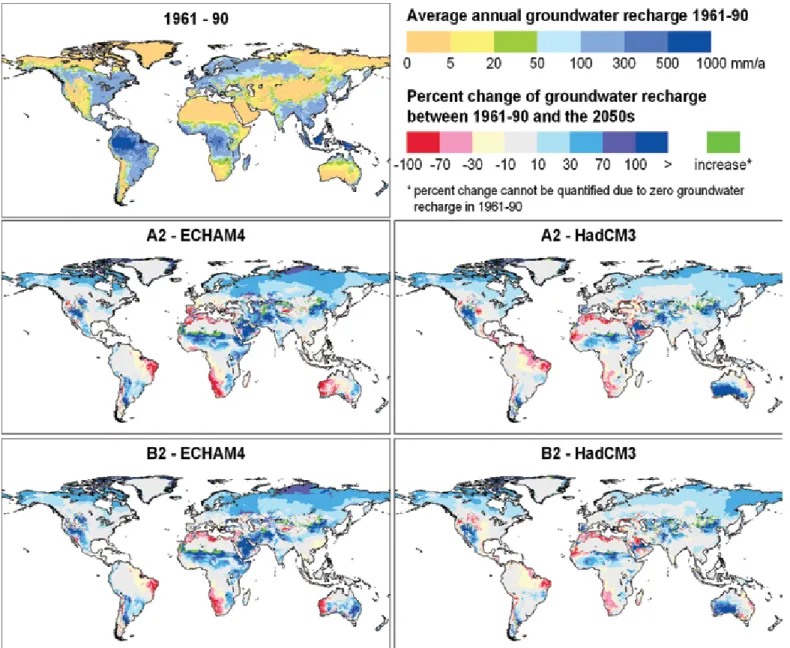
areas, and decrease over some dry regions at mid-latitudes and in the dry tropics.5 Many semi-arid and arid areas (e.g., the Mediterranean Basin, western USA, southern Africa and north-eastern Brazil) are particularly exposed to the impacts of climate change and are projected to suffer a decrease of water resources due to climate change (high confidence). [2.3.6]
Increased precipitation intensity and variability are projected to increase the risks of flooding and drought in many areas. The frequency of heavy precipitation events
(or proportion of total rainfall from heavy falls) will be very likely to increase over most areas during the 21st century, with
consequences for the risk of rain-generated floods. At the same time, the proportion of land surface in extreme drought at any one time is projected to increase (likely), in addition to a tendency for drying in continental interiors during summer, especially in the sub-tropics, low and mid-latitudes. [2.3.1, 3.2.1]
Water supplies stored in glaciers and snow cover are projected to decline in the course of the century, thus
reducing water availability during warm and dry periods (through a seasonal shift in streamflow, an increase in the ratio of winter to annual flows, and reductions in low flows) in regions supplied by melt water from major mountain ranges, where more than one-sixth of the world’s population currently live (high confidence). [2.1.2, 2.3.2, 2.3.6]
Higher water temperatures and changes in extremes, including floods and droughts, are projected to affect water quality and exacerbate many forms of water pollution –
from sediments, nutrients, dissolved organic carbon, pathogens, pesticides and salt, as well as thermal pollution, with possible negative impacts on ecosystems, human health, and water system reliability and operating costs (high confidence). In addition, sea-level rise is projected to extend areas of salinisation of groundwater and estuaries, resulting in a decrease of freshwater availability for humans and ecosystems in coastal areas. [3.2.1.4, 4.4.3]
Globally, the negative impacts of future climate change on freshwater systems are expected to outweigh the benefits (high confidence). By the 2050s, the area of land subject to
increasing water stress due to climate change is projected to be more than double that with decreasing water stress. Areas in which runoff is projected to decline face a clear reduction in the value of the services provided by water resources. Increased annual runoff in some areas is projected to lead to increased total water supply. However, in many regions, this benefit is likely to be counterbalanced by the negative effects of increased precipitation variability and seasonal runoff shifts in water supply, water quality and flood risks (high confidence). [3.2.5]
Changes in water quantity and quality due to climate change are expected to affect food availability, stability, access and utilisation. This is expected to lead to decreased food security and
increased vulnerability of poor rural farmers, especially in the arid and semi-arid tropics and Asian and African megadeltas. [4.2]
Climate change affects the function and operation of existing water infrastructure – including hydropower, structural flood defences, drainage and irrigation systems – as well as water management practices. Adverse effects
of climate change on freshwater systems aggravate the impacts of other stresses, such as population growth, changing economic activity, land-use change and urbanisation (very high confidence). Globally, water demand will grow in the coming decades, primarily due to population growth and increasing affluence; regionally, large changes in irrigation water demand as a result of climate change are expected (high confidence). [1.3, 4.4, 4.5, 4.6]
Current water management practices may not be robust enough to cope with the impacts of climate change on water
supply reliability, flood risk, health, agriculture, energy and aquatic ecosystems. In many locations, water management cannot satisfactorily cope even with current climate variability, so that large flood and drought damages occur. As a first step, improved incorporation of information about current climate variability into water-related management would assist adaptation to longer-term climate change impacts. Climatic and non-climatic factors, such as growth of population and damage potential, would exacerbate problems in the future (very high confidence). [3.3]
Climate change challenges the traditional assumption that past hydrological experience provides a good guide to future conditions. The consequences of climate change may
alter the reliability of current water management systems and water-related infrastructure. While quantitative projections of changes in precipitation, river flows and water levels at the river-basin scale are uncertain, it is very likely that hydrological characteristics will change in the future. Adaptation procedures and risk management practices that incorporate projected hydrological changes with related uncertainties are being developed in some countries and regions. [3.3]
Adaptation options designed to ensure water supply during average and drought conditions require integrated demand-side as well as supply-side strategies. The former
improve water-use efficiency, e.g., by recycling water. An expanded use of economic incentives, including metering and pricing, to encourage water conservation and development of water markets and implementation of virtual water trade, holds
considerable promise for water savings and the reallocation of water to highly valued uses. Supply-side strategies generally involve increases in storage capacity, abstraction from water courses, and water transfers. Integrated water resources management provides an important framework to achieve adaptation measures across socio-economic, environmental and administrative systems. To be effective, integrated approaches must occur at the appropriate scales. [3.3]
Mitigation measures can reduce the magnitude of impacts of global warming on water resources, in turn reducing adaptation needs. However, they can have considerable
negative side effects, such as increased water requirements for afforestation/reforestation activities or bio-energy crops, if projects are not sustainably located, designed and managed. On the other hand, water management policy measures, e.g., hydrodams, can influence greenhouse gas emissions. Hydrodams are a source of renewable energy. Nevertheless, they produce greenhouse gas emissions themselves. The magnitude of these emissions depends on specific circumstance and mode of operation. [Section 6]
Water resources management clearly impacts on many other policy areas, e.g., energy, health, food security and nature
conservation. Thus, the appraisal of adaptation and mitigation options needs to be conducted across multiple water-dependent sectors. Low-income countries and regions are likely to remain vulnerable over the medium term, with fewer options than high-income countries for adapting to climate change. Therefore, adaptation strategies should be designed in the context of development, environment and health policies. [Section 7]
Several gaps in knowledge exist in terms of observations and research needs related to climate change and water.
Observational data and data access are prerequisites for adaptive management, yet many observational networks are shrinking. There is a need to improve understanding and modelling of climate changes related to the hydrological cycle at scales relevant to decision making. Information about the water-related impacts of climate change is inadequate – especially with respect to water quality, aquatic ecosystems and groundwater – including their socio-economic dimensions. Finally, current tools to facilitate integrated appraisals of adaptation and mitigation options across multiple water-dependent sectors are inadequate. [Section 8]
Introduction to climate change
and water
6 ‘Scoping Paper for a possible Technical Paper on Climate Change and Water’. Available at: http://www.ipcc.ch/meetings/session21.htm.
1.1 Background
1.2 Scope
The idea of a special IPCC publication dedicated to water and climate change dates back to the 19th IPCC Session held in Geneva in April 2002, when the Secretariat of the World Climate Programme – Water and the International Steering Committee of the Dialogue on Water and Climate requested that the IPCC prepare a Special Report on Water and Climate. A consultative meeting on Climate Change and Water held in Geneva in November 2002 concluded that the development of such a report in 2005 or 2006 would have little value, as it would quickly be superseded by the Fourth Assessment Report (AR4), which was planned for completion in 2007. Instead, the meeting recommended the preparation of a Technical Paper on Climate Change and Water that would be based primarily on AR4 but would also include material from earlier IPCC publications. An interdisciplinary writing team was selected by the three IPCC Working Group Bureaux with the aim of achieving regional and topical balance, and with multiple relevant disciplines being represented. United Nations (UN) agencies, non-governmental organisations (NGOs) and representatives from relevant stakeholder communities, including the private sector, have been involved in the preparation of this Technical Paper and the associated review process.
IPCC guidelines require that Technical Papers are derived from:
(a) the text of IPCC Assessment Reports and Special Reports and the portions of material in cited studies that were relied upon in these reports;
(b) relevant models with their assumptions, and scenarios based on socio-economic assumptions, as they were used to provide information in those IPCC Reports.
These guidelines are adhered to in this Technical Paper.
these induces a change in another. Anthropogenic climate change adds a major pressure to nations that are already confronting the issue of sustainable freshwater use. The challenges related to freshwater are: having too much water, having too little water, and having too much pollution. Each of these problems may be exacerbated by climate change. Freshwater-related issues play a pivotal role among the key regional and sectoral vulnerabilities. Therefore, the relationship between climate change and freshwater resources is of primary concern and interest. So far, water resource issues have not been adequately addressed in climate change analyses and climate policy formulations. Likewise, in most cases, climate change problems have not been adequately dealt with in water resources analyses, management and policy formulation. According to many experts, water and its availability and quality will be the main pressures on, and issues for, societies and the environment under climate change; hence it is necessary to improve our understanding of the problems involved.
The objectives of this Technical Paper, as set out in IPCC-XXI – Doc. 96, are summarised below:
to improve our understanding of the links between both natural and anthropogenically induced climate change, its impacts, and adaptation and mitigation response options, on the one hand, and water-related issues, on the other; to inform policymakers and stakeholders about the implications of climate change and climate change response options for water resources, as well as the implications for water resources of various climate change scenarios and climate change response options, including associated synergies and trade-offs.
The scope of this Technical Paper, as outlined in IPCC-XXI – Doc. 9, is to evaluate the impacts of climate change on hydrological processes and regimes, and on freshwater resources – their availability, quality, uses and management. The Technical Paper takes into account current and projected regional key vulnerabilities and prospects for adaptation. The Technical Paper is addressed primarily to policymakers engaged in all areas relevant to freshwater resource management, climate change, strategic studies, spatial planning and socio-economic development. However, it is also addressed to the scientific community working in the area of water and climate change, and to a broader audience, including NGOs and the media.
Since material on water and climate change is scattered throughout the IPCC’s Fourth Assessment and Synthesis Reports, it is useful to have a compact and integrated publication focused on water and climate change. The present Technical Paper also refers to earlier IPCC Assessment and Special Reports, where necessary. The added value of this Technical Paper lies in the distillation, prioritisation, synthesis and interpretation of those materials.
•
•
This Technical Paper deals only with freshwater. Sea-level rise is dealt with only insofar as it can lead to impacts on freshwater in the coastal zone; for example, salinisation of groundwater. Reflecting the focus of the literature, it deals mainly with climate change through the 21st century whilst recognising that, even if greenhouse gas concentrations were to be stabilised, warming and sea-level rise would continue for centuries. [WGI SPM] The importance of freshwater to our life support system is widely recognised, as can be seen clearly in the international context (e.g., Agenda 21, World Water Fora, the Millennium Ecosystem Assessment and the World Water Development Report). Freshwater is indispensable for all forms of life and is needed, in large quantities, in almost all human activities. Climate, freshwater, biophysical and socio-economic systems are interconnected in complex ways, so a change in any one of
7 In this context use of water-hungry appliances such as dishwashers, washing machines, lawn sprinklers etc. 8 Water stress is a concept describing how people are exposed to the risk of water shortage.
1.3 The context of the Technical Paper:
socio-economic and environmental
conditions
Text in the Technical Paper carefully follows the text of the underlying IPCC Reports. It reflects the balance and objectivity of those Reports and, where the text differs, this is with the purpose of supporting and/or explaining further the Reports’ conclusions. Every substantive paragraph is sourced back to an IPCC Report. The source is provided within square brackets, generally at the end of the paragraph (except where parts of a paragraph are sourced from more than one IPCC document, in which case the relevant IPCC source is located after the appropriate entry). The following conventions have been used.
The Fourth Assessment Report (AR4) is the most frequently cited IPCC publication and is represented by, for example, [WGII 3.5], which refers to AR4 Working Group II Chapter 3 Section 3.5. See IPCC (2007a, b, c, d).
Where material is taken from other IPCC sources, the following acronyms are used: TAR (Third Assessment Report: IPCC 2001a, b, c), RICC (Special Report on Regional Impacts of Climate Change: Watson et al., 1997), LULUCF (Special Report on Land Use, Land-Use Change and Forestry: IPCC, 2000), SRES (Special Report on Emissions Scenarios: Nakićenović and Swart, 2000), CCB (Technical Paper V – Climate Change and Biodiversity: Gitay et al., 2002) and CCS (Special Report on Carbon Dioxide Capture and Storage: Metz et al., 2005). Thus, [WGII TAR 5.8.3] refers to Section 5.8.3 of Chapter 5 in the Working Group II Third Assessment Report.
Additional sourcing acronyms include ES (Executive Summary), SPM (Summary for Policymakers), TS (Technical Summary) and SYR (Synthesis Report), which all refer to the AR4 unless otherwise indicated.
References to original sources (journals, books and reports) are placed after the relevant sentence, within round brackets. •
•
•
diet), economic policy (including water pricing), technology, lifestyle7 and society’s views about the value of freshwater ecosystems. In order to assess the relationship between climate change and freshwater, it is necessary to consider how freshwater has been, and will be, affected by changes in these non-climatic drivers. [WGII 3.3.2]
1.3.1 Observed changes
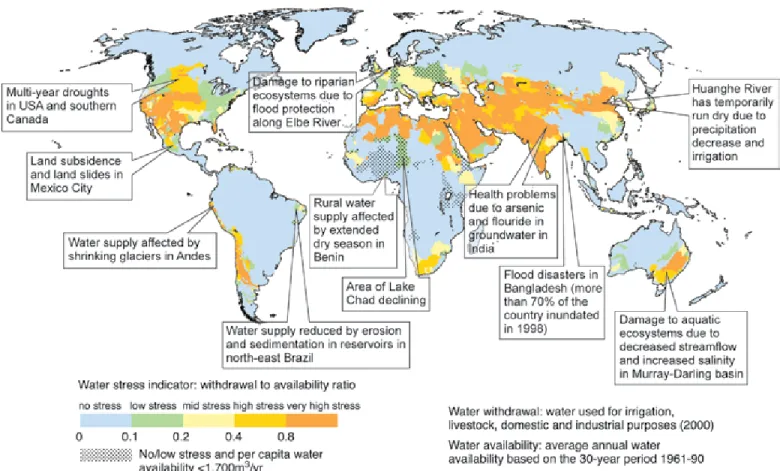
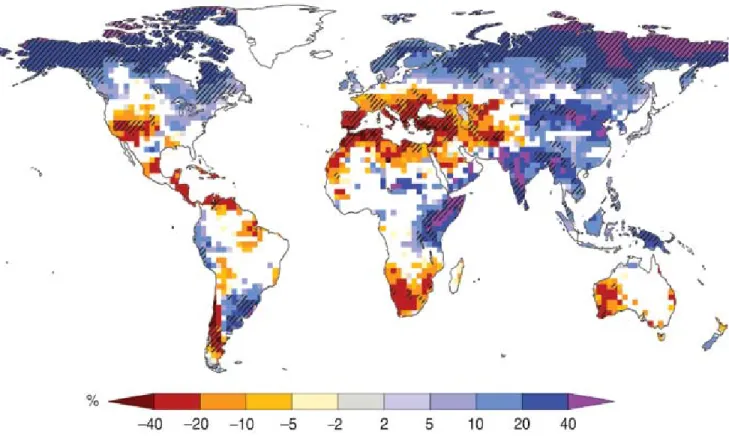
In global-scale assessments, basins are defined as being water-stressed8 if they have either a per capita water availability below 1,000 m3 per year (based on long-term average runoff) or a ratio of withdrawals to long-term average annual runoff above 0.4. A water volume of 1,000 m3 per capita per year is typically more than is required for domestic, industrial and agricultural water uses. Such water-stressed basins are located in northern Africa, the Mediterranean region, the Middle East, the Near East, southern Asia, northern China, Australia, the USA, Mexico, north-eastern Brazil and the west coast of South America (Figure 1.1). The estimates for the population living in such water-stressed basins range between 1.4 billion and 2.1 billion (Vörösmarty et al., 2000; Alcamo et al., 2003a, b; Oki et al., 2003; Arnell, 2004). [WGII 3.2]
Water use, in particular that for irrigation, generally increases with temperature and decreases with precipitation; however, there is no evidence for a climate-related long-term trend of water use in the past. This is due, in part, to the fact that water use is mainly driven by non-climatic factors, and is also due to the poor quality of water-use data in general, and of time-series data in particular. [WGII 3.2]
Water availability from surface water sources or shallow groundwater wells depends on the seasonality and interannual variability of streamflow, and a secured water supply is determined by seasonal low flows. In snow-dominated basins, higher temperatures lead to reduced streamflow and thus decreased water supply in summer (Barnett et al., 2005). [WGII 3.2] In water-stressed areas, people and ecosystems are particularly vulnerable to decreasing and more variable precipitation due to climate change. Examples are given in Section 5.
In most countries, except for a few industrialised nations, water use has increased over recent decades, due to population and economic growth, changes in lifestyle, and expanded water supply systems, with irrigation water use being by far the most important cause. Irrigation accounts for about 70% of total water withdrawals worldwide and for more than 90% of consumptive water use (i.e., the water volume that is not available for reuse downstream). [WGII 3.2] Irrigation generates about 40% of total agricultural output (Fischer et al., 2006). The area of global irrigated land has increased approximately linearly since This Technical Paper explores the relationships between climate
change and freshwater, as set out in IPCC Assessment and Special Reports. These relationships do not exist in isolation, but in the context of, and interacting with, socio-economic and environmental conditions. In this section, we describe the major features of these conditions as they relate to freshwater, both observed and projected.
Many non-climatic drivers affect freshwater resources at all scales, including the global scale (UN, 2003). Water resources, both in terms of quantity and quality, are critically influenced by human activity, including agriculture and land-use change, construction and management of reservoirs, pollutant emissions, and water and wastewater treatment. Water use is linked primarily to changes in population, food consumption (including type of
Figure 1.1: Examples of current vulnerabilities of freshwater resources and their management; in the background, a water stress map based on WaterGAP (Alcamo et al., 2003a). See text for relation to climate change. [WGII Figure 3.2]
1960, at a rate of roughly 2% per annum, from 140 million ha in 1961/63 to 270 million ha in 1997/99, representing about 18% of today’s total cultivated land (Bruinsma, 2003).
Although the rates of regional population change differ widely from the global average, the rate of global population increase is already declining. Global water use is probably increasing due to economic growth in developing countries, but there are no reliable data with respect to the rate of increase. [WGII 3.2, 5.3] The quality of surface water and groundwater has generally declined in recent decades due principally to growth in agricultural and industrial activities (UN, 2006). To counter this problem, many countries (e.g., in the European Union and Canada) have established or enforced effluent water standards and have rehabilitated wastewater treatment facilities (GEO-3, 2003). [WGII 3.3.2, Table 8.1]
1.3.2 Projected changes 1.3.2.1 General background
The four IPCC SRES (Special Report on Emissions Scenarios: Nakićenović and Swart, 2000) storylines, which form the basis for many studies of projected climate change and water resources, consider a range of plausible changes in population and economic activity over the 21st century (see Figure 1.2).
Among the scenarios that assume a world economy dominated by global trade and alliances (A1 and B1), global population is expected to increase from today’s 6.6 billion and peak at 8.7 billion in 2050, while in the scenarios with less globalisation and co-operation (A2 and B2), global population is expected to increase until 2100, reaching 10.4 billion (B2) and 15 billion (A2) by the end of the century. In general, all SRES scenarios depict a society that is more affluent than today, with world gross domestic product (GDP) rising to 10–26 times today’s levels by 2100. A narrowing of income differences between world regions is assumed in all SRES scenarios – with technology representing a driving force as important as demographic change and economic development. [SRES SPM]
1.3.2.2 Water resources
Of particular interest for projections of water resources, with or without climate change, are possible changes in dam construction and decommissioning, water supply infrastructure, wastewater treatment and reuse, desalination, pollutant emissions and land use, particularly with regard to irrigation. Irrespective of climate change, new dams are expected to be built in developing countries for hydropower generation as well as water supply, even though their number is likely to be small compared to the existing 45,000 large dams. However, the impacts of a possible future increase in hydropower demand have not been taken into account (World Commission on Dams,
Figure 1.2: Summary characteristics of the four SRES storylines (based on Nakićenović and Swart, 2000). [WGII Figure 2.5] Region al emph as is Environmental emphasis Economic emphasis Globa l integra tio n
2000; Scudder, 2005). In developed countries, the number of dams is very likely to remain stable, and some dams will be decommissioned. With increased temporal runoff variability due to climate change, increased water storage behind dams may be beneficial, especially where annual runoff does not decrease significantly. Consideration of environmental flow requirements may lead to further modification of reservoir operations so that the human use of water resources might be restricted. Efforts to reach the Millennium Development Goals (MDGs, see Table 7.1) should lead to improved water sources and sanitation. In the future, wastewater reuse and desalination will possibly become important sources of water supply in semi-arid and semi-arid regions. However, there are unresolved concerns regarding their environmental impacts, including those related to the high energy use of desalination. Other options, such as effective water pricing policies and cost-effective water demand management strategies, need to be considered first. [WGII 3.3.2, 3.4.1, 3.7]
An increase in wastewater treatment in both developed and developing countries is expected in the future, but point-source discharges of nutrients, heavy metals and organic substances are likely to increase in developing countries. In both developed and developing countries, emissions of organic micro-pollutants (e.g., endocrine substances) to surface waters and groundwater may increase, given that the production and consumption of chemicals, with the exception of a few highly toxic substances,
is likely to increase. Several of these pollutants are not removed by current wastewater treatment technology. Modifications of water quality may be caused by the impact of sea-level rise on storm-water drainage operations and sewage disposal in coastal areas. [WGII 3.2.2, 3.4.4]
Diffuse emissions of nutrients and pesticides from agriculture are likely to continue to be important in developed countries and are very likely to increase in developing countries, thus critically affecting water quality. According to the four scenarios of the Millennium Ecosystem Assessment (2005a) (‘Global orchestration’, ‘Order from strength’, ‘Adapting mosaic’ and ‘TechnoGarden’), global nitrogen fertiliser use will reach 110– 140 Mt by 2050, compared with 90 Mt in 2000. Under three of the scenarios, there is an increase in nitrogen transport in rivers by 2050, while under the ‘TechnoGarden’ scenario (similar to the IPCC SRES scenario B1) there is a reduction (Millennium Ecosystem Assessment, 2005b). [WGII 3.3.2]
Among the most important drivers of water use are population and economic development, but also changing societal views on the value of water. The latter refers to the prioritisation of domestic and industrial water supply over irrigation water supply and the efficient use of water, including the extended application of water-saving technologies and water pricing. In all four Millennium Ecosystem Assessment scenarios, per capita domestic water use in 2050 is broadly similar in all world regions, at around 100 m3/yr, i.e., the European average in 2000 (Millennium Ecosystem Assessment, 2005b). [WGII 3.3.2] The dominant non-climate-change-related drivers of future irrigation water use are: the extent of irrigated area, crop type, cropping intensity and irrigation water-use efficiency. According to FAO (UN Food and Agriculture Organization) projections, developing countries, with 75% of the global irrigated area, are likely to expand their irrigated areas by 0.6% per year until 2030, while the cropping intensity of irrigated land is projected to increase from 1.27 to 1.41 crops per year and irrigation water-use efficiency will increase slightly (Bruinsma, 2003). These estimates exclude climate change, which is not expected by Bruinsma to affect agriculture before 2030. Most of the expansion is projected to occur in already water-stressed areas such as southern Asia, northern China, the Near East and northern Africa. However, a much smaller expansion of irrigated area is assumed under all four scenarios of the Millennium Ecosystem Assessment, with global growth rates of only 0–0.18% per year until 2050. After 2050, the irrigated area is assumed to stabilise or slightly decline under all scenarios except ‘Global orchestration’ (similar to the IPCC SRES A1 scenario) (Millennium Ecosystem Assessment, 2005a). In another study, using a revised A2 population scenario and FAO long-term projections, increases in global irrigated land of over 40% by 2080 are projected to occur mainly in southern Asia, Africa and Latin America, corresponding to an average increase of 0.4% per year (Fischer et al., 2006). [WGII 3.3.2]
1.4 Outline
Box 1.1: Uncertainties in current knowledge: their treatment in the Technical Paper[SYR]
The IPCC Uncertainty Guidance Note9 defines a framework for the treatment of uncertainties across all Working Groups
and in this Technical Paper. This framework is broad because the Working Groups assess material from different disciplines and cover a diversity of approaches to the treatment of uncertainty drawn from the literature. The nature of data, indicators and analyses used in the natural sciences is generally different from that used in assessing technology development or in the social sciences. WGI focuses on the former, WGIII on the latter, and WGII covers aspects of both.
Three different approaches are used to describe uncertainties, each with a distinct form of language. Choices among and within these three approaches depend on both the nature of the information available and the authors’ expert judgement of the correctness and completeness of current scientific understanding.
Where uncertainty is assessed qualitatively, it is characterised by providing a relative sense of the amount and quality of evidence (that is, information from theory, observations or models, indicating whether a belief or proposition is true or valid) and the degree of agreement (that is, the level of concurrence in the literature on a particular finding). This approach is used by WGIII through a series of self-explanatory terms such as: high agreement, much evidence; high agreement,
medium evidence; medium agreement, medium evidence; etc.
Where uncertainty is assessed more quantitatively using expert judgement of the correctness of the underlying data, models or analyses, then the following scale of confidence levels is used to express the assessed chance of a finding being correct: very high confidence at least 9 out of 10; high confidence about 8 out of 10; medium confidence about 5 out of 10; low confidence about 2 out of 10; and very low confidence less than 1 out of 10.
Where uncertainty in specific outcomes is assessed using expert judgement and statistical analysis of a body of evidence (e.g., observations or model results), then the following likelihood ranges are used to express the assessed probability of occurrence: virtually certain >99%; extremely likely >95%; very likely >90%; likely >66%; more likely than not >50%; about
as likely as not 33% to 66%; unlikely <33%; very unlikely <10%; extremely unlikely <5%; exceptionally unlikely <1%.
WGII has used a combination of confidence and likelihood assessments, and WGI has predominantly used likelihood assessments.
This Technical Paper follows the uncertainty assessment of the underlying Working Groups. Where synthesised findings are based on information from more than one Working Group, the description of uncertainty used is consistent with that for the components drawn from the respective Reports.
9 See http://www.ipcc.ch/meetings/ar4-workshops-express-meetings/uncertainty-guidance-note.pdf.
This Technical Paper consists of eight sections. Following the introduction to the Paper (Section 1), Section 2 is based primarily on the assessments of Working Group I, and looks at the science of climate change, both observed and projected, as it relates to hydrological variables. Section 3 presents a general overview of observed and projected water-related impacts of climate change,
and possible adaptation strategies, drawn principally from the Working Group II assessments. Section 4 then looks at systems and sectors in detail, and Section 5 takes a regional approach. Section 6, based on Working Group III assessments, covers water-related aspects of mitigation. Section 7 looks at the implications for policy and sustainable development, followed by the final section (Section 8) on gaps in knowledge and suggestions for future work. The Technical Paper uses the standard uncertainty language of the Fourth Assessment (see Box 1.1).
Observed and projected changes in
climate as they relate to water
2.1 Observed changes in climate as they
iiiiiii
relate to water
Water is involved in all components of the climate system (atmosphere, hydrosphere, cryosphere, land surface and biosphere). Therefore, climate change affects water through a number of mechanisms. This section discusses observations of recent changes in water-related variables, and projections of future changes.
and subsequent latent heat release above the surface. Hence, absorbing aerosols may locally reduce evaporation and precipitation. Many aerosol processes are omitted or included in somewhat simple ways in climate models, and the local magnitude of their effects on precipitation is in some cases poorly known. Despite the above uncertainties, a number of statements can be made on the attribution of observed hydrological changes, and these are included in the discussion of individual variables in this section, based on the assessments in AR4. [WGI 3.3, 7.5.2, 8.2.1, 8.2.5, 9.5.4; WGII 3.1, 3.2] 2.1.1 Precipitation (including extremes) and
water vapour
Trends in land precipitation have been analysed using a number of data sets; notably the Global Historical Climatology Network (GHCN: Peterson and Vose, 1997), but also the Precipitation Reconstruction over Land (PREC/L: Chen et al., 2002), the Global Precipitation Climatology Project (GPCP: Adler et al., 2003), the Global Precipitation Climatology Centre (GPCC: Beck et al., 2005) and the Climatic Research Unit (CRU: Mitchell and Jones, 2005). Precipitation over land generally increased over the 20th century between 30°N and 85°N, but notable decreases have occurred in the past 30–40 years from 10°S to 30°N (Figure 2.1). Salinity decreases in the North Atlantic and south of 25°S suggest similar precipitation changes over the ocean. From 10°N to 30°N, precipitation increased markedly from 1900 to the 1950s, but declined after about 1970. There are no strong hemispheric-scale trends over Southern Hemisphere extra-tropical land masses. At the time of writing, the attribution of changes in global precipitation is uncertain, since precipitation is strongly influenced by large-scale patterns of natural variability. [WGI 3.3.2.1]
The linear trend for the global average from GHCN during 1901–2005 is statistically insignificant (Figure 2.2). None of the trend estimates for 1951–2005 are significant, with many discrepancies between data sets, demonstrating the difficulty of monitoring a quantity such as precipitation, which has large variability in both space and time. Global changes are not linear in time, showing significant decadal variability, with a relatively wet period from the 1950s to the 1970s, followed by a decline in precipitation. Global averages are dominated by tropical and sub-tropical precipitation. [WGI 3.3.2.1]
Spatial patterns of trends in annual precipitation are shown in Figure 2.3, using GHCN station data interpolated to a 5° × 5° latitude/longitude grid. Over much of North America and Eurasia, annual precipitation has increased during the 105 years from 1901, consistent with Figure 2.1. The period since 1979 shows a more complex pattern, with regional drying evident (e.g., south-west North America). Over most of Eurasia, the number of grid-boxes showing increases in precipitation is greater than the number showing decreases, for both periods. There is a tendency for inverse variations between northern Europe and the Mediterranean, associated with changes in the North Atlantic Oscillation teleconnection (see also Section 2.1.7). [WGI 3.3.2.2]
The hydrological cycle is intimately linked with changes in atmospheric temperature and radiation balance. Warming of the climate system in recent decades is unequivocal, as is now evident from observations of increases in global average air and ocean temperatures, widespread melting of snow and ice, and rising global sea level. Net anthropogenic radiative forcing of the climate is estimated to be positive (warming effect), with a best estimate of 1.6 Wm−2 for 2005 (relative to 1750 pre-industrial values). The best-estimate linear trend in global surface temperature from 1906 to 2005 is a warming of 0.74°C (likely range 0.56 to 0.92°C), with a more rapid warming trend over the past 50 years. New analyses show warming rates in the lower- and mid-troposphere that are similar to rates at the surface. Attribution studies show that most of the observed increase in global temperatures since the mid-20th century is very likely due to the observed increase in anthropogenic greenhouse gas concentrations. At the continental scale, it is likely that there has been significant anthropogenic warming over the past 50 years averaged over each of the continents except Antarctica. For widespread regions, cold days, cold nights and frost have become less frequent, while hot days, hot nights and heatwaves have become more frequent over the past 50 years. [WGI SPM]
Climate warming observed over the past several decades is consistently associated with changes in a number of components of the hydrological cycle and hydrological systems such as: changing precipitation patterns, intensity and extremes; widespread melting of snow and ice; increasing atmospheric water vapour; increasing evaporation; and changes in soil moisture and runoff. There is significant natural variability – on interannual to decadal time-scales – in all components of the hydrological cycle, often masking long-term trends. There is still substantial uncertainty in trends of hydrological variables because of large regional differences, and because of limitations in the spatial and temporal coverage of monitoring networks (Huntington, 2006). At present, documenting interannual variations and trends in precipitation over the oceans remains a challenge. [WGI 3.3]
Understanding and attribution of observed changes also presents a challenge. For hydrological variables such as runoff, non-climate-related factors may play an important role locally (e.g., changes in extraction). The climate response to forcing agents is also complex. For example, one effect of absorbing aerosols (e.g., black carbon) is to intercept heat in the aerosol layer which would otherwise reach the surface, driving evaporation
The largest negative trends since 1901 in annual precipitation are observed over western Africa and the Sahel (see also Section 5.1), although there were downward trends in many other parts of Africa, and in south Asia. Since 1979, precipitation has increased in the Sahel region and in other parts of tropical Africa, related in part to variations associated with teleconnection patterns (see also Section 2.1.7). Over much of north-western India the 1901–2005 period shows increases of more than 20% per century`, but the same area shows a strong decrease in annual precipitation since 1979. North-western Australia shows areas with moderate to strong increases in annual precipitation over both periods. Conditions have become wetter over north-west Australia, but there has been a marked downward trend in the far south-west, characterised by a downward shift around 1975. [WGI 3.3.2.2]
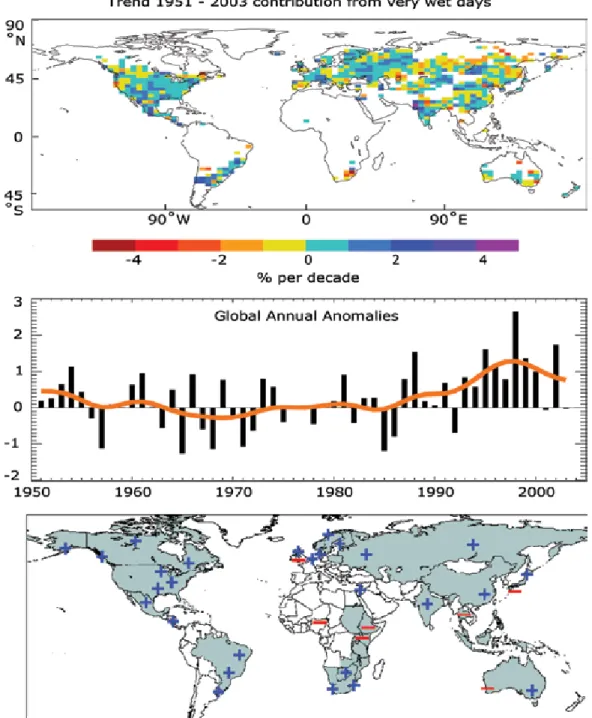
A number of model studies suggest that changes in radiative forcing (from combined anthropogenic, volcanic and solar sources) have played a part in observed trends in mean precipitation. However, climate models appear to underestimate the variance of land mean precipitation compared to observational estimates. It is not clear whether this discrepancy results from an underestimated response to shortwave forcing, underestimated internal climate variability, observational errors, or some combination of these. Theoretical considerations suggest that the influence of increasing greenhouse gases on mean precipitation may be difficult to detect. [WGI 9.5.4] Widespread increases in heavy precipitation events (e.g., above the 95th percentile) have been observed, even in places where total amounts have decreased. These increases are associated with increased atmospheric water vapour and are consistent with observed warming (Figure 2.4). However, rainfall statistics are dominated by interannual to decadal-scale variations, and trend estimates are spatially incoherent (e.g., Peterson et al., 2002; Griffiths et al., 2003; Herath and Ratnayake, 2004). Moreover, only a few regions have data series of sufficient quality and length to assess trends in extremes reliably. Statistically significant increases in the occurrence of heavy precipitation have been observed across Europe and North America (Klein Tank and Können, 2003; Kunkel et al., 2003; Groisman et al., 2004; Haylock and Goodess, 2004). Seasonality of changes varies with location: increases are strongest in the warm season in the USA, while in Europe changes were most notable in the cool season (Groisman et al., 2004; Haylock and Goodess, 2004). Further discussion of regional changes is presented in Section 5. [WGI 3.8.2.2]
Theoretical and climate model studies suggest that, in a climate that is warming due to increasing greenhouse gases, a greater increase is expected in extreme precipitation, as compared to the mean. Hence, anthropogenic influence may be easier to detect in extreme precipitation than in the mean. This is because extreme precipitation is controlled by the availability of water vapour, while mean precipitation is controlled by the ability of the atmosphere to radiate long-wave energy (released as latent heat by condensation) to space, and the latter is restricted by increasing greenhouse gases. Taken together, the observational Figure 2.1: Latitude–time section of average annual
anomalies for precipitation (%) over land from 1900 to 2005, relative to their 1961–1990 means. Values are averaged across all longitudes and are smoothed with a filter to remove fluctuations less than about 6 years. The colour scale is non-linear and grey areas indicate missing data. [WGI Figure 3.15]
Figure 2.2: Time-series for 1900–2005 of annual global land precipitation anomalies (mm) from GHCN with respect to the 1981–2000 base period. Smoothed decadal-scale values are also given for the GHCN, PREC/L, GPCP, GPCC and CRU data sets. [WGI Figure 3.12]
Across South America, increasingly wet conditions have been observed over the Amazon Basin and south-eastern South America, including Patagonia, while negative trends in annual precipitation have been observed over Chile and parts of the western coast of the continent. Variations over Amazonia, Central America and western North America are suggestive of latitudinal changes in monsoon features. [WGI 3.3.2.2]
and modelling studies lead to an overall conclusion that an increase in the frequency of heavy precipitation events (or in the proportion of total rainfall from heavy falls) is likely to have occurred over most land areas over the late 20th century, and that this trend is more likely than not to include an anthropogenic contribution. The magnitude of the anthropogenic contribution cannot be assessed at this stage. [WGI SPM, 9.5.4, 10.3.6, FAQ10.1]
There is observational evidence for an increase in intense tropical cyclone activity in the North Atlantic since about 1970, correlated with increases in tropical sea surface temperatures (SSTs). There are also suggestions of increased intense tropical cyclone activity in some other regions, but in these regions concerns over data quality are greater. Multi-decadal variability and the quality of the tropical cyclone records prior to routine satellite observations in about 1970 complicate the detection of Figure 2.3: Trend of annual precipitation amounts, 1901–2005 (upper, % per century) and 1979–2005 (lower, % per decade), as a percentage of the 1961–1990 average, from GHCN station data. Grey areas have insufficient data to produce reliable trends. [WGI Figure 3.13]
long-term trends in tropical cyclone activity. There is no clear trend in the annual numbers of tropical cyclones. Anthropogenic factors have more likely than not contributed to observed increases in intense tropical cyclone activity. However, the apparent increase in the proportion of very intense storms since 1970 in some regions is much larger than simulated by current models for that period. [WGI SPM]
The water vapour content of the troposphere has been observed to increase in recent decades, consistent with observed warming
Figure 2.4: Upper panel shows observed trends (% per decade) for 1951–2003 in the contribution to total annual precipitation from very wet days (95th percentile and above). Middle panel shows, for global annual precipitation, the change in the contribution of very wet days to the total (%, compared to the 1961–1990 average of 22.5%) (after Alexander et al., 2006). Lower panel shows regions where disproportionate changes in heavy and very heavy precipitation were documented as either an increase (+) or decrease (−) compared to the change in annual and/or seasonal precipitation (updated from Groisman et al., 2005). [WGI Figure 3.39]
and near-constant relative humidity. Total column water vapour has increased over the global oceans by 1.2 ± 0.3% per decade from 1988 to 2004, in a pattern consistent with changes in sea surface temperature. Many studies show increases in near-surface atmospheric moisture, but there are regional differences and differences between day and night. As with other components of the hydrological cycle, interannual to decadal-scale variations are substantial, but a significant upward trend has been observed over the global oceans and over some land areas in the Northern Hemisphere. Since observed warming
of SST is likely to be largely anthropogenic, this suggests that anthropogenic influence has contributed to the observed increase in atmospheric water vapour over the oceans. However, at the time of writing of the AR4, no formal attribution study was available. [WGI 3.4.2, 9.5.4]
2.1.2 Snow and land ice
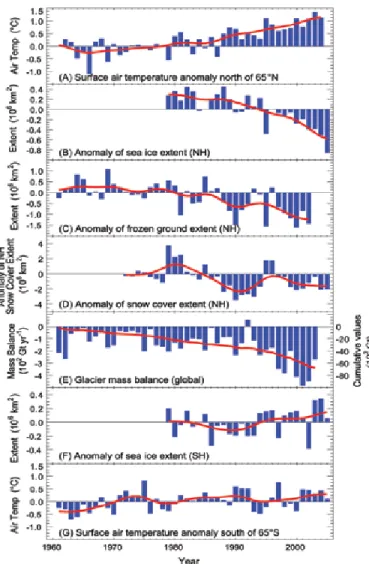
The cryosphere (consisting of snow, ice and frozen ground) on land stores about 75% of the world’s freshwater. In the climate system, the cryosphere and its changes are intricately linked to the surface energy budget, the water cycle and sea-level change. More than one-sixth of the world’s population lives in glacier- or snowmelt-fed river basins (Stern, 2007). [WGII 3.4.1] Figure 2.5 shows cryosphere trends, indicating significant decreases in ice storage in many components. [WGI Chapter 4]
2.1.2.1 Snow cover, frozen ground, lake and river ice Snow cover has decreased in most regions, especially in spring and summer. Northern Hemisphere snow cover observed by satellites over the 1966–2005 period decreased in every month except November and December, with a stepwise drop of 5% in the annual mean in the late 1980s. Declines in the mountains of western North America and in the Swiss Alps have been largest at lower elevations. In the Southern Hemisphere, the few long records or proxies available mostly show either decreases or no change in the past 40 years or more. [WGI 4.2.2]
Degradation of permafrost and seasonally frozen ground is leading to changes in land surface characteristics and drainage systems. Seasonally frozen ground includes both seasonal soil freeze–thaw in non-permafrost regions and the active layer over permafrost that thaws in summer and freezes in winter. The estimated maximum extent of seasonally frozen ground in non-permafrost areas has decreased by about 7% in the Northern Hemisphere from 1901 to 2002, with a decrease of up to 15% in spring. Its maximum depth has decreased by about 0.3 m in Eurasia since the mid-20th century in response to winter warming and increases in snow depth. Over the period 1956 to 1990, the active layer measured at 31 stations in Russia exhibited a statistically significant deepening of about 21 cm. Records from other regions are too short for trend analyses. Temperature at the top of the permafrost layer has increased by up to 3°C since the 1980s in the Arctic. Permafrost warming and degradation of frozen ground appear to be the result of increased summer air temperatures and changes in the depth and duration of snow cover. [WGI 4.7, Chapter 9]
Freeze-up and break-up dates for river and lake ice exhibit considerable spatial variability. Averaged over available data for the Northern Hemisphere spanning the past 150 years, freeze-up has been delayed at a rate of 5.8 ± 1.6 days per century, while the break-up date has occurred earlier at a rate of 6.5 ± 1.2 days per century. There are insufficient published data on river and lake ice thickness to allow the assessment of trends. Modelling studies (e.g., Duguay et al., 2003) indicate that much of the variability in maximum ice thickness and break-up date is driven by variations in snowfall. [WGI 4.3]
Figure 2.5: Anomaly time-series (departure from the long-term mean) of polar surface air temperature (A and E), Northern Hemisphere (NH) seasonally frozen ground extent (B), NH snow cover extent for March–April (C), and global glacier mass balance (D). The solid red line in D denotes the cumulative global glacier mass balance; otherwise it represents the smoothed time-series. [Adapted from WGI FAQ 4.1]
2.1.2.2 Glaciers and ice caps
On average, glaciers and ice caps in the Northern Hemisphere and Patagonia show a moderate but rather consistent increase in mass turnover over the last half-century, and
substantially increased melting. [WGI 4.5.2, 4.6.2.2.1] As
a result, considerable mass loss occurred on the majority of glaciers and ice caps worldwide (Figure 2.6) with increasing rates: from 1960/61 to 1989/90 the loss was 136 ± 57 Gt/yr (0.37 ± 0.16 mm/yr sea-level equivalent, SLE), and between 1990/91 and 2003/04 it was 280 ± 79 Gt/yr (0.77 ± 0.22 mm/yr SLE). The widespread 20th-century shrinkage appears to imply widespread warming as the primary cause although, in the tropics, changes in atmospheric moisture might be contributing.
There is evidence that this melting has very likely contributed to observed sea-level rise. [WGI 4.5 Table 4.4, 9.5]


![Table 3.1: Observed changes in runoff/streamflow, lake levels and floods/droughts. [WGII Table 1.3]](https://thumb-eu.123doks.com/thumbv2/9libnet/3620604.21322/49.918.83.867.658.1069/table-observed-changes-runoff-streamflow-levels-floods-droughts.webp)