ADVANCED ELECTROMAGNETICS, VOL. 8, NO. 2, MARCH 2019
Microstrip Antenna Design with Circular Patch for Skin Cancer
Detection
Rabia Top
1, Yaşar Ünlü
2, Seyfettin Sinan Gültekin
3,
Dilek Uzer
31Department of Electrical and Electronics Engineering, Karamanoglu Mehmetbey University, Karaman, Turkey 2Pathology Laboratory, Konya Training and Research Hospital, Konya, Turkey
3Department of Electrical and Electronics Engineering, Konya Technical University, Konya, Turkey *corresponding author, E-mail: [email protected]
Abstract
Due to the many advantages of microstrip patch antennas, nowadays, microstrip patch antennas are mostly preferred in biomedical areas. This study aims two antenna structures, as both transceiver and receiver, have same dimensions are designed to produce solution of the difficulties in pathology. For antennas with an operating frequency of 2.45 GHz, FR-4 substrate material with a value of 4.4 dielectrics is used. A model has been prepared to detect the presence of skin cancer with the designed antennas. The model is a method of determining E-field and scattering parameters differences between two antennas of cancerous and normal tissue specimens placed on the glass slides. The same antennas and experimental setup were prepared with the normal and cancerous structure of the skin tissue prepared by pathologists. Thus, scattering parameters are measured, and their differences are determined. It has been shown that cancerous tissue can be determined with different values obtained as a result. Ansys HFSS program is used for designs and simulations.
1. Introduction
Pathology, the science of disease, can be defined as scientific examination of diseases. Pathology examines the causes of diseases, how these diseases affect the tissues and organs, and the formal and visual characteristics of diseased tissues and organs. Therefore, pathology has an important place in medical science. Pathology, anatomy and physiology, the information learned in the diseased organs with the naked eye or under the microscope to add to the abnormal appearance of diseases is a science that provides easier understanding. In areas where tissue forms and appearances are extremely helpful, the pathological examination contributes greatly to the diagnosis and appropriate treatment modality. Today, with the diagnosis of tumors, pathological examination is essential and necessary for the definitive diagnosis of many diseases[1].
In the literature, it has been tried to be applied for the detection of cancerous tissue by analyzing the signals taken from pathological tissues by techniques such as signal processing, artificial intelligence and classification methods [2, 3]. However, in these studies, complex system designs such as signal processing steps, both time and cost loss occur. In addition to such biomedical solutions, although
antenna approaches are commonly encountered in the literature[4, 5], there is not enough antenna-based study in the literature for pathological studies and difficulties. On the other hand, in the literature, there is not found about skin cancer detection and the antenna structure solutions presented with this study. For this reason, it is thought that the antenna approach studies in this area are very important.
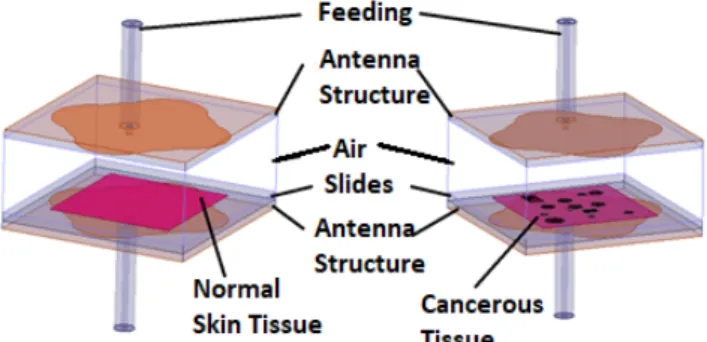
Evaluation and reporting of tissues can sometimes take hours and even days of pathologists. In addition, reporting of the results of tissue fragments taken by depending on the number of patients can sometimes get months. Therefore, in this study, it is aimed to detect a tumorous skin tissue with a microstrip antenna structure. The system is designed on an independent microstrip patch antenna. The separation of the tumor tissue from the normal tissue can be done because of the different dielectric properties of these two skin tissues. In this way, the presence of the tumor between normal and cancerous skin tissues on the slide will be different in the electromagnetic radiation taken from the antenna. When these differences are evaluated, evaluations can be made about the presence of tumor.
Both the modeled three-dimensional system design and the normal and tumor structure of the skin tissue, prepared on the slides by pathologists, are measured using two microstrip patch antennas that have the same type. Tumor and normal tissue measurement differences from simulation and experimental results are evaluated and presented with this proposed study. As the measurement and recording of the differences obtained can be completed in a short time, pathologists will have shortened the stages of analyzing and reporting the tissue samples taken from a patient and the patients will be able to reach their results in a shorter time.
2. Antenna Design
The designed and applied antenna structure and return loss graph representing radiation region is shown in Fig. 1. On a circular patch with a diameter of 28.84 mm, four equal circular patches with a diameter of 16 mm that have equal size to the circular patch center are assembled to form the patch portion of the antenna. The aim here is to shift it to the lower frequency region of the small-sized antenna by increasing the reflection area. In previous simulations, the circular antenna with a diameter of 28.84 mm appeared to radiate in the higher frequency region that is 3.12-3.24 GHz at 3.19 GHz operating frequency and 4 circles are added to
72 reach the ISM band area. As a result of this process, the operating frequency of the antenna was reduced to 2.45 GHz (Fig. 1 (b)) [6]. So, the operating frequency region is 2.41-2.46 GHz. The reason for selecting the 2.45 GHz frequency region is because it is the ISM band region.
(a)
(b)
Figure 1: Antenna structure a) Dimensions and top view, b) Return loss graph.
As a substrate material of the antennas, FR-4 with a thickness of 1.6 mm and a dielectric value of 4.4 is chosen. In the design, coaxial (probe) feed structure is used and antenna excitation is made by defining the wave port. The same antenna structure is used as both a receiver and a transmitter.
According to the antenna evaluation parameters, the antenna gain is 1.89 dB. The impedance is 50 Ω in the simulation and 46.167 Ω in the measurement (Fig. 2). The Standing Wave Ratio (SWR) of the antenna structure is measured as 1.183.
Figure 2: Measured impedance value of the proposed antenna.
3. Modeled Pathological Glass Slide Structure
Pathological tissue samples taken from alive are evaluated by placing them on the glass slides to be 3-5 µm in dimensions. The thickness of the slide is selected the same thickness of the substrate material, and for the simulation the glass slide features are defined in the program. In this study, a tissue obtained from skin cancer is modeled. Each tissue has different electrical properties, and the electrical properties of normal and tumor skin tissue are different. In the literature, the 38 F/m dielectric value of normal skin tissue and the 50 F/m dielectric value of cancerous skin tissue are taken for the working frequency of 2.45 GHz[7]. The electrical properties of the tissues are introduced in the HFSS program and designed system is shown in Fig. 3.
A rectangular skin model with a volume of 25x25x0.005 mm3 is made. The height of the air structure is chosen as 15 mm at near-field region and at another simulation it is chosen 5 cm which obtained Equation (3.1). This equation explains far-field region area to calculate field values easily. The far-field simulation results are evaluated using a comparative table in Section 5. Simulations are firstly made with normal skin and then with tumor tissues placed in different sizes and positions into normal skin. Differences in electric field values and in scattering parameter values have been examined by expressing with and without tumor respectively.
, (3.1) Where r is far-field distance, d is maximum antenna length and λ is wavelength[8].
Figure 3: Designed system structure.
4. Measurement of Real Skin Tissue Specimens with Applied Antenna Structure
The structure of the experimental setup applied and shown in Fig. 4 is partially like similar to the modeling structure given in Fig. 3. A 85-year-old female patient is included in the Konya Training and Research Hospital Pathology Unit and her normal and tumor skin tissues are obtained for use in the experimental setup. These tissue samples that pathologists have prepared and placed on the slide are prepared in a normal tissue sampling process. In the experimental setup, normal and cancerous tissue samples are placed on the transceiver antenna, which is the same as the receiving antenna. A gap of 5 cm space between the slide
2 (2d ) r >
73 and the receiving antenna is maintained. 5 cm air gap distance is chosen because it is difficult to apply a 15 mm air gap in the measurements according to simulations. The measurements between transceiver and receiver antennas are implemented by using the “Vector Network Analyzer” (RS ZVL-13) with the test setup prepared in a similar manner to the modeling in Fig. 3 (Fig. 4). Differences between normal and tumor tissue are determined from the scattering parameters obtained by the measurements. These differences are found to be important in differentiating the difference between cancerous and normal tissue.
(a)
(b)
Figure 4: Experimental setup (a) and the glass slides (b).
5. Simulation, Experiment Results and Evaluation
5.1. Simulation
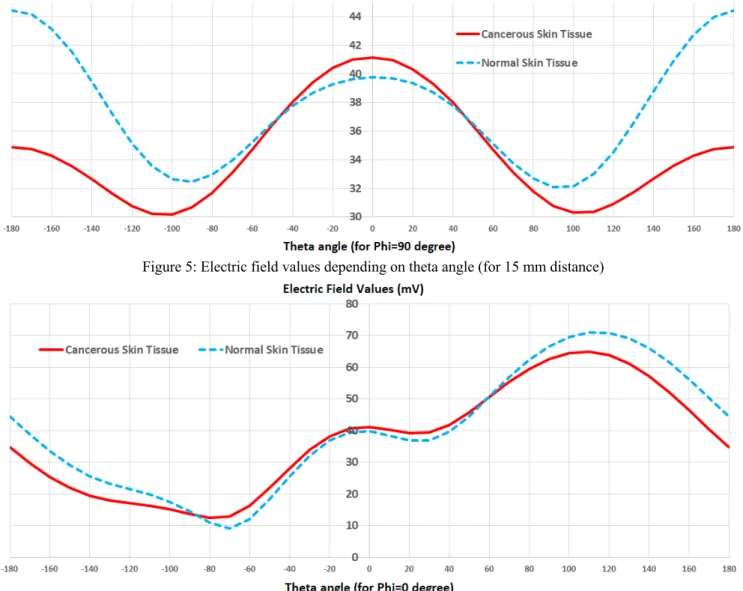
Simulations are made in the light of the above data. Differences in electrical field values are shown in Fig. 5 and 6 with cancerous and normal tissues. In order to calculate the electric field value in these graphs θ angle is changed between -180o and +180o and φ = 0 and 90o values are taken. The electric field values at near-field in HFSS calculate as below[9]:
,
(5.1)
, (5.2)
Where, s represents the radiation boundary surfaces, j is the imaginary unit, ω is the angular frequency, 2πf. µ0 is the relative permeability of the free space, 4π10-7 H/m. Htan is the component of the magnetic field that is tangential to the surface. Enormal is the component of the electric field that is normal to the surface. Etan is the component of the electric field that is tangential to the surface. G is the free space Green’s function, where, k0 is the free space wave number,
,
r and r’ represent field pointsand source points on the surface, respectively. ℇ0 is the permittivity of free space, 1/(c2µ0), ℇr is the relative permittivity of a dielectric. µris the relative permeability of a dielectric.
Fig. 5 and 6 are important in terms of showing differences in tumor and normal tissues as depending on different dielectric values from Equation (5.1) and (5.2), ℇr. These figures are showed differences at 15 mm distance in near-field region. Using these differences, it is predicted that the results of pathological tissues can be obtained in a short time. Included electric field data tables are exported from HFSS program. In addition, the results of S11, S12, S21 and S22 values, which are called scattering parameters, are analyzed and evaluated with and without tumor.
5.2. ExperimentalResults
Given in Fig. 4, the experimental setup is made, and the antenna measurements are taken. The scattering parameters, S11, S12, S21 and S22 are obtained after measurements. These parameters are obtained from measurements are shown in Fig. 7, 8, 9 and 10, and differences between tumor and normal skin tissue are presented via these figures.
0
(( ) ( ) ( ))
( , , )
s
j tan G tan G normal G
x y z = ò wµH + E CÑ + E Ñ ds E 0| '| '
|
|
r r jk r r r re
G
µ e --=
o o ω μ × ε = ω / cADVANCED ELECTROMAGNETICS, VOL. 8, NO. 2, MARCH 2019
Figure 5: Electric field values depending on theta angle (for 15 mm distance)
Figure 6: Electric field values depending on theta angle (for 15 mm distance)
5.3. Evaluation
In the light of the above information, both simulations and measurements are made in order to evaluate the pathological data faster, safer and more efficiently and to reach the report outputs in a short time. Pathological outcomes that determine the form and nature of treatment are always important for patients and doctors. S11, S12, S21 and S22 values, called as scattering parameters, which are taken as a result of the simulations and experiments are examined. The graphs of the results are given in Fig. 7, 8, 9 and 10. In addition, the evaluation of the electrical field data obtained by using the simulation outputs is implemented. The electrical field differences between normal and tumor skin tissues are given in Fig. 5 and 6. Especially in the results found for θ=170o, the differences of the obtained electric field values between normal and cancerous skin tissues have the biggest values. Table 1 shows the maximum S-parameters values and percent changes in the presence of tumor for simulations at 15 mm and 5 cm distances and experiment at 5 cm distance from glass to receiver antenna. It is shown that there are important differences with and
without tumorous skin tissue according to near-field or far-field region distance. These differences are considered to be very important considering the pathologists' evaluations and long term field reporting periods and patient density. In addition, S-parameter values or electric field values can be used for this determination, if it is desired to work in which field region. The fact that similar studies of this type are not earlier offered the solutions depend on antenna structures increases the value of the study. This approach to the detection of cancerous structure will provide long-term field pathology reports to be reached in a short time. In this way, the treatment of patients at a very critical point can be started in a short time.
75 Table 1. Maximum Values of S-Parameters' Absolutes
Field Region Far-field Near-field
Distance type 5 cm from simulation 5 cm from measurement 15 mm from simulation Tissue Type Tumorous Normal Dif.-% Tumorous Normal Dif.-% Tumorous Normal Dif.-%
S11 10.74 10.92 1.65 21.95 23.6 6.99 14.967 15.08 0.75
S12 81.44 85.81 5.09 60.13 63.17 4.81 43.12 42.71 -0.96*
S21 80.68 85.83 6.00 59.99 61.32 2.17 43.62 42.71 -2.13*
S22 11.87 12.08 1.74 35.43 38.3 7.49 6.39 6.2 -3.06*
* means that while there is tumorous tissue, the increase of electric field average value in percentage shows.
Figure 7: Differences of S11 values between cancerous and normal tissue obtained from the experimental setup
Figure 8: Differences of S12 values between cancerous and normal tissue obtained from the experimental setup
Figure 9: Differences of S21 values between cancerous and normal tissue obtained from the experimental setup.
Figure 10: Differences of S22 values between cancerous and normal tissue obtained from the experimental setup.
6. Conclusion
In this study, a microstrip patch antenna structure is proposed in order to find solutions for the time and difficulties encountered in detecting especially the tumor structure in the field of pathology. This structure consists of two antennas as receiver and transmitter. The antennas operate at 2.45 GHz at the ISM frequency band. The substrate material is FR-4 has the thickness of 1.6 mm. The electromagnetic wave emitted from the antenna has produced different values due to differences between normal and tumorous tissue when it reaches the other antenna. According to these differences, the arithmetic average of electric field value decreases by 7.16% for φ=0o, and it decreases by 8.07% in φ=90o. For φ=0o, while theta angle is 170 degree, the difference of electric field values are the highest. For cancerous skin tissue, maximum electric field value is 40.5 mV at θ=170o, and for normal skin tissue, maximum electric field value is 50.3 mV at the same theta angle. The difference value of these amounts is 9.80 mV as maximum difference value between all attained electric field values for both φ=0o and φ=90o. At the same time, by calculating on their arithmetic mean the scattering parameters S11, S12 and S21 values can be said to have increased by 0.02%, 0.26%, 0.36% respectively and S22 values can be said to have decreased 0.57%.
As for the application part, an experimental setup similar to the simulation set is prepared. The antenna structure used is the same for both the receiver and the transmitter. In the meantime, air gap is left with a distance of 5 cm and lamina measurements with both normal and tumor skin tissues are made. At the end of the measurements, the scattering parameters obtained from the vector network analyzer are
76 investigated. The differences in S11, S12, S21 and S22 are clearly seen in the graphs. When the values of S11, S12, S21 and S22 are examined, it can be said that, at the presence of tumor tissues, these parameter values decrease by 0.38%, 2.34%, 1.82% and 0.22% respectively as their arithmetic mean.
In addition, by determining at 5 cm and 15 mm distance for simulations and for experiment at 5 cm distance for field region, it is presented the comparative table. This table explains the maximum S-parameters values’ percent changes in the presence of tumor in terms of both simulations and experiment as per field region, near or far field. If it is desired to use differences in the electric field values, measurements in the near field are more useful, and it will be more useful the use of differences in s-parameters if it is desired to take measurements in the remote area.
When looking at the percentage values obtained, it is possible to say that the difference in scattering parameters for the simulation results is small but the difference between S12 and S21 values that express the transmitted and reflected part is important and more illuminating. In the light of all these data, it is possible to say that the designed antenna structure can be used in the determination of tumor structure in pathological data. It is also more accurate to express the suitability and success of the study when looking at the application values. In addition, the antenna structures of high and different frequencies in circular structure, and differential approaches for early diagnosis of skin cancer can be suggested.
References
[1] J. W. Patterson, Weedon's Skin Pathology E-Book. Elsevier Health Sciences, 2014.
[2] T. C. Bowman, M. El-Shenawee, and L. K. Campbell, "Terahertz Imaging of Excised Breast Tumor Tissue on Paraffin Sections," IEEE Transactions on Antennas
and Propagation, vol. 63, no. 5, pp. 2088-2097, 2015.
[3] G. Schaefer, "Strategies for imbalanced pattern classification for digital pathology," in Informatics,
Electronics and Vision & 2017 7th International Symposium in Computational Medical and Health Technology (ICIEV-ISCMHT), 2017 6th International Conference on, 2017, pp. 1-4: IEEE.
[4] R. Çalışkan, S. S. Gültekin, D. Uzer, and Ö. Dündar, "A microstrip patch antenna design for breast cancer detection," Procedia-Social and Behavioral Sciences, vol. 195, pp. 2905-2911, 2015.
[5] R. Top, S. S. Gültekin, and D. Uzer, "Modeling congestion of vessel on rectangular microstrip antenna and evaluating electromagnetic signals," in Signal
Processing and Communications Applications Conference (SIU), 2017 25th, 2017, pp. 1-4: IEEE.
[6] R. TOP, "A Transmitter Microstrip Antenna Design And Application Towards The Detection Of Heart Disease Parameters," Master of Science Master Thesis, The Degree of Master of Science In Electrical-Electronics Engineering, Selcuk University, Konya, 2017.
[7] C. Gabriel, "Compilation of the Dielectric Properties of Body Tissues at RF and Microwave Frequencies," KING'S COLL LONDON (UNITED KINGDOM) DEPT OF PHYSICS1996.
[8] C. A. Balanis, E. Aydın, M. F. Çağlar, and A. Kara,
Anten teorisi: analiz ve tasarım. Nobel, 2013.
[9] H. Ansoft, "14, User Manual," ed: Ansys Corp., Canonsburg, PA, USA, 2013.