K. Ali AKKEMİK
*Its Sustainability in China
Introduction
China has recorded unprecedentedly high growth rates since 1978, when the central government undertook significant reforms to industrialize and open up the economy with a dual-track system comprised of “market-economy” and “plan-economy” segments for each market. The central government has also adopted an export-oriented growth strategy. Despite the well-known widening income inequality, China not only grew remarkably in this period but also succeeded in saving about a half billion of its citizens out of absolute poverty, at an unseen scale in the history as we know it.1 With high growth rates averaging about 10 % since the late 1990s, the size of the Chinese economy surpassed Japan in nominal terms in 2010 to become the second largest economy in the world following the United States. At the same time, China also overtook Germany to become the largest exporter. The London-based journal The Economist drew an analogy between China’s growing share in total world exports, rising incredibly to more than 10 %, and the heydays of Britain
Abstract
China has recorded remarkable growth rates for three and a half decades. Recently, the annual growth rate has slowed down and is projected to decline gradually to 5 % by 2030. This article examines how high economic growth was realized in the past and whether it can be sustained in the future. In doing this, the paper takes into consideration the projections about future growth rates. The article emphasizes that the main reason for the reduction in the future growth rates is the unsustainability of the currently high investment rates in the long run. In addition, the diversification of financial instruments for the already high savings is important. Necessary improvements in the financial sector are discussed in conjunction with the long term sustainability of economic growth rates.
Key Words
China, economic growth, investment, financial sector, savings.
* Assoc. Prof. Dr. Kadir Has University, Department of Economics, İstanbul, 34083, Turkey.
mid-1990s, it was believed that some East and Southeast Asian countries had discovered a recipe for economic development and industrialization different from the one in the West. Many researchers have examined how the East and Southeast Asian economies have developed and industrialized successfully within a short period of time. However, with the slump of the Japanese economy after the bubble burst of the early 1990s and the Asian financial crisis in 1997-1998, this respect turned into disappointment and harsh criticism of the capitalistic development experiences of these countries. With the declining importance of Japan and the newly industrializing Asian economies in the world economy after the 1990s, the interest in East Asia faded, but the rise of China in the global economic stage attracted the attention again to the eastern part of Asia. This time, researchers were to examine how this country, which produced the concept of a socialist market economy in 1992, grew very fast. The aim of the central government is to turn China into an industrial economy like its neighbours Japan and Korea.
This paper examines this high economic growth and its slowdown in the near future by taking into consideration future projections and political economy considerations along with implications for global rebalancing. Special emphasis is put on the need to transform the in the 19th century when Britain as
the top exporter in the world directed world trade flows.2 Economists generally agree that the government’s export-led growth and industrialization strategy, accompanying foreign exchange policy, and foreign direct investments attracted into China have facilitated this high growth performance.3
The World Bank has recently reported that China will join the list of high-income countries in 15-20 years.4 An implication of this statement is that China will be able to overcome the middle-income trap. If this happens, it is likely that China will be a success story to learn from for countries trapped in the middle income levels, such as Turkey is now, and researchers will seek to draw lessons from China’s experiences. In the same vein, during the period from the 1960s to the
China has recorded
unprecedentedly high growth
rates since 1978, when the
central government undertook
significant reforms to
industrialize and open up the
economy with a dual-track
system comprised of
“market-economy” and “plan-“market-economy”
segments for each market.
as the BRICs, reached their limit of rapid growth and they could no longer serve as the growth engine for the world economy.5 However, this should not be taken negatively. The Economist emphasizes an important detail: among the top 100 fastest supercomputers in the world not a single one belonged to the BRICs in 1997, but in 2013 six of them were in China and another six in the rest of the BRICs. The striking fact is that China’s Tianhe-2 supercomputer topped the list. It is evident from this comparison that the technological gap between China and the forerunning advanced economies has been closing during the course of rapid growth. Obviously, China has fully exploited the opportunities of rapid growth through technology acquisition and emulation, which were once believed to be important sources of growth. It is now in a position to create new technologies.6
pattern of economic growth from one dominated by capital accumulation to one emphasizing private consumption. To this end, a simple quantitative analysis is employed to discuss the implications of investment-led or consumption-led growth strategies. The accompanying policies and the essential restructuring especially in the financial sector have also been discussed in depth.
Economic Growth in China
and Its Sources
The average annual growth rate of real GDP in China during the period 1995-2010 was an incredible 9.9 %. Figure 1 shows that the economic growth rate accelerated after 1999, reached 14.2 % in 2007, and slowed down after 2007 due to the global financial crisis. However, despite the decline, the economic growth rate was still in the vicinity of 9-10 % following the crisis. Thanks to China’s high growth performance, the world economy was able to record positive growth rates during this period, effectively raising China to the status of the saviour of the world economy. China was joined by Brazil, Russia, and India as the newly emerging high-growth economies. On the other hand, the Economist reported in 2013 that despite their high growth rates compared to the advanced countries, these four countries, commonly called
With the declining importance
of Japan and the newly
industrializing Asian economies
in the world economy after the
1990s, the interest in East Asia
faded, but the rise of China
in the global economic stage
attracted the attention again to
the eastern part of Asia.
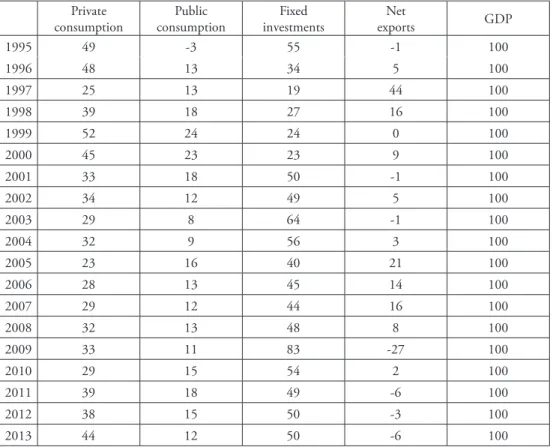
is the case for many countries), if the growth in total expenditures (i.e., GDP) in an economy is not resulting mainly from private consumption, then it has to be either because of investments or net foreign expenditures (i.e., exports), or a combination of the two. The sustainability of either of these two expenditure items in GDP over long periods of time is doubtful. In the case of China, except for certain years, the contribution of fixed investments to economic growth has exceeded 50 % after 2001. To put it differently, it is observed that households in China are not spending much and firms are investing heavily to expand their production capacities and capital stocks. That is to say, Chinese firms have spared about half of their production to add more to their production capacity in order to be able produce more in the future.
Understanding the main sources of economic growth is as important as understanding the trends in economic growth. The simplest way to do this is to decompose the growth in real GDP into its expenditure (demand) components, namely, private consumption expenditures of households, public consumption expenditures, fixed capital investments, and net exports, as shown in Table 1. The figures in the table reveal the percentage contribution of the expenditure components to economic growth. The most striking observation is the reduction in the share of private consumption expenditures from 49 % in 1995 to 30 % band after 2001. By no means is this a desirable or healthy situation for economic growth, for the following reason. If we assume that public expenditures do not change much as a share of GDP in the long-run (which
Figure 1: Real GDP growth rate in China (1995-2013)
0% 2% 4% 6% 8% 10% 12% 14% 16% 1995 1996 1997 1998 1999 2000 2001 2002 2003 2004 2005 2006 2007 2008 2009 2010 2011 2012 2013
Data source: UN National Accounts Database, at http://unstats.un.org/unsd/snaama/selbasicFast.asp (last visited 15 June 2015).
capital stock will continue. Investments in China have been undertaken by domestic firms and recently by foreign investors. It is understood that until recently most of the foreign-owned firms aimed to increase exports to the home country. According to the official data published in the China Statistical Yearbook, foreign-owned firms (wholly-foreign-owned and majority-foreign-owned firms altogether) produced about Fixed investments (i.e., investments in
physical capital stocks such as machinery, equipment, vehicles, buildings, and so on) can boost economic growth only if they are profitable enough to attract necessary funds. As long as the returns to investments are high enough for private capital owners who base their expectations mainly on future income streams and profit prospects of given investment projects, additions to
Table 1: Sources of economic growth in China as percentage of GDP (1995-2013)
Private
consumption consumptionPublic investmentsFixed exportsNet GDP
1995 49 -3 55 -1 100 1996 48 13 34 5 100 1997 25 13 19 44 100 1998 39 18 27 16 100 1999 52 24 24 0 100 2000 45 23 23 9 100 2001 33 18 50 -1 100 2002 34 12 49 5 100 2003 29 8 64 -1 100 2004 32 9 56 3 100 2005 23 16 40 21 100 2006 28 13 45 14 100 2007 29 12 44 16 100 2008 32 13 48 8 100 2009 33 11 83 -27 100 2010 29 15 54 2 100 2011 39 18 49 -6 100 2012 38 15 50 -3 100 2013 44 12 50 -6 100
Data source: UN National Accounts Database, at http://unstats.un.org/unsd/snaama/selbasicFast.asp) (last visited 15 June 2015).
of long-run economic growth. One is the accumulation of inputs (production factors) used in production such as labour, including human capital, and physical capital stock. The former can be accumulated through population growth and extensive education. The latter can be accumulated through expanding production facilities, such as building a new factory, purchasing new machines, and so on. The second source of growth is the improvement in the efficiency of using these inputs, named total factor productivity. Improvements in efficiency such as organizational innovations in firms, research and development activities, and advancement of technologies and production techniques are some examples of how to improve the overall productivity of production factors.9
These two sources of growth are also bound by some features of the accumulation of production factors. One is the diminishing returns to the accumulation of physical capital. According to the mainstream economic theory, which dominates economic thinking in the modern world, a country cannot continue accumulating physical capital without facing decreasing returns. At the earlier stages of development, it is reasonable to expect a country to build more industrial facilities during the course of industrialisation. However, the return to physical investments will get lower over time. When capital is scarce, its return will naturally be higher. When 10 trillion yuan worth of output in 2009,
a figure comparable to 15 trillion yuan by state- owned owned enterprises, and accounted for about 50-55 % of total exports from China since 2000. However, as the Economist demonstrates, recently, these firms are increasingly becoming interested in expanding their business operations in the Chinese domestic market7 thanks to the rapidly growing middle-class in China. According to an influential study by Kharas and Gertz, the size of the middle class in China was about 157 million, roughly 12 % of the population, in 2009.8 They predict the percentage share of the middle class in China to reach 70 % by 2030.
Many economists point out that the extraordinarily high share of investments in GDP, as high as 50 %, in China is not sustainable. Their reasoning is based on a technique named “growth accounting”. This technique, in its simplest form, postulates that there are two major sources
Improvements in efficiency such
as organizational innovations in
firms, research and development
activities, and advancement of
technologies and production
techniques are some examples
of how to improve the overall
productivity of production
factors.
technological capabilities may support economic growth. Therefore, investments in new technologies and technology transfer from advanced economies are important. For China this is especially important in the age of the Knowledge Economy, which is characterized by extensive use of knowledge-intensive technologies and techniques in almost every economic activity and the comparative advantages of countries and firms are based on knowledge absorption and creation capacity. This requires an effective design of science and technology policies and national innovation systems for technology creation and diffusion. The government is aware of the essentialness of technological development. In the 12th Five-Year Plan covering the years 2011-2015, scientific development was emphasized as a primary objective and the promotion of innovation via indigenous sources was a focus. The plan had envisaged increasing research and development expenditures as a percentage of GDP beyond 1.75 %.11 In the preparation of the 13th Five-Year Plan (2016-2020), innovation and the promotion of scientific development have been raised as priority issues.12 Comparing China with advanced economies, China ranked second in 2014 in total research and development spending (about US$ 280 billion) after the US (US$ 460 billion) and ranking above Japan, Germany and the UK.13 capital becomes abundant (i.e., when
the economy reaches a higher or more advanced level of industrialisation), the reverse will hold and returns will get lower. The same argument applies also to labour. In effect, the first source of economic growth based on the accumulation of production factors will be out-dated when the economy matures. This leaves efficiency improvement as the only viable option to increase or sustain economic growth rate in the long run. This is the healthiest way to grow over the long term.
The necessity of the second source of growth, however, does not entirely single out the first source for developing economies like China. A combination of both might work as well. It might be possible for a country to increase its physical capital stock and labour endowment in the long run while improving the efficiency of using these resources. For instance, the experiences of China and Korea have proved that increasing the education level and skills of the labour force pay off well in the long run.10 Similarly, the physical capital stock of a country can be expanded by mobilizing domestic and foreign sources of entrepreneurship. However, the returns to both labour and physical capital will decrease over time and the contribution of both labour and capital to economic growth will diminish. On the other hand, improving the quality of capital and labour by way of upgrading
Such high national savings rates as 50 % are not sustainable.
There are various reasons for such high savings rates. Ge and Yang have shown that one reason for high household saving rate is the insufficiency of the social security system in China.14 Since people need to save for their retirement years, a large part of savings may result from old age pension needs. Another important reason is the requirement of down payments when purchasing a house, 30 % of the price for the first house purchased. For many people, purchasing a house for their families is an important target in life. On the other hand, the central government has introduced various measures since 2008 to regulate house prices, and the downpayments have been raised to 40 % of the price of the house for the purchase of the second house.15 After gradually raising it to 60 %, in late 2014 the government equalized the downpayments for both types of houses, essentially making it easier for people to purchase for investment purposes.16 Currently, household saving rates are high but with the increase in per capita income in the future, it is reasonable to expect this saving rate to decrease as people will demand higher living standards and readjust their spending accordingly. It is also expected that the Chinese government will improve the social security system in response to the demands from the growing middle class. Rethinking the economic growth
experience of China within mainstream economic theory, productivity improvement and productivity-led growth are highly desirable to sustain growth rates at relatively high levels. China’s potential growth rate will decline from 10 % to lower levels (5-7 %) in the near future but even such growth rates are unimaginably high for advanced countries due to the maturity achieved by such economies. On the side of physical capital accumulation, it is also important to consider how this will be financed. Funds for physical capital investments are largely provided by domestic sources, namely households, government, and enterprises, in the form of savings. Like high investment to GDP ratio, China also has high national savings to GDP ratio, around 50 %. National savings are made up of household savings, government savings (roughly equal to budget surplus), corporate savings, and net foreign savings (inflow of foreign capital minus outflow of domestic savings abroad).
Currently, household saving
rates are high but with the
increase in per capita income
in the future, it is reasonable to
expect this saving rate to decrease
as people will demand higher
living standards and readjust
their spending accordingly.
to increase to higher levels and the government wants this ratio to decline), the only possibility is a decline in the efficiency of investments, which implies a lower economic growth rate.19 In other words, the cost of a high savings rate and hence high investment rate will manifest itself as lower GDP growth in the near future.20
While China is sparing half of its GDP for investments to increase physical capital stock, and given the expectation that the returns to these investments will decline in the future, household consumption expenditures will become important as a source of economic growth. Therefore, domestic demand-led growth is a viable option for China. In fact, recent statements by the Chinese government emphasize the desire of the government to realize a transformation from investment-led economic growth to consumption-led economic growth.21 It is worth noting here that much of the investments are realized by state-owned-enterprises, which are funded by loans from the domestic banks, and smaller enterprises find it difficult to access to funds and are forced to obtain these funds from the shadow banking system at higher interest rates. Historical statistics for advanced economies reveal that when economies mature, domestic demand becomes the propelling force for economic growth. There are two possible sources of spending, increase in the number of consumers and increase On the other hand, there are historical
examples from other countries that improvement in social security system may not bring about decline in savings rate. For instance, in the 1970s and 1980s Japan did not experience a significant reduction in the saving rates despite the improvements and adjustments in the social security system.17
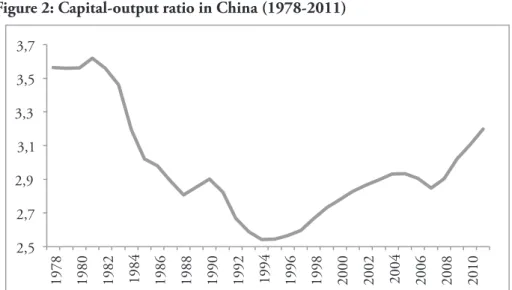
Using macroeconomics we can trace the relationship between investments, capital stock, and GDP with a simple equation as shown by Kazuo Sato.18 The equation in the footnote states that investment to GDP ratio increases with higher capital-output ratio and higher efficiency of investments. When the supply of funds (savings) is larger than the demand for these funds, it is necessary to decrease the demand, i.e., investment to GDP ratio. However, policymakers are also concerned about the economic growth rate, which may decline due to slow-down in investment demand. Then, if economic growth will not decline, the capital-output ratio should decline assuming the efficiency of investments remains the same. Using data from Penn World Tables, we can examine the case of China. Figure 2 shows the estimated capital-output ratio in China for the post-reform period of 1978-2011. Capital-output ratio has increased since the late 1990s and this gave rise to increasing investment to GDP ratio. Even to keep this ratio at its current level (since it is not desirable
because this will reduce savings arising from insufficient social security. The Chinese government already possesses enough funds to be used for this purpose, mostly through large tax revenues collected thanks to high economic growth and through enlarging official reserves thanks to large trade surpluses. in consumers’ incomes. Then, increase in
spending is necessary given the limited population growth in China due to the government’s strict population policy. How to increase income levels of consumers is an important policy question. Improvement in the social security system will surely help increase private consumption expenditures
Figure 2: Capital-output ratio in China (1978-2011)
2,5 2,7 2,9 3,1 3,3 3,5 3,7 1978 1980 1982 1984 1986 1988 1990 1992 1994 1996 1998 2000 2002 2004 2006 2008 2010
Data source: Penn World Tables, at http://febpwt.webhosting.rug.nl/Dmn/AggregateXs/VariableCodeSelect (last visited 15 June 2015).
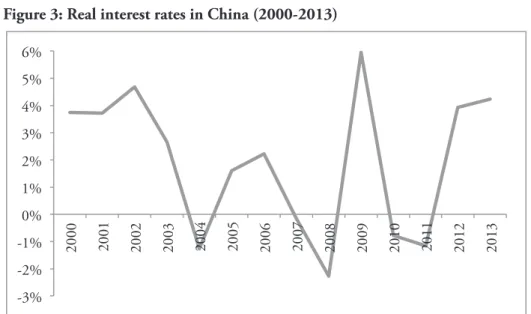
Another important variable to consider about investments is the cost of funds channelled towards investments. According to official statistics, the real interest rate in China has remained at significantly low levels. Figure 3 shows the trend in real interest rates in China on an annual basis computed by deducting
the inflation rate (calculated using the consumer price index) from the officially announced nominal interest rates. An interpretation of the low real interest rates is that the cost of undertaking investments was relatively low in China. In certain years, the real interest rate was even negative.
of the findings in the paper are based on background papers. Therefore, the data in the report should be taken seriously.
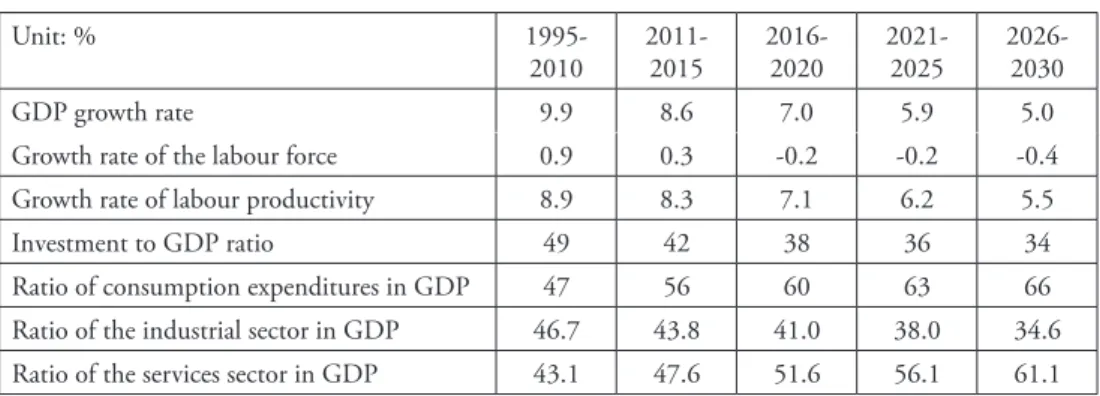
Table 2 shows, using the World Bank’s projections, that the growth rate of the labour force in China is projected to decrease over time and even turn negative after 2015. In other words, demographic dynamics in China demonstrate that the population growth rate will slow down and the size of the labour force will reach a level of saturation. This is obviously related with the one-child policy of the government implemented since the late 1970s. It is projected that the economic growth rate will not be at the two-digit levels and will drop gradually to around 5 % by 2030. Furthermore, labour
Future of Economic Growth
in China
Understanding the future of economic growth is important. The World Bank’s report China 2030: Building
a Modern, Harmonious, and Creative Society evaluates prospects for economic
growth in China with projections for economic growth until 2030.22 There is also information about the intentions and projections of the government in the Chinese government’s official documents especially those of the five-year plans. Table 2 highlights these projections. It is worth noting here that this report was prepared in cooperation with the Chinese government and most
Figure 3: Real interest rates in China (2000-2013)
-3% -2% -1% 0% 1% 2% 3% 4% 5% 6% 2000 2001 2002 2003 2004 2005 2006 2007 2008 2009 2010 2011 2012 2013
Note: Computed by deducting the Central Bank’s official interest rate for deposits from the annual inflation rate.
Source: China Statistical Yearbook, http://www.stats.gov.cn/english/statisticaldata/AnnualData (last visited 15 June 2015).
services expenditures will make up about 50 % of GDP after 2015 and slightly above 60 % by 2030. The 12th Five-Year Plan (2011-2015) envisaged an average GDP growth for 2011-2015 of 7 %, share of services in GDP to reach 43 %, and research and development expenditures at 2.2 % of the economy.23 According to the World Bank World Development Indicators Database, annual average growth rate for 2011-2013 was 8.2 %, the share of services in GDP in 2013 was 46 %, research and development expenditures amounted to 2.0 % of GDP in 2013. Based on the projections in the five-year plan and the actual realizations, there is a strong reason to believe that the World Bank’s projections in Table 2 may be realized. As economic development progresses, expenditures on services such as education, health, finance, transport, communication, and various other domestic services will naturally increase. productivity growth rate will surpass
economic growth rate after 2015. The meaning of labour productivity growth rates below economic growth rates before 2015 is declining share of labour in national income. Looking at the projections for the post-2015 period, it can safely be assumed that increasing labour productivity should affect real wage and household income positively. In this case, increasing purchasing power of households shall increase private consumption expenditures and their share in GDP. This is one of the top priorities of the Chinese government. The share of private consumption in GDP is projected to rise to over 60 % gradually after 2015, reaching about two thirds of GDP by 2030. This is yet a very ambitious target for the government. On the other hand, the projection for the share of services sector in total consumption to increase in the near future is a positive indicator in favour of this target. Table 2 reveals that
Table 2: Economic growth projections for China (1995-2030)
Unit: %
1995-2010 2011-2015 2016-2020 2021-2025 2026-2030
GDP growth rate 9.9 8.6 7.0 5.9 5.0
Growth rate of the labour force 0.9 0.3 -0.2 -0.2 -0.4
Growth rate of labour productivity 8.9 8.3 7.1 6.2 5.5
Investment to GDP ratio 49 42 38 36 34
Ratio of consumption expenditures in GDP 47 56 60 63 66
Ratio of the industrial sector in GDP 46.7 43.8 41.0 38.0 34.6
Ratio of the services sector in GDP 43.1 47.6 51.6 56.1 61.1
Note: The figures for 1995-2010 refer to actual data and the figures for 2011-2030 refer to projections. Source: The World Bank and Development Research Centre of the State Council, the People’s Republic of China, China 2030: Building a Modern, Harmonious, and Creative Society, 2013, p. 9.
overinvestment and excess capacity are big obstacles to economic growth. This issue has a political dimension as well because most of the largest industrial producers, for instance in the steel industry which is suffering from overcapacity, are linked to the local governments whose main objective is to increase industrial production although the National Development and Reform Commission has been trying to shut down inefficient industrial facilities.26
In the case of financing of the physical investments, it is necessary to evaluate the efficiency in the capital markets whose major function in a modern economy is to transfer loanable funds of savers to profitable investment projects. There is a large volume of research examining the causes and consequences of the inefficiencies and imperfectness of capital markets in China.27 Two of the commonly accepted policy recommendations to improve the efficiency in the financial markets in China are the removal of financial restraint policy adopted by the central government and taking necessary actions to deepen the capital markets, particularly via the provision of incentives to facilitate the diversification of financial assets that the savers can invest their funds in. The next section discusses the structure of the financial markets and their impact on economic growth in China.
Another important indicator to be evaluated carefully in Table 2 is the share of investments in national income. According to the projections, it is expected to decline to about 34 % by 2030. It is then safe to assume that the capital-output ratio will stay almost steady after some time. If the capital-output ratio stays unchanged, one can find, based on the analysis in the previous section, that investments will grow only at the same rate as the growth rate of the economy.24 This is a very important finding with strong policy implications. A short-cut interpretation in light of the expressions above, it is understood from an analysis of the projections that physical investments in the Chinese economy will attain a level of saturation. A natural consequence of this is excess capacity in certain industries such as steel.25 Investments will therefore have to fall in such industries unless demand increases, probably through exports to reduce the demand-supply gap. Yet,
It is understood from the
analysis of the projections that
physical investments in the
Chinese economy will attain a
level of saturation.
joint-stock banks) controlled about 83 % of commercial bank assets in the country.29 Foreign institutions were allowed only a negligibly small piece of the cake (2 percent of total assets). Loans extended by the banking system, which is dominated by public banks, amounted to about 55 % of the financial sector in 2014, and the shares of stocks traded and corporate and government bonds were about 26 and 19 %, respectively.30 In short, China has a bank-based financial system. Among the BRIC countries, which China can be compared with, this is peculiar only to China.31
In the rapidly growing Chinese economy, the financial system has been operating basically as follows: households deposit their savings in the banking system (mostly in public banks) whose interest rates are determined and kept artificially low by the central government, and the banking system directs these low-cost funds mostly to private firms and local governments as loans. In a sense,
Financial Sector and
Sustainability of Economic
Growth
From the beginning, the role of the financial system in China was to provide the funds needed for the large-scale industrial investments of public and private enterprises in accordance with the central government’s industrialization agenda.28 This is comparable with the role played by the financial systems in latecomer developmentalist or etatist economies in East Asia such as Japan and Korea. However, with the increasing share of China in the world economy, the financial system has evolved into a more market-oriented and competitive one. The financial system in China was able to provide these funds to investors at a relatively low cost. Investments financed this way were instrumental in rapid industrialization and sustaining rapid growth rates. On the other hand, as explained above, due to the expectations that China would follow a different growth path by adopting a different growth strategy and the growth rates would be fairly low, such changes should have important consequences for capital markets and trigger significant changes in the working and organization of these markets.
In 2010 the Chinese government directly (through public banks) and indirectly (through its shares in the
Chinese banks, like their
Japanese counterparts in the
past, are able to collect funds
from national savings easily and
at fairly low cost and there is an
argument that, similar to the
Japanese banks, these banks are
also weakly structured.
international standards such as Basel Accord capital adequacy criteria imposed on banks engaging in international capital transactions. Moreover, bold steps have also been taken to develop the securities markets in the country. The details of such developments in the financial markets can be found elsewhere.35 While these reforms aim at further financial deepening, their results are yet to be seen.
State control and repression of the financial sector is still continuing and is a matter of concern. The central government in China has naturally and reasonably deemed the financial sector an integral part of its growth and development strategy and is reluctant to leave it largely to market forces. The state-owned banks still control a large part of the banking sector and the economic decision-making process in these banks is based on bureaucratic and political criteria rather than commercial criteria. Many economists argue that the allocation of available funds in such a way leads to inefficient resource allocation in the economy.
this is reminiscent of Japanese private banks in their heydays during the high-growth era.32 The Ministry of Finance in Japan controlled private banks and forced them to direct the savings of households to large manufacturing firms and their subsidiaries under the ministry’s guidance. During the course of the liberalization of the banking system in Japan during and after the 1990s, the weak structure of these banks has become apparent.33 Chinese banks, like their Japanese counterparts in the past, are able to collect funds from national savings easily and at fairly low cost and there is an argument that, similar to the Japanese banks, these banks are also weakly structured. During rapid growth and in the absence of competition in the domestic financial system, common to both countries, these weaknesses are not visible or can be ignored.
The Chinese government seems to be aware of the weaknesses in the Chinese financial system and it has recently initiated reforms to restructure the finance sector, and the banking sector in particular.34 First, the restrictions on interest rates set by the government have recently been relaxed. Regulations in the financial sector have also been eased and entry into the financial sector has been made easier to enhance competition. In addition, due to the fact that the international transactions of Chinese banks have increased enormously over the last decade in particular, it was necessary for these banks to achieve
The central government in China
has naturally and reasonably
deemed the financial sector an
integral part of its growth and
development strategy and is
reluctant to leave it largely to
market forces.
Excessive dependence on banks for funds is generally regarded as risky because in the event of a banking crisis the repercussions on the real economy will be extremely harsh. As economic development progresses, the demand for services provided by non-bank financial institutions such as insurance companies, securities companies, pension funds, etc. are also expected to increase. Mainstream economists generally advise deepening the financial system by encouraging the development of non-bank financial markets such as bonds and financial derivative markets. Considering the excessive dependence of local governments on bank loans for investment expenditures and soft budget practices, there are concerns about the role banks play in the economy, which is normally expected to be monitoring of risk and channelling savings to profitable investment projects. For this to happen in China, it is essential to adopt free market principles. In the Third Plenary Meeting of the 18th Central Committee of the Communist Party of China, which
ended on 12 November 2013, the party decided to increase the role of the market and improve the working of the market mechanism in the economy.36 The World Bank argues in an official report that reform in the financial system in China is needed also because it is important to correct the imperfections in the financial sector along with the development of the real economy.37 It is implied that the imperfect capital market in China dominated by state-owned banks creates an idiosyncratic risk in itself and the costs arising from this risk may be larger than the benefits obtained from rapid growth and industrialization it facilitates. To put in other words, the weaknesses in the financial system may have been ignored, downgraded or even gone unnoticed.
The World Bank warns that if economic growth continues with the current state of the financial sector characterized by imperfections and risks without any reforms, domestic balances may be hurt severely.38 This may bear significant costs to the economy in the form of further worsening income inequalities, reduction in productivity, and worsening competitiveness. Therefore, it argues that China urgently needs to undertake financial sector reforms. Relating this with the need to transform long-run economic growth strategy to a productivity-based one with an emphasis on innovation and entrepreneurship, it is reasonable to believe that building a financial sector that rewards such economic activities may
Improvements in the financial
sector and diversification of
financial instruments are also
beneficial for savers whose
appetite is currently bound
by the low real interest rates
controlled by the central
government.
speed up this process. By doing so, efficient allocation of capital among economic activities may be facilitated. Besides, most economists believe that a financial system better capable of risk management in an economy may also stimulate further improvements in corporate governance in the real sector firms.
Improvements in the financial sector and diversification of financial instruments are also beneficial for savers whose appetite is currently bound by the low real interest rates controlled by the central government. No matter how much the volume of transactions in the Shanghai and Shenzhen stock exchange markets have expanded, their combined share in the capital market is merely a quarter. The low level of diversification of financial assets and low real interest rates may urge the owners of capital to invest in stocks and real estate with a speculative motive. As a matter of fact, there was a large speculative bubble in China from 2005 to 2007 and at a lower scale later during 2009- 2010. In the former bubble, average stock prices lost about 70 % of their value compared to the peak within only a year and a half.39 A similar movement also took place in housing and land prices though to a lesser degree. However, this reduction in prices was realized without a financial crisis, which implies that the central government has monitored and governed the process of bringing down these asset prices fairly well.40
American economists frequently pronounce their expectations of a sudden crisis for China.41 They emphasize the structural problems in the Chinese economy that would lead to unsustainability of economic growth and finally a financial crisis. However, it should be reminded that the majority of these economists’ descriptions of the mechanism towards a financial crisis are based on theoretical economic work, albeit some few studies look at it from a political economy viewpoint and specific circumstances peculiar to China.
Concluding Remarks and
Implications for Political
Economy and Global
Rebalancing
This article evaluates the economic growth performance of the Chinese economy. An important issue here is the political economy of growth. Some of the important economic decisions of the central government announced in the 3rd Plenary Session of the 18th National Congress of the Chinese Communist Party in November 2013 were about how to sustain economic growth. The central government announced its desire to reinforce the market mechanism and to deepen the financial market by diversification of financial assets. Even then, the traditionally pragmatic stance of the government can be observed from
advanced economies, which also demanded from China to take the necessary measures to reform its economy to remedy the negative impacts these imbalances impose. Nicholas Lardy points out that the transition from investment-led to consumption-led growth strategy in China will have an adverse effect on the financing of the US current account deficit. This is because the deficit was financed by capital inflows from China. Considering that the major cause of the US current account deficit is the low savings rate, it follows then that the US will have to increase its saving rate during China’s transition.44
The global imbalances and rebalancing them are important issues for future economic growth in China. As required by the global rebalance, China’s role in the global economy needs to emphasize consumption rather than investment. Part of the increasing consumption will be channelled to imports, which may reduce the economic growth rate and employment in China. While the need to shift to consumption-led growth is the market-enhancing steps, without
reducing the role of the state in the economic decision-making process, in measures introduced to improve property rights and relaxation of the one-child policy. Yet, the government’s strong hand in the financial sector, as evident from the large amounts of loans extended by the state-owned banks to state-owned enterprises and the resulting bad loans problem, as well as widespread corruption remain as major obstacles and limitations that the central government has to tackle.
An important aspect in conjunction with the global political economy is that national savings are larger than total investments in China because China is running a very large current account surplus by international standards. Excess savings are utilized by lending abroad, making China one of the top creditor countries. The top destination for lending is the US. This excess liquidity financed private consumption expenditures in the US especially before the financial crisis which broke out in 2007. Therefore, many American economists are inclined to blame China at least partially for the financial crisis.42 After the 2007-2008 global financial crisis, global imbalances have become more apparent. Large current account surpluses by China and Germany, in particular, against the US have become important political issues as well.43
China’s growth model based on investments was criticized by the
While a shift towards
consumption may ease the
pressure on world prices of raw
materials, there is still a need to
invest in infrastructure in the
urban areas in China.
in infrastructure in the urban areas in China. Therefore, the expected reduction in the share of investments in GDP may not come that easily. However, this might have a positive impact on developing countries exporting raw materials to China.47
The biggest impact on rebalancing China will be on East Asian economies. As Jörg Mayer puts it, these economies benefitted from their position in the global supply chains of American and Japanese multinational firms, especially in labour-intensive processes.48 Most of this output was exported to the industrial facilities of these foreign corporations in China. Rebalancing China will then affect these economies adversely as the demand for their products and services in the global supply chains will decline. Therefore, rebalancing may affect industrial development strategies in the region. In fact, the effects of rebalancing in East Asia became visible recently. The
Economist reported in 2014 that a
slow-down in investment resulted in lower exports of Asian countries to China especially of commodities and raw materials, as well as machines.49
admitted by the central government, the 12th Five-Year Plan (2011-2015) did not mention how to shift China’s growth pattern away from investments, how to liberalize financial markets, or how to shift China’s global trade balance.45
The rebalancing in the Chinese economy toward consumption-led growth comes with costs to pay. When production was destined to investments and export to foreign markets, there was no need for Chinese companies to pay higher wages to their workers, as domestic consumption was relatively unimportant for the growth of these firms’ sales. In the 12th Five-Year Plan, the government emphasized sustainable economic growth in the long run along with increase in the welfare of the citizens, which implicitly assumes an increase in incomes and wages as well as improvements in the “soft” aspects of economic development, such as health and education.46 Household incomes will have to increase along with the growing middle class, and the social safety system will need to be improved. In addition, the slowdown in the labour force as a result of China’s strict population policy may help increase wages in the country and impact private consumption positively.
Rebalancing China’s role this way will have global repercussions as well. While a shift towards consumption may ease the pressure on world prices of raw materials, there is still a need to invest
China is slightly losing its
comparative advantage in
labour-intensive industries as
the cost of labour has been rising
much faster than that of the
neighbouring Asian countries
in labour-intensive industries as the cost of labour has been rising much faster than that of the neighbouring Asian countries. While real wages increased by about 14 % during the 2008-2011 period, this was far more than those in Thailand and Malaysia (4 %), the Philippines (less than 1 %) and Indonesia (about 1 %).52
It seems that China will stay at the centre of discussions circumventing the global imbalances and how to achieve sustainable growth at the global scale. This will probably be the main issue to be discussed in the G-20 meetings in the coming years. As the English proverb goes, only time will tell.
There are opposing opinions about the future of China’s economic growth and its position in the global economy as well. Michael Pettis has foreseen that China’s investment boom is unsustainable and this would lead China to a long stagnation as happened in Japan after the burst of the bubble in 1991.50 In addition, while shifting from the old growth model to the new growth model, it is important to bear in mind the risk of a hard landing. This happens when the engines of growth are fading and there are no new ones to substitute them. Rafael Halpin warns of such signs from some provinces.51 In addition, China is slightly losing its comparative advantage
Endnotes
1 China 2030: Building a Modern, Harmonious, and Creative Society, The World Bank and Development Research Centre of the State Council, the People’s Republic of China, 2013, p. xxi.
2 “When Giants Slow Down”, The Economist, 27 July 2013.
3 For more details see K. C. Fung, Hitomi Iizaka and Sarah Y. Tong, “Foreign Direct Investment in China: Policy, Recent Trend and Impact”, Global Economic Review, Vol. 33, No. 2 (2004), pp. 99-130; Yingqi Wei and Xu Liu, “Productivity Spillovers from R&D, Exports and FDI in China’s Manufacturing Sector”, Journal of International Business Studies, Vol. 37, No. 4 (July 2006), pp. 544-557; Zhongxiu Zhao and Kevin Honglin Zhang, “FDI and Industrial Productivity in China: Evidence from Panel Data in 2001-06”, Review of Development
Economics, Vol. 14, No. 3 (August 2010), pp. 656–665.
4 China 2030: Building a Modern, Harmonious, and Creative Society. 5 “When Giants Slow Down”.
6 This is evident from major science and technology indicators. According to the latest available OECD official statistics, gross domestic expenditures on research and development in China has reached 2.02 % of GDP in 2012. Comparative data from OECD and UNESCO for other BRICs are as follows: 1.12 % in Russia (2012), 1.21 % in Brazil (2011), and 0.81 % in Brazil (2011). In addition, according to the official statistics by UNESCO, research and development personnel per 1000 total employment is higher in China than in other BRICs as well, excluding Russia: 2.84 in Brazil (2010), 4.23 in China (2012), 0.98 in India (2010), and 11.4 in Russia (2012). According to the World Bank’s World Development Indicators Database, the share of hi-tech products in total exports in China at 27 % in 2013 was at par with Korea (27 %) and France (26 %) and significantly higher than in Japan (17 %), the US (18 %), the UK (16 %), and Germany (16 %).
7 China economy: Quick View - Foreign investment surges, Economist Intelligence Unit, 19 April 2011, at http://country.eiu.com/article.aspx?articleid=1318016316&Country=China (last visited 24 June 2015).
8 Homi Karras and Geoffrey Gertz, “The New Global Middle Class: A Crossover from East to West”, in Cheng Li (ed.), China’s Emerging Middle Class: Beyond Economic Transformation, Washington D.C., Brooking Institution, 2010, Chapter 2.
9 Another way to ensure efficient allocation of productive resources in an economy is to direct resources (capital and labour) to flow to industries where the returns to these resources are higher. The standard economic theory suggests that the market should take on this responsibility. However, it is well known that in fast-growing East Asian economies including Japan, Korea, Singapore, and Taiwan, governments intervened in markets to ensure resource allocation in accordance with the governments’ industrialisation programs. Resource allocation in either way can be expected to yield an additional source of productivity growth,
named “structural bonus”. Mainstream economists generally ignore this source of economic growth. For an application of this idea to East Asian economies see, K. Ali Akkemik, “Structural Change and Its Impact on Productivity in Japan, Korea, and Singapore (1970-2000)”, Forum of International Development Studies, Vol. 28 (March 2005), pp. 35-53. 10 In the case of Korea, high enrolment rates and rapid accumulation of human capital and their
contribution to rapid growth can be traced in the World Bank’s report titled The East Asian
Miracle: Economic Growth and Public Policy, New York, Oxford University Press, pp. 43-46,
and 192-203. In the case of China, Whalley and Zhao found that expansion in education and human capital accumulation account for about 38 % of rapid growth in China over the period 1978-2008. See John Whalley and Xiliang Zhao, “The Contribution of Human Capital to China’s Economic Growth”, China Economic Policy Review, Vol. 2, No. 1 (2013), 1350001.
11 See, Joseph Casey and Katherine Koleski, Backgrounder: China’s 12th Five-Year Plan, US- China Economic and Security Review Commission, 2011.
12 Xinhua News Agency, “China holds meeting on 13th Five-Year Plan”, 5 September 2014, at http://news.xinhuanet.com/english/china/2014-09/05/c_133621684.htm (last visited 24 June 2015).
13 Juro Osawa and Paul Mozur, “The Rise of China’s Innovation Machine”, Wall Street Journal, 16 January 2014; see also, George Yip and Bruce McKern, “The ‘Three Phases’ Of Chinese Innovation”, Forbes, 23 March 2015; Regina M. Abrami, William C. Kirby and F. Warren McFarlan, “Why China Can’t Innovate”, Harvard Business Review, Vol. 92, No. 3 (March 2014), pp. 107-111.
14 Suqin Ge and Dennis Tao Yang, “Changes in China’s Wage Structure”, Institute for the Study
of Labor (IZA), Discussion Paper No. 6492 (2012); Dennis Tao Yang, “Aggregate Savings and
External Imbalances in China”, Journal of Economic Perspectives, Vol. 26, No. 4, (Fall 2012), pp. 125-146.
15 James R. Barth, Michael Lea and Tong Li, “China’s Housing Market: Is a Bubble About to Burst?”, Milken Institute, October 2012.
16 See, Xinhua, “China lowers down payment requirement for second homes”, at http://news. xinhuanet.com/english/china/2014-09/30/c_133685855.htm (last visited 24 June 2015). 17 For details, see Kazuo Sato, “Saving and Investment”, in Kozo Yamamura and Yasukichi
Yasuba (eds.), The Political Economy of Japan, Vol. 1: The Domestic Transformation, Stanford University Press, 1987.
18 Ibid; The equation is as follows: Here, refers to investment in physical capital, refers to output (GDP), refers to net capital stock, and refers to the rate of capital consumption (depreciation rate). is a mathematical operator showing change. This equation implies that investment to GDP ratio of the left hand side of the equation is made up of two components on the right hand side. The first component is the change in the capital-output ratio. That is to say, if capital stock, K, is expanding faster than GDP (Y) this means that investments are also
expanding faster than output, hence the investment-GDP ratio gets larger in value. The second component is the capital-output ratio multiplied by the sum of the depreciation rate and the efficiency of capital. Part of the investment is made to compensate for the wearing off of the existing capital stock. The term implies the efficiency of capital because it is defined as the increase in GDP divided by the capital stock.
19 Further calculations yield that the first term averaged minus 5.2 % for 1986-1995, but turned positive afterwards, averaging 4.3 % for 1996-2005 and 4.9 % for 2006-2011. On the other hand, the major source of the increase in ratio was the second component, thanks to the rising ratio, which averaged 33.3, 29.4, and 40.3 % for the periods, 1986-1995, 1996-2005, and 2006-2011, respectively.
20 A contrary view was expressed by Xiaodong Zhu who offers a critical perspective in this regard. See Xiaodong Zhu, “Understanding China’s Growth: Past, Present, and Future”,
Journal of Economic Perspectives, Vol. 26, No. 4 (Fall 2012), pp. 103-124. According to Zhu,
productivity growth rate has increased in China and investments follow economic growth. Therefore, as opposed to the argument that economy grows because of large investments, the causal relationship may work the other way around.
21 See, Zhang Monan, “Financial System Reform”, China Daily, at http://www.chinadaily.com. cn/business/2013-11/04/content_17079140.htm (last visited 24 June 2015).
22 Ibid.
23 The official document for the 12th Five Year Plan is available online at http://www.npc.gov. cn/npc/dbdhhy/11_4/2011-03/16/content_1647644.htm (last visited 24 June 2015). 24 This is because economic growth in the previous analysis will be equal to the term.
25 According to the IMF’s official statistics, industrial capacity utilization rate in China has decreased from about 80 % in 2007 to about 60 % in 2011, and still below 70 % in 2014. See Lingling Wei and Bob Davis, “In China, Beijing Fights Losing Battle to Rein In Factory Production”, Wall Street Journal, 16 July 2014.
26 Mark Deweaver’s article titled “China’s Excess-Capacity Nightmare”, at http://www.project-syndicate.org/commentary/china-s-excess-capacity-nightmare (last visited 24 June 2015). 27 See for instance, “China’s Stockmarkets: Imperfect Markets”, The Economist, 5 October 2006;
Kam C. Chan, Hung-gay Fung and Qingfeng ‘Wilson’ Liu (eds.), China’s Capital Markets:
Challenges from WTO Membership, Cheltenham, UK: Edward Elgar (2007); Salih N. Neftci
and Michelle Yuan Menager-Xu, China’s Financial Markets: An Insider’s Guide to How the
Markets Work, Elsevier (2007).
28 China 2030.
29 World Bank, Financial Sector Assessment Program (FSAP), China – Financial Sector
Assessment, Report No. SecM2011-0492, November 2011.
30 These shares are calculated using the reported data in People’s Bank of China, China Monetary
31 This is evident from banks’ share in total private sector lending. While this ratio was between 30-40 % in the other BRICs, it was more than 60 % in China during the period 2000-2011. See Leonardo Gambacorta, Jing Yang, and Kostas Tsatsaronis, “Financial Structure and Growth”, BIS Quarterly Review, (March 2014), pp. 21-35.
32 K. Ali Akkemik, “Japonya (1991) ve ABD (2007-2009) Finans Krizlerinin Politik İktisat Perspektifinden Bir Değerlendirmesi”, Doğuş Journal, Vol. 12, No. 2 (July 2011), pp. 171-186.
33 Ibid.
34 China 2030; For a critical analysis of financial sector in China, see also Jia Li, “China’s Financial Market Fragmentation, 1978-2004”, Forum of International Development Studies, Vol. 32 (December 2006), pp. 115-135.
35 See, Yasheng Huang, “How Did China Take Off?”, Journal of Economic Perspectives, Vol. 26, No. 4 (Fall 2012), pp. 147-170; Dennis Tao Yang, “Aggregate Savings and External Imbalances in China”, Journal of Economic Perspectives, Vol. 26, No. 4 (Fall 2012), pp. 125-146.
36 See Xinhua news report for the 18th National Congress, available online: http://www.
xinhuanet.com/english/special/18cpcnc/index.htm (last visited 24 June 2015). 37 China 2030.
38 Ibid.
39 K. Ali Akkemik, “Çin’de Hızlı Büyüme ve Balon Etkisi”, Hazar Raporu, Vol. 4 (June 2013), p. 72.
40 It is helpful to compare with the bitter experience of Japan, where a bubble in asset prices grew in the second half of the 1980s and burst in 1991, leading the country to a “Lost Decade” in the 1990s. Whether there is a bubble economy in China is an interesting question but beyond the scope of this article. For a critical discussion in Turkish, see K. Ali Akkemik, “Çin’de Bir Finans Krizi Beklemeli Miyiz? – Japonya’dan Alınacak Dersler”, in K. Ali Akkemik, Sadık Ünay (eds.), Doğu Asya’nın Politik Ekonomisi: Japonya, Çin ve Güney Kore’de Kalkınma, Siyaset
ve Jeostrateji, Istanbul: Boğaziçi University Press (2015), pp. 282-322.
41 Paul Krugman, “Will China Break?” New York Times, 18 December 2011.
42 See, for instance, Maurice Obstfeld and Kenneth Rogoff, “Global Imbalances and the Financial Crisis: Products of Common Causes”, CEPR Discussion Papers 7606 (2009); “Bernanke says Foreign Investors Fuelled Crisis”, Financial Times, 18 February 2011; James A. Dorn, “The Role of China in the U.S. Debt Crisis”, Cato Journal, Vol. 33, No. 1 (Winter 2013), pp. 77-89.
43 Jörg Mayer draws attention to the similarities between Japan in the 1980s and China recently in their experiences with trade frictions with the US. In the 1980s the US was blaming Japan for undervaluing the yen and implementing neo-mercantilist policies. However, he argues further that there is a stark difference between the two countries. China is much
poorer than Japan in the 1980s and there are more opportunities for long-term economic development. In other words, China’s backwardness may work for the benefit of the country when its economy ails as the Japanese economy stagnated after the 1990s when most of the opportunities for economic growth had been obsolete. See Jörg Mayer, “Global Rebalancing: Effects on Trade Flows and Employment”, UNCTAD, Discussion Paper No. 200, September 2010.
44 Nicholas Lardy, Sustaining China’s Economic Growth after the Global Financial Crisis, Peterson Institute for International Economics, 2012.
45 See Joseph Casey and Katherine Koleski, Backgrounder: China’s 12th Five-Year Plan, US-China Economic and Security Review Commission, 2011.
46 Ibid.
47 Jörg Mayer, “Global Rebalancing: Effects on Trade Flows and Employment”, UNCTAD, Discussion Paper No. 200, September 2010.
48 Ibid.
49 “Winners and losers in the great Chinese rebalancing”, The Economist, 26 July 2014. 50 See, Michael Pettis, The Great Rebalancing: Trade, Conflict, and the Perilous Road Ahead for the
World Economy, Princeton, Princeton University Press, 2013.
51 Rafael Halpin, “China’s rebalancing challenge”, Financial Times, May 22, 2015.