The link between intuitive thinking and social conservatism is stronger
in WEIRD societies
Onurcan Yilmaz
∗Sinan Alper
†Abstract
While previous studies reveal mixed findings on the relationship between analytic cognitive style (ACS) and right-wing (conservative) political orientation, the correlation is generally negative. However, most of these studies are based on Western, educated, industrialized, rich, and democratic (WEIRD) societies, and it is not clear whether this relationship is a cross-culturally stable phenomenon. In order to test cross-cultural generalizability of this finding, we re-analyzed the data collected by the Many Labs 2 Project from 30 politically diverse societies (N = 7,263). Social conservatism is measured with the binding foundations scale, comprising of loyalty (patriotism), authority (respect for traditions), and sanctity (respect for the sacred), as proposed by the moral foundations theory, while ACS is measured by the three-item modified cognitive reflection task. The level of WEIRDness of each country was calculated by scoring how much a culture is Western, educated, industrialized, rich, and democratic. Although social conservatism is negatively associated with ACS in the aggregate, analysis indicates that the relationship is significantly stronger among WEIRD and remains negligible among non-WEIRD cultures. These findings show the cross-cultural variability of this relationship and emphasize the limitations of studying only WEIRD cultures.
Keywords: analytic cognitive style, cognitive reflection test, social conservatism, ideology, liberalism, WEIRD, cross-cultural stability, moral foundations
1
Introduction
Are analytical thinkers less likely to be conservative across the globe? To answer this question, a series of recent stud-ies conducted in different cultures have examined whether there is a difference in cognitive style (analytic vs. intu-itive) between left and right-wing ideologies (Brandt, Evans & Crawford, 2015; Deppe et al., 2015; Eidelman, Cran-dall, Goodman, & Blanchar, 2012; Iyer, Koleva, Graham, Ditto & Haidt, 2012; Jost, Sterling & Stern, 2018; Ka-han, 2013; Landy, 2016; Piazza & Sousa, 2014; cook, Cheyne, Seli, Koehler & Fugelsang, 2012; Penny-cook, Cheyne, Barr, Koehler & Fugelsang, 2014; Saribay & Yilmaz, 2017; Sterling, Jost, & Pennycook, 2016; Talhelm, et al., 2015; Talhelm, 2018; Van Berkel, Crandall, Eidel-man & Blanchar, 2015; Yilmaz & Saribay, 2016, 2017a, 2017b, 2017c, 2018a).1 While some studies found a
nega-We thank the Many Labs 2 Project for sharing their dataset, and Ozan Isler, Jonathan Baron, Gordon Pennycook, and Thomas Talhelm for helpful comments on the earlier versions of the manuscript. All materials and data are available at https://osf.io/8cd4r/.
Copyright: © 2019. The authors license this article under the terms of the Creative Commons Attribution 3.0 License.
∗Department of Psychology, Doğuş University, 34722, Acıbadem,
Is-tanbul. Email: [email protected].
†Department of Psychology, Yasar University, Izmir, Turkey.
1We use the distinction between analytic and intuitive thought processes from the perspective of the dual-process model in this article. Analytic thought is cognitively more effortful whereas intuitive thought is effortless. Although the distinction between analytic and holistic thought processes in cultural psychology seems similar to ours (e.g., Talhelm et al., 2015), both
tive relationship between a performance measure of analyt-ical cognitive style (ACS) as represented by the Cognitive Reflection Test (CRT; Frederick, 2005) and a single item po-litical orientation question (ranging from extremely liberal to extremely conservative; Deppe et al., 2015; Pennycook et al., 2012; Iyer et al., 2012; Talhelm et al., 2015; Yilmaz & Saribay, 2016), others failed to find any relationship (Ka-han, 2013; Landy, 2016; Piazza & Sousa, 2014; Yilmaz & Saribay, 2017c). The mixed findings in the literature raise the question whether this relationship is stable across cul-tures. In particular, although the ACS and ideology link is generally stable in Western samples (Jost et al., 2018), the findings regarding this relationship are not always consistent in non-Western cultures (e.g., Bahçekapili & Yilmaz, 2017; Yilmaz & Saribay, 2018a). Consistent with these correla-tional studies, experimental research also produced mixed findings: Eidelman et al. (2012) — with very low sample sizes — showed that the activation of intuitive thinking leads to conservatism in three different experiments in WEIRD samples (i.e., the US). However, two of these studies could not be replicated in non-WEIRD samples (i.e., Turkey) in high-powered attempts (Yilmaz & Saribay, 2016, 2018b). We argue that the link between cognitive style and social conservatism may be cross-culturally variable, which would explain at least some of the mixed findings in the literature. Therefore, relying on data from 30 politically diverse
so-analytic and holistic thinking in this sense could be either effortful or effort-less, thus that distinction differs from our conceptualization (see Butchel & Norenzayan, 2009; Yilmaz & Saribay, 2017, for further discussions).
cieties, this study provides a test whether the link between ACS and ideology is a cross-culturally stable phenomenon.
1.1
Toward a Cross-Culturally Valid Measure
of Political Orientation
Although the single item political orientation question was previously considered a reliable method for measuring ideol-ogy (Jost, 2006), Iyer et al. (2012) emphasized the confound-ing role of libertarians. Liberterians place themselves on the conservative side of the left-right (or liberal-conservative) spectrum when one-item political orientation question is used. At the same time, the libertarians have higher ACS scores than liberals and conservatives. Therefore, the one-item political orientation question has important limitations, and cannot be reliably used in cross-cultural research to in-vestigate the link between ACS and ideology.
In other studies, the two dimensions of conservative ide-ology, namely social and economic conservatism, were mea-sured separately to overcome the limitations of the one-item measure. Jost et al. (2018), for example, conducted a meta-analysis and found that ACS (as measured by CRT) is corre-lated with social conservatism (r =−.15) and that the correla-tion between ACS and economic conservatism is weaker (r = −.08). The same moderating effect was evidenced in subse-quent studies using different measures of ACS and ideology on American participants (Yilmaz & Saribay, 2017c).
However, it is not clear whether the categories of so-cial and economic conservatism provide a valid and useful distinction outside of the United States. The conservatism-as-motivated-socicognition approach provides a better al-ternative to measuring ideology based on culture-free char-acteristics of the ideology (Jost, Glaser, Kruglanski & Sul-loway, 2003). This approach defines ideology as comprised of two relatively independent motives: Resistance to change and opposition to equality, corresponding to social and eco-nomic conservatism in the US political context. These mo-tives behind political conservatism are thought to be a de-fensive reaction, and serve to reduce the tension created by uncertainty and existential threat. CRT showed a signifi-cant negative relationship with only one of those motives, resistance to change, whereas it did not show any significant relationship with opposition to equality (Yilmaz & Saribay, 2018a). Therefore, measuring ideology by focusing on re-sistance to change rather than the one-item general or social conservatism questions can be a more insightful and cross-culturally appropriate approach for testing whether the rela-tionship between ACS and ideological orientation is cross-culturally stable.
Jost et al. (2003) argue that these two motives are univer-sal. However, there are reasons to question whether ACS is related only to social conservatism (among other ideol-ogy measures), and whether this relationship holds cross-culturally. Although Yilmaz and Saribay (2017a, 2017b)
found a causal effect of ACS on ideology, this finding does not directly correspond to the distinction between social and economic conservatism. In Yilmaz and Saribay’s (2017b) study conducted in Turkey, binding moral foundations, which is a measure of social conservatism, were not related to CRT, although they were found to be related in American samples (Landy, 2016; Pennycook et al., 2014). Besides, most re-search on this link has been conducted among American participants (see Jost et al., 2018), although there are some exceptions (e.g., Yilmaz & Saribay, 2016). Therefore, there is a need for further cross-cultural investigation of this issue.
1.2
The Present Research
We argue that these mixed findings might be partially ex-plained by cross-cultural differences across the samples. In order to categorize countries in terms of cultural differences, Henrich, Heine and Norenzayan (2010) proposed the concept of WEIRD, which stands for Western, educated, industrial-ized, rich, and democratic societies. They claim that the samples commonly used in psychology studies are mainly from WEIRD cultures, which represent only 15% of the world population; and thus the samples in most psychology studies are biased and not representative of the majority of the world population which is predominantly non-WEIRD. Although Gervais et al. (2018) did not directly test the mod-erating role of cultural WEIRDness, they recently found a cross-cultural variability on the relationship between ACS (as measured by CRT) and religious belief (as measured by one item religious belief question), a related concept to so-cial conservatism. This suggests that the WEIRDness of the culture might have a moderating role in the relationship between ACS and social conservatism.
In this study, we evaluate whether the relationship between social conservatism and ACS is cross-culturally stable using the large cross-cultural dataset of the Many Labs 2 Project (Klein et al., 2018), and we investigate the moderating role of the WEIRDness of the culture. We use the binding subscale of the Moral Foundations Questionnaire developed by Gra-ham et al. (2011) in order to measure social conservatism. This questionnaire was previously validated in several coun-tries including WEIRD (e.g., Davies, Sibley & Liu, 2014; Métayer & Pahlavan, 2014; Nilsson & Erlandsson, 2015) and non-WEIRD cultures (Berni¯unas, Dranseika & Sousa, 2016; Yilmaz, Harma, Bahçekapili & Cesur, 2016a; Zhang & Li, 2015). Binding foundations are comprised of patrio-tism (loyalty), respect for traditions (authority), and respect for the sacred (sanctity), and thus it is actually a repackaging of the previous literature on social conservatism (Federico, Weber, Ergun & Hunt, 2013; Jost, 2012; Kugler, Jost & Noorbaloochi, 2014; Milojev et al., 2014; Sinn & Hayes, 2016). In other words, while the individualizing founda-tions (corresponding to care and fairness) negatively relates to opposition to equality, binding foundations correspond to
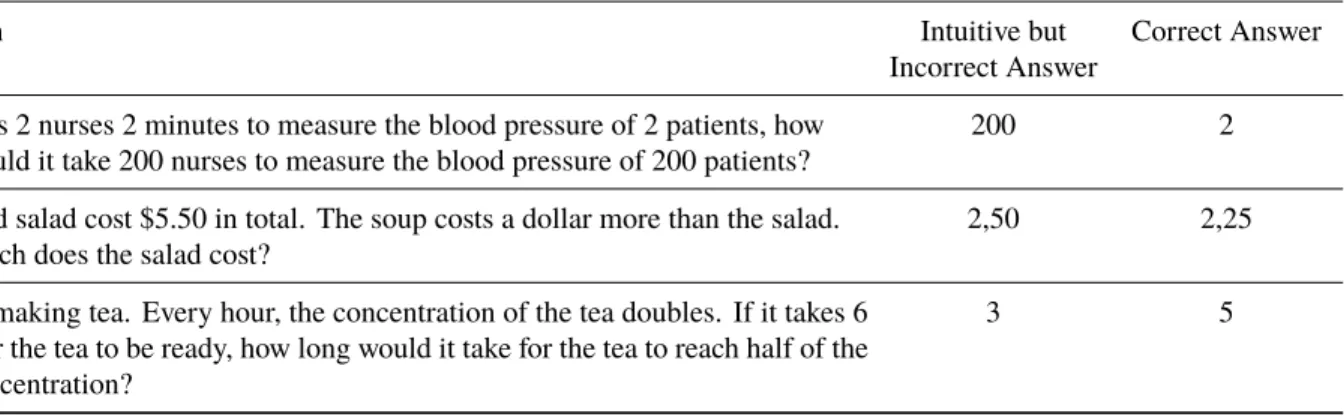
Table 1: List of CRT questions used in the current research.
Question Intuitive but
Incorrect Answer
Correct Answer If it takes 2 nurses 2 minutes to measure the blood pressure of 2 patients, how
long would it take 200 nurses to measure the blood pressure of 200 patients?
200 2
Soup and salad cost $5.50 in total. The soup costs a dollar more than the salad. How much does the salad cost?
2,50 2,25
Sally is making tea. Every hour, the concentration of the tea doubles. If it takes 6 hours for the tea to be ready, how long would it take for the tea to reach half of the final concentration?
3 5
resistance to change (i.e., social conservatism; Sinn & Hayes, 2016). In different studies conducted with American (Kugler et al., 2014) and Swedish (Nilsson & Erlandsson, 2015) par-ticipants, the relationship between the binding foundations and right-wing political orientation is largely explained by variation in resistance to change (i.e., social conservatism). In addition, Sinn and Hayes (2016) demonstrated in a factor analysis study that binding foundations correspond to resis-tance to change. More importantly, although the concept of social conservatism can have different meanings in different cultures, binding foundations represent an overall adherence to traditional moral values, which is likely to be an impor-tant indicator of social conservatism across different cultures (Graham et al., 2011). Therefore, in order to operational-ize social conservatism in a cross-cultural study, we used the binding foundations measures for 30 politically diverse cultures. These cultures include relatively non-WEIRD cul-tures such as Brazil, China, Turkey, and India, and relatively WEIRD cultures such as Canada, Switzerland, France, and Austria. Overall, we aim to determine the direction and the magnitude of the relationship between ACS and social conservatism across WEIRD and non-WEIRD cultures.
2
Method
2.1
Participants
We retrieved the data from Many Labs 2 Project (Klein et al., 2018), a replication project with a total sample of 15,305 participants from 36 countries. The original research con-sisted of two groups of studies called “slates”. The cognitive Reflection Test (CRT) was administered in both slates but the Moral Foundations Questionnaire and the one-item ideology measure were administered only in Slate 1. We hence only analyzed the data of Slate 1, which included 7,263 partici-pants from 30 countries.
2.2
Measures
Cognitive reflection test. The cognitive reflection test (CRT; Frederick, 2005) consists of three mathematical ques-tions. There are intuitive but incorrect answers to these questions. If one can suppress the intuitive answer and give the correct answer, this is considered an indicator of an-alytic thinking (e.g., Stagnaro, Pennycook & Rand, 2018; Meyer, Zhou & Frederick, 2018). Many Labs 2 Project included three CRT questions (Finucane & Gullion, 2010; see Table 1). We first cleaned the data by deleting any non-text characters in participants’ responses. For example, some participants responded as “2 minutes” or “$5”; in such cases, we deleted “minutes” and “$” to make these variables available for statistical analyses. We also removed invalid or meaningless responses (e.g., “I don’t care”). Then we coded incorrect responses as 0 and correct responses as 1. Lastly, we created an index score by summing up scores for these three questions which resulted in a potential range from 0 to 3. Higher scores indicate more analytic thinking. The Cronbach’s alpha score for correct responses to these three items was .610.
Moral foundations questionnaire. We measured social conservatism based on scores on binding moral foundations. Moral foundations questionnaire (Graham et al., 2011) em-ployed in Many Labs 2 included three items for each of the five moral foundations (care, fairness, loyalty, authority, and sanctity). Individualizing foundations consist of care and fairness whereas binding foundations consist of loyalty, au-thority, and sanctity. Both individualizing (α = .822) and binding foundations (α = .777) subscales had sufficient reli-ability. We report the results regarding both individualizing and binding foundations, but we did not have any a priori hypothesis on the relation between CRT and individualizing foundations.
WEIRDness. In Many Labs 2 (Klein et al., 2018), the level of WEIRDness of each country was quantified by scoring
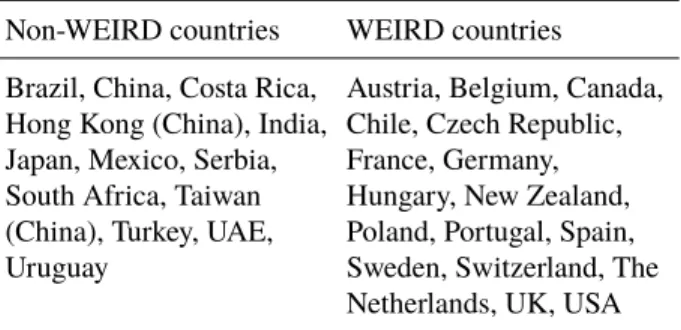
Table 2:List of Non-WEIRD and WEIRD countries included
in the sample (in alphabetical order).
Non-WEIRD countries WEIRD countries Brazil, China, Costa Rica,
Hong Kong (China), India, Japan, Mexico, Serbia, South Africa, Taiwan (China), Turkey, UAE, Uruguay
Austria, Belgium, Canada, Chile, Czech Republic, France, Germany, Hungary, New Zealand, Poland, Portugal, Spain, Sweden, Switzerland, The Netherlands, UK, USA Note. These countries were included in Slate 1 of Many Labs 2 Project. The second question was revised for certain cultures by using different currencies and amounts of money, although the required type of cal-culation was essentially the same. The expected correct answers for each country are listed in the Appendix.
each of the components of WEIRD, namely Western (West-ern countries were rated as 1 whereas the others were rated as 0), Educated (rated based on the Education Index retrieved from the United Nations), Industrialized (rated based on the Industrial Development Report of the United Nations), Rich (developed countries were rated as 1 whereas the emerging economies were rated as 0), Democratic (democratization scores were retrieved from the Global Democracy Ranking) (Klein et al., 2018; more detailed information is available at https://osf.io/b7qrt/). Thus they created a continuous scale for the level of WEIRDness of each nation. They also split the countries into two categories: Those who had higher than average WEIRDness scores were labeled as WEIRD samples whereas those with lower than average scores were labeled as non-WEIRD (Table 2).
Ideology. Ideology was assessed using a single item “Please rate your political ideology on the following scale” (1 = strongly left-wing, 7 = strongly right-wing).
We also considered using other measures to tap into the level of WEIRDness of countries. Muthukrishna et al. (2018) recently developed a scale to measure countries’ cultural distance to the United States (WEIRD scale) and China (Sino scale). However, we decided to base our analyses on the WEIRDness measurement employed by Many Labs 2 for two reasons: First, both WEIRD (r = −.739, p < .001) and Sino scales (r = .717, p < .001) were very strongly correlated with the WEIRDness measure in Many Labs 2. We reasoned that these different scales are tapping into the same construct. Second, Muthukrishna et al.’s (2018) study does not provide scores for six countries included in the current research (Costa Rica, United Arab Emirates, Czech Republic, Belgium, Portugal, and Austria).
3
Results
We conducted meta-analyses to examine (1) the overall ef-fect of CRT on ideology, binding, and individualizing foun-dations, (2) and whether the level of WEIRDness accounts for the differences between countries. We used the meta-analysis function in JASP software (JASP Team, 2018) which is based on metafor, a meta-analysis package for R (Viecht-baur, 2010). We have utilized a fixed-effects method with moderators for the meta-analyses by restricting our infer-ences regarding the results to the countries included in the dataset (see Viechtbauer, 2010, for detailed discussion on the different types of meta-analyses). However, the Appendix reports analyses with a random-effects method (for foun-dations), which permits generalization to the population of countries (and yields weaker results consistent with the con-clusions reported in the main text), and a restricted maximum likelihood method (with fixed effects). These Appendix also includes bivariate correlation tables.
3.1
The Effect on Ideology
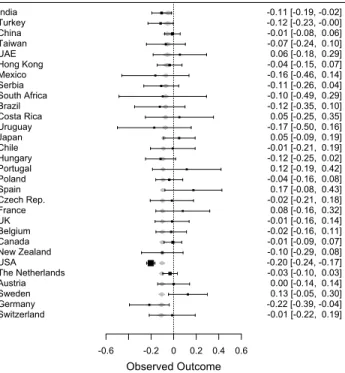
The combined meta-analytic effect was statistically signifi-cant (b =−.051, SE = .018, z = −2.813, p = .005, 95% CI [−.086, −.015]). When continuous WEIRDness score was added to the model as a covariate, neither the intercept (b = .002, SE = .053, z = .045, p = .964, 95% CI [−.101, .134]), nor WEIRDness as a covariate had a significant effect (b = −.079, SE = .074, z = −1.079, p = .281, 95% CI [−.224, .065]). So, CRT was negatively related to right-wing ide-ology and WEIRDness did not moderate this effect (Figure 1). However, when a restricted maximum likelihood method was used, the meta-analytic effect of CRT did not reach to statistical significance (see the Appendix).
Lastly, we investigated which component of WEIRDness has stronger moderating effects. In Many Labs 2 (Klein et al., 2018), separate scores for each of the five components of WEIRDness (Western, educated, industrialized, rich, and democratic) were provided. Instead of the mean WEIRD-ness score, we added these covariates to the model. Only education had a significant moderation effect (Table 3). Ac-cordingly, CRT had a stronger effect on having a right-wing ideology in countries with better education.
3.2
The Effect on Binding Moral Foundations
The combined effect was significant (b =−.102, SE = .010, z =−9.769, p < .001, 95% CI [−.123, -.082], and suggested that higher scores in CRT were associated with lower levels of endorsement of binding moral foundations. Then, we added continuous WEIRDness score as a covariate to the model. The coefficient of the intercept was significant (b = .096,
SE= .035, z = 2.730, p = .006, 95% CI [.027, .165]) and
-2 -1.5 -1 -0.5 0 0.5 1 Observed Outcome Switzerland Germany Sweden Austria The Netherlands USA New Zealand Canada Belgium UK France Czech Rep. Spain Poland Portugal Hungary Chile Japan Uruguay Costa Rica Brazil South Africa Serbia Mexico Hong Kong UAE Taiwan China Turkey India -0.08 [-0.39, 0.24] -0.15 [-0.38, 0.09] 0.49 [ 0.12, 0.86] 0.08 [-0.09, 0.26] -0.06 [-0.18, 0.06] -0.14 [-0.21, -0.07] -0.29 [-0.63, 0.04] -0.02 [-0.12, 0.08] -0.23 [-0.50, 0.04] 0.22 [-0.04, 0.49] 0.01 [-0.43, 0.46] -0.07 [-0.38, 0.24] -0.57 [-0.93, -0.21] 0.17 [-0.07, 0.41] 0.32 [-0.18, 0.82] -0.10 [-0.33, 0.13] -0.13 [-0.51, 0.24] 0.25 [ 0.03, 0.47] -0.45 [-1.23, 0.32] 0.03 [-0.51, 0.58] 0.09 [-0.30, 0.48] -0.86 [-1.61, -0.12] -0.07 [-0.34, 0.20] 0.04 [-0.39, 0.47] -0.06 [-0.25, 0.14] 0.03 [-0.40, 0.46] -0.18 [-0.42, 0.06] 0.02 [-0.09, 0.14] -0.09 [-0.27, 0.09] 0.00 [-0.14, 0.15]
Figure 1: The distribution of unstandardized regression
coefficients predicting ideology from CRT. Whiskers repre-sent 95% confidence intervals for the coefficients. Grey di-amonds represent the predictions from the level of WEIRD-ness. Countries are ranked based on their mean WEIRDness scores with India being the least WEIRD and Switzerland be-ing the most WEIRD nation.
Table 3: Estimates for the Effect of Different Components of WEIRDness on Ideology. b SE z p 95% CI Intercept 0.270 0.247 1.094 0.274 −0.214: 0.754 Western −0.100 0.075 −1.343 0.180 −0.247: 0.046 Educated −0.787 0.360 −2.189 0.029 −1.492:−0.082 Industrial 0.074 0.124 0.599 0.549 −0.169: 0.318 Rich 0.181 0.099 1.830 0.069 −0.014: 0.375 Democratic 0.291 0.316 0.920 0.358 −0.329: 0.910
for different countries (b =−.279, SE = .047, z = -5.889,
p< .001, 95% CI [−.371, −.186]). Accordingly, CRT had a stronger negative effect on binding moral foundations in more WEIRD cultures (see Figure 2). When a restricted maximum likelihood model was used, similar findings were obtained except for that the moderation effect of WEIRDness was marginally significant (p = .053; see the Appendix).
We also conducted separate analyses for non-WEIRD and WEIRD countries (see Table 1 for the list of countries in each group). The meta-analytic estimate of the overall effect size was statistically significant for WEIRD countries(b =
-0.8 -0.4 0 0.2 0.4 Observed Outcome Switzerland Germany Sweden Austria The Netherlands USA New Zealand Canada Belgium UK France Czech Rep. Spain Poland Portugal Hungary Chile Japan Uruguay Costa Rica Brazil South Africa Serbia Mexico Hong Kong UAE Taiwan China Turkey India 0.02 [-0.16, 0.20] -0.19 [-0.39, 0.01] 0.04 [-0.13, 0.21] 0.03 [-0.10, 0.17] -0.08 [-0.14, -0.03] -0.21 [-0.24, -0.17] -0.09 [-0.28, 0.11] -0.07 [-0.15, 0.00] -0.17 [-0.32, -0.03] -0.14 [-0.30, 0.02] 0.11 [-0.14, 0.37] -0.07 [-0.24, 0.10] 0.03 [-0.22, 0.27] -0.11 [-0.22, -0.00] 0.05 [-0.26, 0.36] -0.18 [-0.29, -0.07] -0.04 [-0.23, 0.15] 0.01 [-0.15, 0.17] -0.05 [-0.37, 0.27] -0.04 [-0.35, 0.27] -0.17 [-0.39, 0.05] -0.27 [-0.62, 0.08] -0.10 [-0.28, 0.07] -0.00 [-0.28, 0.27] 0.02 [-0.10, 0.14] 0.02 [-0.24, 0.28] -0.21 [-0.37, -0.04] 0.10 [ 0.02, 0.18] 0.00 [-0.11, 0.11] 0.04 [-0.07, 0.15]
Figure 2: The distribution of unstandardized regression
coefficients predicting binding moral foundations from CRT. Whiskers represent 95% confidence intervals for the coef-ficients. Grey diamonds represent the predictions from the level of WEIRDness. Countries are ranked based on their mean WEIRDness scores with India being the least WEIRD and Switzerland being the most WEIRD nation.
Table 4: Estimates for the effect of different components of WEIRDness on binding foundations.
b SE z p 95% CI Intercept 0.125 0.161 0.777 0.437 −0.190: 0.441 Western −0.080 0.047 −1.706 0.088 −0.172: 0.012 Educated −0.769 0.233 −3.302 <.001 −1.225:−0.312 Industrial 0.037 0.071 0.518 0.605 −0.102: 0.176 Rich 0.016 0.058 0.278 0.781 −0.097: 0.130 Democratic 0.576 0.189 3.049 0.002 0.206: 0.946 −.136, SE = .012, z = −11.352, p < .001, 95% CI [−.159, −.112]), but not for the non-WEIRD ones (b = .006, SE = .021, z = .278, p = .781, 95% CI [−.036, .048]). So, the negative relationship between CRT and binding foundations was unique to more WEIRD contexts.
Lastly, we added five components of WEIRDness as co-variate to the model, instead of mean WEIRDness score. Only education and democracy components had significant effects (Table 3). Accordingly, the relationship between CRT and binding foundations is more negative for countries with higher education level and lower democracy.
-0.6 -0.2 0 0.2 0.4 0.6 Observed Outcome Switzerland Germany Sweden Austria The Netherlands USA New Zealand Canada Belgium UK France Czech Rep. Spain Poland Portugal Hungary Chile Japan Uruguay Costa Rica Brazil South Africa Serbia Mexico Hong Kong UAE Taiwan China Turkey India 0.03 [-0.19, 0.24] 0.02 [-0.18, 0.23] -0.09 [-0.26, 0.09] 0.03 [-0.12, 0.19] -0.05 [-0.12, 0.01] -0.00 [-0.04, 0.03] 0.01 [-0.18, 0.21] -0.07 [-0.15, 0.01] -0.15 [-0.30, -0.01] -0.12 [-0.28, 0.03] 0.03 [-0.35, 0.41] -0.05 [-0.22, 0.12] -0.15 [-0.38, 0.09] -0.07 [-0.16, 0.01] -0.06 [-0.34, 0.21] -0.06 [-0.18, 0.05] -0.03 [-0.19, 0.13] -0.04 [-0.19, 0.11] 0.12 [-0.20, 0.44] -0.09 [-0.38, 0.19] -0.05 [-0.29, 0.20] -0.17 [-0.56, 0.22] 0.01 [-0.11, 0.13] 0.16 [-0.07, 0.39] 0.06 [-0.09, 0.20] -0.03 [-0.33, 0.26] -0.14 [-0.29, 0.02] 0.11 [ 0.03, 0.20] 0.12 [ 0.01, 0.23] 0.14 [ 0.01, 0.28]
Figure 3: The distribution of unstandardized regression coefficients predicting individualizing moral foundations from CRT. Whiskers represent 95% confidence intervals for the co-efficients. Grey diamonds represent the predictions from the level of WEIRDness. Countries are ranked based on their mean WEIRDness scores with India being the least WEIRD and Switzerland being the most WEIRD nation.
3.3
Exploratory Analyses on Individualizing
Foundations
Although we did not have any a priori hypothesis regarding the relationship between CRT and individualizing founda-tions or whether such relafounda-tionship would vary based on the level of WEIRDness, we conducted exploratory analyses to provide a more complete picture of the data.
The combined effect without any covariate was not sig-nificant (b = −.016, SE = .017, z = −.939, p = .348, 95% CI [−.048, .017]). When continuous measure of WEIRD-ness was added to the model as a covariate, the coefficient for the intercept was significant (b = .117, SE = .042, z = −2.799, p = .005, 95% CI [.035, .199]). WEIRDness as a covariate was also significant (b = −.196, SE = .059, z = −3.328, p < .001, 95% CI [−.312, −.081]). Accordingly, the relationship between CRT and individualizing foundations was more negative in more WEIRD cultures (see Figure 3). The same results were obtained when a restricted maximum likelihood method was used (see the Appendix).
When the groups of WEIRD and non-WEIRD countries were separately analyzed (Table 1), CRT had a positive ef-fect on individualizing foundations for non-WEIRD coun-tries (b = .052, SE = .022, z = 2.393, p = .017, 95% CI [.009, .095]), whereas it had a negative effect for WEIRD countries (b = −.032, SE = .012, z = −2.677, p = .007,
Table 5: Estimates for the effect of different components of
WEIRDness on individualizing foundations.
b SE z p 95% CI Intercept 0.122 0.184 0.664 0.507 −0.238: 0.482 Western −0.064 0.044 −1.443 0.149 −0.151: 0.023 Educated 0.122 0.261 0.470 0.639 −0.388: 0.633 Industrial 0.058 0.068 0.854 0.393 −0.075: 0.191 Rich −0.066 0.056 −1.175 0.240 −0.176: 0.044 Democratic−0.207 0.197 −1.049 0.294 −0.592: 0.179
95% CI [−.055, −.009]). So, high scores in CRT predicted higher endorsement of individualizing foundations in non-WEIRD countries but lower endorsement in non-WEIRD coun-tries. When five components of WEIRDness, instead of the mean WEIRDness score, were added as covariates, none of them was uniquely significant (Table 5).
3.4
Exploratory Analyses on the
Differ-ence between Binding and Individualizing
Foundations
As CRT had an effect on individualizing foundations and that effect varied based on the level of WEIRDness, sim-ilarly to the binding foundations, we investigated whether CRT had an effect on the difference between two types of foundations. We subtracted the mean score of individual-izing foundations from binding foundations and used those scores as the outcome measures. These scores represented relative endorsement of binding foundations as opposed to individualizing ones.
The combined effect was significant (b = −.089, SE = .011, z =−8.370, p < .001, 95% CI [−.109, −.068]). The negative relationship suggested that higher performance in CRT was related to relatively more endorsement of individ-ualizing foundations as opposed to the binding ones. When WEIRDness was added to the model as a covariate, the in-tercept, (b =−.030, SE = .031, z = −0.946, p = .344, 95% CI [−.091, .032]), was nonsignificant whereas the WEIRDness as moderator hadnegative effect (b =−.087, SE = .044, z = −1.993, p = .046, 95% CI [−.091, .032]; Figure 4). Accord-ingly, for more WEIRD countries, the negative effect of CRT on binding-minus-individualizing foundations was stronger. However, when restricted maximum likelihood model was used, the moderation was not significant (see the Appendix). When we conducted separate analyses for the groups of non-WEIRD and WEIRD countries (Table 1), CRT had a sig-nificantly negative association with the difference score for both non-WEIRD (b =−.054, SE = .019, z = −2.825, p = .005, 95% CI [−.092, −.017])and WEIRD countries (b = −.104,
-0.6 -0.2 0 0.2 0.4 0.6 Observed Outcome Switzerland Germany Sweden Austria The Netherlands USA New Zealand Canada Belgium UK France Czech Rep. Spain Poland Portugal Hungary Chile Japan Uruguay Costa Rica Brazil South Africa Serbia Mexico Hong Kong UAE Taiwan China Turkey India -0.01 [-0.22, 0.19] -0.22 [-0.39, -0.04] 0.13 [-0.05, 0.30] 0.00 [-0.14, 0.14] -0.03 [-0.10, 0.03] -0.20 [-0.24, -0.17] -0.10 [-0.29, 0.08] -0.01 [-0.09, 0.07] -0.02 [-0.16, 0.11] -0.01 [-0.16, 0.14] 0.08 [-0.16, 0.32] -0.02 [-0.21, 0.18] 0.17 [-0.08, 0.43] -0.04 [-0.16, 0.08] 0.12 [-0.19, 0.42] -0.12 [-0.25, 0.02] -0.01 [-0.21, 0.19] 0.05 [-0.09, 0.19] -0.17 [-0.50, 0.16] 0.05 [-0.25, 0.35] -0.12 [-0.35, 0.10] -0.10 [-0.49, 0.29] -0.11 [-0.26, 0.04] -0.16 [-0.46, 0.14] -0.04 [-0.15, 0.07] 0.06 [-0.18, 0.29] -0.07 [-0.24, 0.10] -0.01 [-0.08, 0.06] -0.12 [-0.23, -0.00] -0.11 [-0.19, -0.02]
Figure 4: The distribution of unstandardized regression
co-efficients predicting the difference between binding and indi-vidualizing foundations from CRT. Whiskers represent 95% confidence intervals for the coefficients. Grey diamonds rep-resent the predictions from the level of WEIRDness. Coun-tries are ranked based on their mean WEIRDness scores with India being the least WEIRD and Switzerland being the most WEIRD nation.
but the effect was relatively stronger in WEIRD countries. So, higher scores in CRT was related to relatively higher endorsement of individualizing foundations as opposed to the bindings one, and this effect was stronger in WEIRD countries. Lastly, we added five components of WEIRD-ness, instead of mean WEIRDness score, as covariates to the model. Education was negatively and democracy was positively related (see Table 6). Accordingly, the negative effect of CRT on binding-minus-individualizing foundations was relatively stronger in countries with better education and lower democracy.
4
Discussion
The current research provides the first empirical test of cross-cultural generalizability of the ACS-ideology link in 30 po-litically diverse societies. The results show that although ACS has a significant negative relationship with social con-servatism (measured by both the level of endorsement of binding moral foundations and the difference between bind-ing and individualizbind-ing foundations) in the overall sample, the magnitude of this relationship is weaker in non-WEIRD cultures as compared to the WEIRD ones. There was also a
Table 6: Estimates for the effect of different components of
WEIRDness on difference between binding and individualiz-ing foundations. b SE z p 95% CI Intercept −0.126 0.144 −0.871 0.384 −0.408: 0.157 Western −0.033 0.044 −0.739 0.460 −0.120: 0.054 Educated −0.589 0.214 −2.749 0.006 −1.008:−0.169 Industrial −0.015 0.073 −0.209 0.835 −0.158: 0.127 Rich 0.049 0.056 0.879 0.379 −0.061: 0.160 Democratic 0.671 0.184 3.652 <.001 0.311: 1.031
negative correlation between the commonly used single-item political orientation question and ACS, but WEIRDness did not moderate this effect and a different meta-analysis tech-nique did not yield any effect. These findings are consistent with past findings, suggesting that ACS is associated with social attitudes in general (e.g., Pennycook, Fugelsang & Koehler, 2015), and social conservatism in particular (e.g., Yilmaz & Saribay, 2018a). The finding that the degree of WEIRDness of a culture influences the magnitude of the relationship has also the potential to explain a number of mixed findings previously observed in the literature.
First of all, the majority of the findings in the literature come from WEIRD cultures. Similarly, a meta-analysis of Jost et al. (2018) is substantially limited to studies with WEIRD cultures. An exception is data collected from Turkey (Bahçekapili & Yilmaz, 2017; Yilmaz & Saribay, 2016, 2018a). Although a significant negative relationship between ACS and social conservatism was generally found (Yilmaz & Saribay, 2016, 2018a), there is no consistent pattern of relationship across samples in Turkey (Yilmaz & Saribay, 2017b), a non-WEIRD culture (Klein et al., 2018). The effect sizes of the studies conducted in Turkey are generally smaller than similar research conducted in WEIRD cultures (Yilmaz & Saribay, 2017c). Similarly, whereas both Pennycook et al. (2014) and Landy (2016) found a significant negative rela-tionship between CRT and binding moral foundations (pa-triotism, respect for traditions, and bodily purity) in WEIRD cultures (U.S.), Yilmaz and Saribay (2017b) found no signif-icant relationship in a non-WEIRD culture (Turkey). There-fore, the findings of the current research explain the mixed findings of some previous studies by proposing a boundary condition for the cross-cultural generalizability of the link between ideology and ACS.
Findings related to single item political orientation were mixed. Although a fixed-effects method yielded a negative effect of ACS on ideology, the same result was not obtained with a restricted maximum likelihood method. This sug-gests that the results regarding self-reported ideology were somewhat less reliable as compared to social conservatism.
This was generally consistent with the literature since al-though it was previously used as a reliable measure in the literature (Jost, 2006), Iyer et al.’s (2012) findings highlight its limitation. The argument is that although libertarians are different from conservatives in terms of social attitudes (i.e., social conservatism), they place themselves on the conser-vative side of this single item political orientation question. Assuming there might be different groups with different la-bels in other cultures having similar social attitudes of the libertarians, these results might imply that this single item political orientation question is not a reliable measurement tool that can be used in a cross-cultural examination.
So why is there a difference between WEIRD and non-WEIRD cultures in the relationship between ACS and social conservatism? Although this study remains silent on this is-sue, we conjecture that ACS is more effective in influencing political attitudes in cultures where the left-right division is very clearly differentiated. Although there is no direct evidence for this argument yet, there is some indirect sup-port. For example, if we compare Turkish (a non-WEIRD culture) and US (a WEIRD culture) political systems, we can see that Turkish political atmosphere is not clearly di-vided by left-right or liberal-conservative distinction as in the American counterpart (Mardin, 1973; Öniş, 2007; Özbudun, 2006). Yılmaz, Saribay, Bahçekapılı and Harma (2016b) also showed in Turkey that the supporters of CHP
(Repub-lican People’s Party) — the major social democratic party — did not distinguish from the supporters of MHP
(Nation-alist Movement Party) and AKP (Justice and Development
Party) — the two major conservative parties — on the im-portance they give to the binding foundations (i.e., social conservatism). Social conservatism is very high in Turkey, and this might be the case for other non-WEIRD cultures as well. Therefore, the fact that the variance related to so-cial conservatism is much narrower in non-WEIRD cultures might explain why the relationship between social conser-vatism and CRT is so weak here.
4.1
Limitations and Future Questions
First, an important potential limitation is that some results were weak, with their clarity somewhat dependent on the method used (fixed effects meta-analysis vs. random effects, maximum likelihood vs. restricted maximum likelihood), es-pecially the results concerned with ideology, where CRT had no effect on ideology with maximum liklihood, and the mod-erating effect of WEIRDness on the relationship between CRT and binding foundations was only marginally signifi-cant. However, we argue that the pattern in results suggest that culture matters in the relationship between ACS and po-litical orientations, although the direction and magnitude of this relationship might not be very clear.
Another limitation of this research is that it uses only three numerical CRT questions to measure ACS. Although there
are some recent findings indicating that CRT corresponds to a stable personality trait (Meyer et al., 2018; Stagnaro et al., 2018), there are also some others claiming that it sometimes does not measure relevant aspects of ACS (e.g., Baron, Scott, Fincher & Metz, 2015). Although the results generally re-mained constant when other ACS measures were used (e.g., Pennycook et al., 2014), Yilmaz and Saribay (2017c) found that the three different ACS measures (CRT-2, Base rate Con-flict Problems, and Actively Open Minded-Thinking) were significantly (and negatively) related to social conservatism, and that CRT was not individually related to any of the ide-ology measures (including social conservatism). Therefore, future studies should use other ACS measures in addition to CRT in order to show the cross-cultural validity of the findings here.
Assuming that these correlations might give an idea about the potential cause-effect relation between ACS and social conservatism (i.e., causality flows from a more basic, cog-nitive variable to sociopolitical attitudes, which is partially supported by Yilmaz & Saribay, 2017a), the same boundary condition has also the potential to explain the mixed findings regarding experimental work in the literature.2 One of the first empirical demonstrations of the causal effect of intuition on conservatism was conducted by Eidelman et al. (2012) using WEIRD (i.e., US) samples but were not replicated in later high-powered studies using non-WEIRD samples (Yil-maz & Saribay, 2016, 2018b). Therefore, similar attempts to reconcile the mixed findings might consider experimentally controlling the degree of WEIRDness of culture in future studies.
The most important contribution of this study is to show the moderating role of culture by moving beyond WEIRD samples. However, although this study was based on 30 politically diverse societies that are not frequently used in psychology research, it still does not say anything about less-represented groups such as small-scale hunter-gatherers or older adults. More importantly, none of the samples were se-lected based on a probabilistic random sampling procedure, therefore any of them do not represent the characteristics of each country as a whole. Another potential limitation, and an alternative explanation for the lower correlations in non-WEIRD cultures is the possibility of noisy data (i.e., translation issues) and lower levels of survey expertise (i.e., less familiarity with the survey response scales). Therefore, in order to confidently conclude that there are real cultural differences, future studies should account for these two is-sues. Pennycook and Rand (2019) also showed that political participation is positively correlated with CRT scores, and the association between CRT and binding foundations might be driven by some politically disengaged moderates in either
2Although based on the previous literature it is plausible to say that causality flows from a more basic, cognitive variable to political attitudes, the reverse causal direction is also possible, and should be examined in future research.
WEIRD or non-WEIRD cultures in the current study. How-ever, this goes beyond the scope of the present research as the available set of measures did not include a measure of political participation.
4.2
Conclusion
The current study shows for the first time that the relation-ship between ACS and social conservatism is stable for only WEIRD cultures. Therefore, if an independent observer wants to predict one’s degree of social conservatism, she must look at both the level of ACS and where she lives, since the findings of the current study illustrates that there is an important cross-cultural variability on this relationship. Although ACS explains unique variance in social conser-vatism, the effect sizes are small even in WEIRD cultures, which indicate that cultural factors may be more important than differences in cognitive style. Overall, this study em-phasizes the limitations of studying only WEIRD cultures for making inferences about human universals (especially on the moral domain).
References
Bahçekapili, H. G., & Yilmaz, O. (2017). The relation be-tween different types of religiosity and analytic cognitive style. Personality and Individual Differences, 117, 267– 272.
Baron, J., Scott, S., Fincher, K., & Metz, S. E. (2015). Why does the Cognitive Reflection Test (sometimes) predict utilitarian moral judgment (and other things)?. Journal of
Applied Research in Memory and Cognition, 4(3), 265– 284.
Berni¯unas, R., Dranseika, V., & Sousa, P. (2016). Are there different moral domains? Evidence from Mongo-lia. Asian Journal of Social Psychology, 19(3), 275–282. Brandt, M. J., Evans, A. M., & Crawford, J. T. (2015). The unthinking or confident extremist? Political extremists are more likely than moderates to reject experimenter gener-ated anchors. Psychological Science, 26(2), 189–202. Buchtel, C., & Norenzayan, A. (2009). Thinking across
cultures: Implications for dual processes. In J. St. B. T. Evans & K. Frankish (Eds.), In two minds: Dual processes
and beyond (pp. 217–238). Oxford, England: Oxford University Press.
Davies, C. L., Sibley, C. G., & Liu, J. H. (2014). Confirma-tory factor analysis of the Moral Foundations Question-naire. Social Psychology, 45, 431–436.
Deppe, K. D., Gonzalez, F. J., Neiman, J. L., Jacobs, C., Pahlke, J., Smith, K. B., & Hibbing, J. R. (2015). Re-flective liberals and intuitive conservatives: A look at the Cognitive Reflection Test and ideology. Judgment and
Decision Making, 10(4), 314–331.
Eidelman, S., Crandall, C. S., Goodman, J. A., & Blanchar, J. C. (2012). Low-effort thought promotes political con-servatism. Personality and Social Psychology Bulletin,
38(6), 808–820.
Federico, C. M., Weber, C. R., Ergun, D., & Hunt, C. (2013). Mapping the connections between politics and morality: The multiple sociopolitical orientations involved in moral intuition. Political Psychology, 34(4), 589–610. http:// dx.doi.org/10.1111/pops.12006.
Finucane, M. L., & Gullion, C. M. (2010). Developing a tool for measuring the decision-making competence of older adults. Psychology and Aging, 25(2), 271–288.
Frederick, S. (2005). Cognitive reflection and decision mak-ing. The Journal of Economic Perspectives, 19(4), 25–42. Gervais, W. M., van Elk, M., Xygalatas, D., McKay, R. T., Aveyard, M., Buchtel, E. E., ... & Svedholm-Häkkinen, A. M. (2018). Analytic atheism: A cross-culturally weak and fickle phenomenon?. Judgment and Decision Making,
13(3), 268–274.
Graham, J., Nosek, B. A., Haidt, J., Iyer, R., Koleva, S., & Ditto, P. H. (2011). Mapping the moral domain.
Jour-nal of PersoJour-nality and Social Psychology, 101, 366–385. http://dx.doi.org/10.1037/a0021847.
Iyer, R., Koleva, S., Graham, J., Ditto, P., & Haidt, J. (2012). Understanding libertarian morality: The psychological dispositions of self-identified libertarians. PLOSONE,
7(8), e42366.
JASP Team (2011). JASP (Version 0.9) [Computer soft-ware].
Jost, J. T., Glaser, J., Kruglanski, A. W., & Sulloway, F. J. (2003). Political conservatism as motivated social cogni-tion. Psychological Bulletin, 129(3), 339–375.
Jost, J. T. (2006). The end of the end of ideology. American
Psychologist, 61(7), 651–670.
Jost, J. T. (2012). Left and right, right and wrong. Science,
337(6094), 525–526. http://dx.doi.org/10.1126/science.
1222565.
Jost, J. T., Sterling, J., & Stern, C. (2018). Getting closure on conservatism, or the politics of epistemic and existential motivation. In C. Kopetz, & A. Fishbach (Eds.), The
motivation-cognition interface; From the lab to the real world: A Festschrift in honor of Arie W. Kruglanski. (pp. 56–87). New York, NY: Routledge/Taylor & Francis. Henrich, J., Heine, S. J., & Norenzayan, A. (2010). The
weirdest people in the world?. Behavioral and Brain
Sci-ences, 33(2–3), 61–83.
Kahan, D. M. (2013). Ideology, motivated reasoning, and cognitive reflection. Judgment and Decision Making,
8(4), 407–424.
Klein, R. A., Vianello, M., Hasselman, F., Adams, B. G., Adams, R. B., Jr., Alper, S., . . . Nosek, B. A. (2018). Many Labs 2: Investigating variation in replicability across sample and setting. https://doi.org/10.31234/osf. io/9654g.
Kugler, M., Jost, J. T., & Noorbaloochi, S. (2014). Another look at moral foundations theory:
Do authoritarianism and social dominance orientation ex-plain liberal-conservative differences in “moral” intu-itions?. Social Justice Research, 27(4), 413–431. Landy, J. F. (2016). Representations of moral violations:
Category members and associated features. Judgment
and Decision Making, 11(5), 496–508.
Mardin, Ş. (1973). Center-periphery relations: A key to Turkish politics?. Daedalus, 169–190.
Métayer, S., & Pahlavan, F. (2014). Validation de l’adaptation française du questionnaire des principes moraux fondateurs. Revue Internationale de
Psycholo-gie Sociale, 27(2), 79–107.
Meyer, A., Zhou, E., & Frederick, S. (2018). The non-effects of repeated exposure to the Cognitive Reflection Test. Judgment and Decision Making, 13(3), 246–259. Milojev, P., Osborne, D., Greaves, L. M., Bulbulia, J.,
Wil-son, M. S., Davies, C. L., ... & Sibley, C. G. (2014). Right-wing authoritarianism and social dominance ori-entation predict different moral signatures. Social
Jus-tice Research, 27(2), 149–174. http://dx.doi.org/10.1007/ s11211-014-0213-7.
Muthukrishna, M., Bell, A. V., Henrich, J., Curtin, C. M., Gedranovich, A., McInerney, J., & Thue, B. (2018). Be-yond WEIRD psychology: measuring and mapping scales of cultural and psychological distance. https://dx.doi.org/ 10.2139/ssrn.3259613.
Nilsson, A., & Erlandsson, A. (2015). The Moral Foun-dations taxonomy: Structural validity and relation to po-litical ideology in Sweden. Personality and Individual
Differences, 76, 28–32. http://dx.doi.org/10.1016/j.paid. 2014.11.049.
Öniş, Z. (2007). Conservative globalists versus defensive na-tionalists: political parties and paradoxes of Europeaniza-tion in Turkey. Journal of Southern Europe and the Balkans, 9(3), 247–261.
Özbudun, E. (2006). Changes and continuities in the Turkish party system. Representation, 42(2), 129–137.
Piazza, J., & Sousa, P. (2014). Religiosity, political orienta-tion, and consequentialist moral thinking. Social
Psycho-logical and Personality Science, 5, 334–342.
Pennycook, G., Cheyne, J. A., Seli, P., Koehler, D. J., & Fugelsang, J. A. (2012). Analytic cognitive style predicts religious and paranormal belief. Cognition, 123(3), 335– 346.
Pennycook, G., Cheyne, J. A., Barr, N., Koehler, D. J., & Fugelsang, J. A. (2014). The role of analytic thinking in moral judgements and values. Thinking & Reasoning,
20(2), 188–214.
Pennycook, G., Fugelsang, J. A., & Koehler, D. J. (2015). Everyday consequences of analytic thinking. Current
Di-rections in Psychological Science, 24(6), 425–432.
Pennycook, G., & Rand, D. G. (2019). Cognitive reflection and the 2016 US Presidential election. Personality and
Social Psychology Bulletin, 45(2), 224–239.
Saribay, S. A., & Yilmaz, O. (2017). Analytic cognitive style and cognitive ability differentially predict religios-ity and social conservatism. Personalreligios-ity and Individual
Differences, 114, 24–29.
Sinn, J. S., & Hayes, M. W. (2016). Replacing the Moral Foundations: An Evolutionary-Coalitional Theory of Liberal-Conservative Differences. Political Psychology. http://dx.doi.org/10.1111/pops.12361.
Stagnaro, M. N., Pennycook, G., & Rand, D. G. (2018). Performance on the Cognitive
Reflection Test is stable across time. Judgment and Decision
making, 13(3), 260–267.
Sterling, J., Jost, J. T., & Pennycook, G. (2016). Are ne-oliberals more susceptible to bullshit?. Judgment and
Decision Making, 11(4), 352–360.
Talhelm, T., Haidt, J., Oishi, S., Zhang, X., Miao, F. F., & Chen, S. (2015). Liberals think more analytically (more “WEIRD”) than conservatives. Personality and Social
Psychology Bulletin, 41(2), 250–267.
Talhelm, T. (2018). Hong Kong liberals are WEIRD: An-alytic thought increases support for liberal policies.
Per-sonality and Social Psychology Bulletin, 44(5), 717–728. Van Berkel, L., Crandall, C. S., Eidelman, S., & Blanchar, J. C. (2015). Hierarchy, dominance, and deliberation: Egalitarian values require mental effort. Personality and
Social Psychology Bulletin, 41(9), 1207–1222.
Viechtbauer, W. (2010). Conducting meta-analyses in R with the metafor package. Journal of Statistical Software,
36(3), 1–48. http://www.jstatsoft.org/v36/i03/
Yilmaz, O., & Saribay, S. A. (2016). An attempt to clarify the link between cognitive style and political ideology: A non-western replication and extension. Judgment and
Decision Making, 11(3), 287–300.
Yilmaz, O., Harma, M., Bahçekapili, H. G., & Cesur, S. (2016a). Validation of the moral foundations question-naire in Turkey and its relation to cultural schemas of in-dividualism and collectivism. Personality and Individual
Differences, 99, 149–154.
Yılmaz, O., Saribay, S. A., Bahçekapılı, H. G., & Harma, M. (2016b). Political orientations, ideological self-categorizations, party preferences, and moral foundations of young Turkish voters. Turkish Studies, 17(4), 544–566. Yilmaz, O., & Saribay, S. A. (2017a). Analytic thought train-ing promotes liberalism on contextualized (but not stable) political opinions. Social Psychological and Personality
Science, 8(7), 789–795.
Yilmaz, O., & Saribay, S. A. (2017b). Activating analytic thinking enhances the value given to individualizing moral foundations. Cognition, 165, 88–96.
Yilmaz, O., & Saribay, S. A. (2017c). The relationship between cognitive style and political orientation depends
on the measures used. Judgment and Decision Making,
12(2), 140–147.
Yilmaz, O., & Saribay, S. A. (2018a). Lower levels of resistance to change (but not opposition to equality) is related to analytic cognitive style. Social Psychology, 49, 65–75.
Yilmaz, O., & Saribay, S. A. (2018b). A preregistered replication attempt of Eidelman, Crandall, Goodman, and Blanchar (2012). Unpublished Raw Data. https://osf.io/ uqp4g/.
Zhang, Y., & Li, S. (2015). Two measures for cross-cultural research on morality: Comparison and revision.
Psycho-logical Reports, 117(1), 144–166.
Appendix
Table 7: Correct responses to item #2 of Cognitive Reflec-tion Test. For the remaining countries, the correct response was 2.25.
Country Correct Response
Chile 270
China 14
Costa Rica 2250 Czech Rep. 22.5
France 2
Hong Kong (China) 22.5
Japan 225 Mexico 22.5 Serbia 250 Switzerland 2 Taiwan (China) 22.5 Uruguay 22.5
Table 8: Correlations of main variables with CRT for each
country.
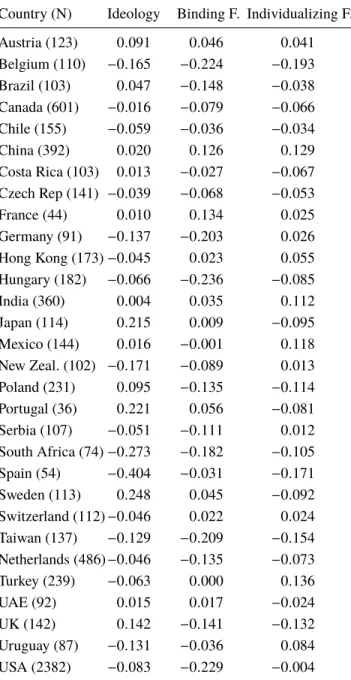
Country (N) Ideology Binding F. Individualizing F. Austria (123) 0.091 0.046 0.041 Belgium (110) −0.165 −0.224 −0.193 Brazil (103) 0.047 −0.148 −0.038 Canada (601) −0.016 −0.079 −0.066 Chile (155) −0.059 −0.036 −0.034 China (392) 0.020 0.126 0.129 Costa Rica (103) 0.013 −0.027 −0.067 Czech Rep (141) −0.039 −0.068 −0.053 France (44) 0.010 0.134 0.025 Germany (91) −0.137 −0.203 0.026 Hong Kong (173)−0.045 0.023 0.055 Hungary (182) −0.066 −0.236 −0.085 India (360) 0.004 0.035 0.112 Japan (114) 0.215 0.009 −0.095 Mexico (144) 0.016 −0.001 0.118 New Zeal. (102) −0.171 −0.089 0.013 Poland (231) 0.095 −0.135 −0.114 Portugal (36) 0.221 0.056 −0.081 Serbia (107) −0.051 −0.111 0.012 South Africa (74)−0.273 −0.182 −0.105 Spain (54) −0.404 −0.031 −0.171 Sweden (113) 0.248 0.045 −0.092 Switzerland (112)−0.046 0.022 0.024 Taiwan (137) −0.129 −0.209 −0.154 Netherlands (486)−0.046 −0.135 −0.073 Turkey (239) −0.063 0.000 0.136 UAE (92) 0.015 0.017 −0.024 UK (142) 0.142 −0.141 −0.132 Uruguay (87) −0.131 −0.036 0.084 USA (2382) −0.083 −0.229 −0.004
Table 9:Descriptive statistics for main variables (SD in parentheses).
Country (N) CRT Ideology Binding F. Individualizing F. Austria (123) 1.256 (0.902) 3.340 (0.841) 3.585 (0.674) 5.031 (0.744) Belgium (110) 0.722 (0.874) 3.950 (1.190) 3.923 (0.684) 4.863 (0.687) Brazil (103) 0.592 (0.744) 3.400 (1.423) 3.630 (0.840) 4.914 (0.883) Canada (601) 0.612 (0.800) 3.940 (1.005) 3.982 (0.751) 4.817 (0.807) Chile (155) 0.307 (0.586) 4.190 (1.346) 4.347 (0.676) 5.330 (0.558) China (392) 1.432 (0.934) 3.900 (1.029) 3.950 (0.769) 4.138 (0.844) Costa Rica (103) 0.242 (0.455) 3.520 (1.173) 4.220 (0.693) 5.210 (0.631) Czech Rep. (141) 0.444 (0.633) 4.470 (1.105) 3.959 (0.640) 4.748 (0.640) France (44) 1.047 (1.022) 4.180 (1.483) 3.496 (0.872) 4.019 (1.291) Germany (91) 0.872 (0.732) 3.130 (0.810) 3.584 (0.680) 4.989 (0.675) Hong Kong (China) (173) 1.195 (0.940) 3.410 (1.880) 3.907 (0.756) 4.552 (0.922) Hungary (182) 0.821 (0.887) 3.520 (1.331) 3.826 (0.702) 5.064 (0.667) India (360) 0.894 (0.868) 4.480 (1.191) 3.833 (0.893) 4.019 (1.096) Japan (114) 0.750 (0.856) 4.040 (0.976) 3.912 (0.685) 4.616 (0.677) Mexico (144) 0.182 (0.442) 3.420 (1.122) 4.116 (0.717) 5.207 (0.588) New Zealand (102) 0.571 (0.786) 3.520 (1.326) 3.888 (0.789) 4.861 (0.771) Poland (231) 0.562 (0.750) 3.480 (1.364) 4.069 (0.632) 4.911 (0.485) Portugal (36) 0.571 (0.815) 3.580 (1.200) 3.973 (0.754) 5.032 (0.649) Serbia (107) 0.717 (0.859) 3.240 (1.203) 3.910 (0.784) 5.169 (0.539) South Africa (74) 0.265 (0.507) 3.600 (1.650) 4.010 (0.736) 4.956 (0.819) Spain (54) 1.000 (0.855) 4.750 (1.186) 4.278 (0.757) 4.755 (0.731) Sweden (113) 0.897 (0.900) 3.040 (1.768) 3.377 (0.790) 4.778 (0.824) Switzerland (112) 1.125 (0.840) 3.130 (1.411) 3.502 (0.811) 4.361 (0.944) Taiwan (China) (137) 0.931 (0.809) 3.860 (1.117) 4.080 (0.796) 4.700 (0.709) The Netherlands (486) 0.935 (0.961) 3.980 (1.279) 3.755 (0.599) 4.746 (0.680) Turkey (239) 0.957 (0.945) 2.870 (1.350) 3.704 (0.812) 4.656 (0.829) UAE (92) 0.319 (0.575) 3.650 (1.188) 4.127 (0.711) 4.817 (0.809) UK (142) 0.507 (0.707) 3.500 (1.119) 3.925 (0.686) 5.038 (0.653) Uruguay (87) 0.241 (0.486) 2.820 (1.651) 4.058 (0.697) 5.082 (0.694) USA (2382) 0.754 (0.892) 3.650 (1.547) 3.977 (0.807) 4.928 (0.747)
Table 10:Bivariate correlations between CRT, ideology, binding foundations, and individualizing foundations. CRT Ideology Binding F. Ideology Pearson’s r −0.035 p-value 0.003 Upper 95% CI −0.012 Lower 95% CI −0.059 Binding Pearson’s r −0.136 0.145 p-value <.001 <.001 Upper 95% CI −0.113 0.168 Lower 95% CI −0.159 0.122 Individualizing Pearson’s r −0.074 −0.134 0.482 p-value <.001 <.001 <.001 Upper 95% CI −0.050 −0.111 0.499 Lower 95% CI −0.097 −0.157 0.464
Table 11:Bivariate correlations for countries categorized as WEIRD cultures. CRT Ideology Binding F. Ideology Pearson’s r −0.035 p-value 0.003 Upper 95% CI −0.012 Lower 95% CI −0.059 Binding Pearson’s r −0.136 0.145 p-value <.001 <.001 Upper 95% CI −0.113 0.168 Lower 95% CI −0.159 0.122 Individualizing Pearson’s r −0.074 −0.134 0.482 p-value <.001 <.001 <.001 Upper 95% CI −0.050 −0.111 0.499 Lower 95% CI −0.097 −0.157 0.464
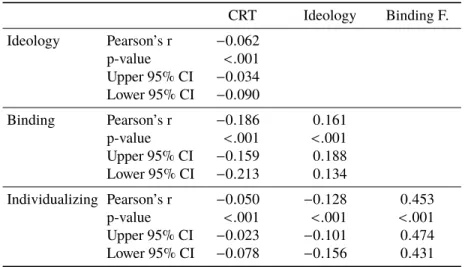
Table 12:Bivariate Correlations for countries categorized as non-WEIRD cultures. CRT Ideology Binding F. Ideology Pearson’s r −0.062 p-value <.001 Upper 95% CI −0.034 Lower 95% CI −0.090 Binding Pearson’s r −0.186 0.161 p-value <.001 <.001 Upper 95% CI −0.159 0.188 Lower 95% CI −0.213 0.134 Individualizing Pearson’s r −0.050 −0.128 0.453 p-value <.001 <.001 <.001 Upper 95% CI −0.023 −0.101 0.474 Lower 95% CI −0.078 −0.156 0.431
Results of Meta-Analyses of Foundations with
Random Effects
The Effect on Binding Foundations
The combined meta−analytic effect was significant (b = −.061, SE = .020, z = −3.095, p = .002, 95% CI [−.101, −.023]). When continuous WEIRDness score was added to the model as a covariate, intercept was nonsignificant (b = .038, SE = .051, z = .736, p = .462, 95% CI [−.063, .138]) and WEIRDness as a covariate was significant, but barely (b =−.156, SE = .074, z = −2.103, p = .036, 95% CI [−.301, .012]).
The Effect on Individualizing Foundations
The combined meta-analytic effect was not statistically sig-nificant (b = −.016, SE = .016, z = −.957, p = .339, 95% CI [−.048, .016]). When continuous WEIRDness score was added to the model as a covariate, both intercept (b = .117,
SE= .041, z = 2.882, p = .004, 95% CI [.038, .197]) and
WEIRDness as a covariate were significant (b =−.194, SE = .057, z =−3.413, p < .001, 95% CI [−.305, −.082]).
The difference between binding and individualizing foun-dations as a covariate was not close to significant (as in other analyses).
Results of Meta-Analyses with Restricted
Max-imum Likelihood Method
The Effect on Ideology
The combined meta-analytic effect was not statistically sig-nificant (b =−.035, SE = .029, z = −1.234, p = .217, 95% CI [−.091, .021]). When continuous WEIRDness score was added to the model as a covariate, neither the intercept (b = −.041, SE = .083, z = −.488, p = .625, 95% CI [−.204, .123]) nor WEIRDness as a covariate had a significant effect (b = .009, SE = .122, z = .071, p = .943, 95% CI [−.230, .247]; see Figure 1).
The Effect on Binding Foundations
The combined meta−analytic effect was significant (b = −.061, SE = .020, z = −3.041, p = .002, 95% CI [−.101, −.022]). When continuous WEIRDness score was added to the model as a covariate, intercepts was nonsignificant (b = .034, SE = .053, z = .639, p = .523, 95% CI [−.703, .138]) and WEIRDness as a covariate was marginally significant (b =−.149, SE = .077, z = −1.936, p = .053, 95% CI [−.300, .002]; see Figure 2).
The Effect on Individualizing Foundations
The combined meta-analytic effect was not statistically sig-nificant (b =−.016, SE = .017, z = −.939, p = .348, 95% CI [−.048, .017]). When continuous WEIRDness score was added to the model as a covariate, both intercept (b = .117,
SE= .042, z = 2.799, p = .005, 95% CI [.035, .199]) and WEIRDness as a covariate were significant (b =−.196, SE = .059, z =−3.328, p < .001, 95% CI [−.312, −.081]; see Figure 3).
The Effect on the Difference between Binding and Indi-vidualizing Foundations
The combined meta-analytic effect was statistically signif-icant (b = −.050, SE = .0182, z = −2.818, p = .005, 95% CI [−.086, −.015]). When continuous WEIRDness score was added to the model as a covariate, neither intercept (b =−.074, SE = .051, z = −1.435, p = .151, 95% CI [−.174, .027]) nor WEIRDness as a covariate was significant (b = .037, SE = .075, z = 0.494, p = .621, 95% CI [−.110, .184]; see Figure 4).