AN EMPIRICAL ANALYSIS OF ACCURATE BUDGET
FORECASTING IN TURKEY
TÜRK YE’DE BÜTÇE TAHM N DO RULU UNUN AMP R K B R ANAL Z
Muhlis BA D GEN
Zonguldak Karaelmas University, Çaycuma Faculty of Economics and Administrative Sciences Department of Public Finance
ABSTRACT: This paper analyzes the accuracy of budget forecasts in Turkey. Data
is based on 23 years’ forecasted and materialized general budget revenues and outlays, from 1981 to 2003. One sample statistics, tabulated, and one sample t tests are applied to find out the accuracy of forecasting and the results show that there are statistically significant forecast errors and this significance, especially, indicates biases towards under-forecasting of outlays and over-forecasting of revenues.
Keywords: Budget forecasting, budgeting. forecast error.
ÖZET: Bu çalı ma ile Türkiye’de bütçe tahminlerinin do rulu u analiz
edilmektedir. 1981-2003 dönemine ait 23 yıl için kullanılan veri, gelir ve harcamalara ili kin tahmin edilen ve gerçekle en genel bütçe verilerine dayanmaktadır. Tek örnek istatisti i ve tek örnek t testi kullanılarak bütçe tahminlerinin do rulu u ara tırılmaktadır. Elde edilen ampirik bulgular bütçe tahminlerinde tahmin hataları yapıldı ını ve bu hataların istatistiksel olarak gelir tahminlerinde fazla gelir tahminine, harcama tahminlerinde ise dü ük harcama tahminine yönelik bir e ilim oldu u eklindedir.
Anahtar Kelimeler: Bütçe tahmini, bütçeleme, tahmin hatası.
1. Introduction
Outcome of forecasted budget, which is called materialized budget, must be important for budget-makers as this seems to be the criteria for them to testimony how they successfully implement their policies. Budget forecasting, however, has systematic as well as complex procedure that requires knowledge based on experience, access to information including information on the impact of economic, political and institutional factors (See”, for example, Bahl, 1980; and Bretschneider & Gorr, 1987), collaboration, probability of uncertainties, etc. All those have some degrees of effects on the outcome that eventually comes out with accurate/inaccurate revenue and outlay forecasts. To get accurately forecasted budget, budget-makers must, therefore, consider all these during the forecasting.
By accuracy, it does not mean that forecasted budget revenues and outlays must solely be equal to the outcomes. There would likely be some degrees of variations between forecasted budget and its outcome that must be taken reasonably
acceptable.1 It is however expected that the budget-makers pay enough attention on
the forecasting to catch as small variations as possible between their forecasted and materialized budgets. Otherwise, the failure in accuracy might easily and cheaply be attributed to themselves (Ba digen, 2002:30).
With budget forecasting, there are two main assumptions that can be summarized as follows. In the outlay side of the budget, it may be supposed that accuracy in forecasting was achieved. In this case, it is in probability to derive one of three results with regard to forecasted and materialized revenues: Revenue was over-forecasted or under-over-forecasted or accurately over-forecasted. If the budget materialized with over-forecasted revenue, serious problems would become inevitable. Because revenues inadequately materialized, either there must be some cuts in spending or search for new resources to finance all the approved spendings (Schoeder, 1982:122). In the case of under-forecasted revenue, there would not be any serious problem providing taxpayers did not interpret government as levying taxes excessively (Vasche and Williams, 1987). In the case of accurately forecasted revenue, the outcome clarifies budget-makers as they had forecasted revenues accurately.
Disregarding the above assumption, it may also be supposed that accuracy was achieved in forecasting of budget revenue. In this case, it is also in probability to derive one of three results for the forecasted and materialized outlays. Outlay was over-forecasted or under-forecasted or accurately forecasted. If the budget materialized with over-forecasted outlays, there would be some excess resources that were not needed during the budget year. In the case of under-forecasted outlay, the budget-makers would face to serious consequences; searching for new resources, midcourse adjustments in forecasted outlays, or financing outlays by debt that would eventually cause budget deficits. In the case of accurately forecasted outlay, there would be no criticism on budget-makers.
The focus of this paper is to analyze the accuracy of budget forecasting for revenues and outlays in Turkey. For this purpose, 23 years period, from 1981 to 2003 financial years’ budgetary data are used to statistically analyze budget forecast
variations2 and forecast errors3. Statistical tools used are simple statistics; one sample statistics and one sample t test.
1 The extent to which we take the degrees of variation as reasonable can only be analyzed
through some statistical techniques that are applied in the empirical section of this study.
2 Budget forecast variation, BFV, is defined as differences between the budget outcome and
the forecasted budget expressed as the percentage of budget outcome for the previous year and can be formulated as (Australian National Audit Office, 1999).
100 1 × − = − t t t t O FB O BFV (1)
Where, O is budgetary output, FB is forecasted budget, t is financial year.
3 Forecast error, FE, can be defined as difference between the budget outcome and the
forecasted budget expressed as the percentage of budget outcome and can be formulated as (Ba digen, 2002:32). 100 × − = t t t t O FB O FE (2)
2. The Scope of Budget Forecasting
Budget is a tool of governments –rolling party or parties– to indirectly express the will of their citizenry. It might simple be defined as a forecast of revenues and outlays that citizenry expected for a given period. The forecast represents both a level of goods and services that will publicly be provided and means of finance. Any variation from the forecast will denote a difference between what was agreed on and what has materialized.
Budgeting is also a political tool and has inherently political process in which it is up to the politicians’ preferences to decide on which variables to be put into the forecast. Earlier studies put different variables into their analysis to improve their models to get accurate forecasting (See, for example, Kliesen and Thornton, 2001; Auerbach, 1999; Williams et al., 1999; Mayper et al., 1991; Bretschneider and Gorr, 1987; Bahl, 1980; and Granof, 1978). Some of those variable that were expected to have important effects on the outcome of budget forecasts can be given as economic growth, inflation, unemployment, world economic growth, household income, change in population, and political stability.
This study does not however focus on the way of making accurate budget forecasting or to find out what factors are associated with budget forecast variations, BFV. Whatever affects budget forecasting, we expect the forecasters, budget-makers, are able to perfectly consider all of them and able to take into account all the necessary variables effecting their forecast. From this point of view, this study is an attempt to elucidate how successfully revenues and outlays were forecasted in Turkish case.
It is supposed that if there are obvious forecast errors that would likely be caused by poor forecast effort of the budget-makers, it will be then some accusations targeted to the failure of budget-makers. Kind of those accusations would be as:
a) They deliberately underestimate/overestimate revenues/outlays to live enough room for themselves to deal with unanticipated shortages.
b) They deliberately overestimate/underestimate revenues/outlays to prevent from potential reactions of citizenry that would put in force before the operation of the budget providing they were earlier informed about the potential budget deficit, tax increases, etc.
Though there would be many reasons behind the last assumption, we take two of those that must be expressed. Firstly, it indicates that budget-makers act cautiously so that the outcome would not be as what were forecasted earlier in the proposed budget. The budget-makers would probably not want to take the risk of citizenry’s reaction at the beginning of budget forecast. They might want to disperse towards the midcourse of the budgetary operation by living some enough rooms to maneuver with midcourse amendments. Secondly, for the year budget being prepared, there would be election eve and budget-makers might act intentionally so that they can get more vote through the contents of the budget prepared in the line with what citizenry expect.
From these two main assumptions, the study empirically analyzes to answer to the following hypotheses:
Null-hypothesis: Forecasted budget revenue and outlay are equal to materialized
budget revenue and outlay.
H0:
µ
=0 Forecast errors, FEs, for revenue and outlay are equal to zero.Hypothesis 1: Budget-makers cannot accurately forecast revenues; FEs always
occur.
H1:
µ
≠ 0 FEs for revenues are not equal to zero, i.e. revenues are over or under-forecasted.
Hypothesis 2: Budget-makers cannot accurately forecast outlays; FEs always occur.
H2:
µ
≠ 0 FEs for outlays are not equal to zero, i.e. outlays are over orunder-forecasted.
Hypothesis 3: Budget-makers cautiously act towards over-forecasting revenues.
H3:
µ
< 0 FEs for revenues are smaller than zero, i.e. revenues are over-forecastedHypothesis 4: Budget-makers cautiously act towards under-forecasting outlays.
H4:
µ
> 0 FEs for outlays are bigger than zero, i.e. outlays are under-forecasted. To answer to these assumptions, we use the method of BFV by the Audit Report of Australian National Audit Office (1999) and the method of FE by Rodgers and Joyce (1996) and Ba digen (2002). BFV can simply be expressed as the percentage of budget forecast variation with regard to the previous year’s outcome. Findings of this analysis will show the extent to which forecast variation occurred. FE provides answer to whether the budget-makers did accurately forecast budgetary outlays and revenues.3. Description of the Data
The study was limited to the data of general budget. The period taken into account is from 1981 to 2003 financial year. In the year 2001, there happened economic crises that had really caused obvious amendments in the budget. As a result of this, initial FE for the year 2001 was enormously big. To eliminate effects of the crises on the budget, we did not take the initially forecasted budget but rather the forecasted budget that was stated just after the crises.
The data used in this study is obtained from State Institute of Statistics (2001), General Directorate of Revenues (2004), and General Directorate of Public Accounts (2004).
4. Empirical Analysis
4.1. Comparisons of forecasted budgets and their outcomes
In this section, it is firstly analyzed the extent to which BFVs and FEs occurred for the years 1981-2003. Mean budget forecast variations, MBFVs, and mean forecast errors, MFEs, are also taken into account to see statistical significance of BFVs and
FEs. Then, absolute forecast errors, AFEs and absolute budget forecast variations, ABFVs, put into the analysis disregarding the directions4 of variations.
Table 1 represents both FEs and AFEs for forecasted revenues and outlays. It also gives difference of absolute FEs obtained by subtracting FEs of revenues from FEs of outlays. Error ratios with negative sign indicate over-forecasted budgets and ratios with positive sign indicate under-forecasted budgets. The last two rows in the table show mean FEs and standard deviations, SDs, respectively.
In the table;
• support for the null-hypotheses, H0, will be obtained if the FEs are zero.
• support for the hypotheses H1 and H2 will be obtained if the FEs are different
than zero, having either negative or positive signs.
• support for the hypothesis H3/H4 is obtained if the signs of FEs’ for
outlay/revenue were, in general, negative/positive.
Table 1. Budget Forecast Errors, 1981-2003 (%)
REVENUE OUTLAYS Year FE (1) AFE (2) (3) FE AFE (4) Difference of FEs [1-3] (5) 1981 -2.60 2.60 -0.10 0.10 -2.50 1982 -13.18 13.18 -7.61 7.61 -5.57 1983 -1.65 1.65 7.70 7.70 -9.35 1984 -5.05 5.05 23.04 23.04 -28.09 1985 5.60 5.60 6.15 6.15 -0.55 1986 -7.16 7.16 9.20 9.20 -16.35 1987 -10.02 10.02 10.88 10.88 -20.90 1988 -23.16 23.16 -1.64 1.64 -21.52 1989 -8.35 8.35 13.29 13.29 -21.64 1990 -16.09 16.09 2.84 2.84 -18.92 1991 -9.18 9.18 18.59 18.59 -27.76 1992 -19.17 19.17 5.30 5.30 -24.47 1993 -13.64 13.64 17.64 17.64 -31.28 1994 -10.90 10.90 7.22 7.22 -18.11 1995 -1.10 1.10 22.29 22.29 -23.38 1996 1.67 1.67 10.60 10.60 -8.93 1997 -8.92 8.92 21.96 21.96 -30.89 1998 7.53 7.53 4.64 4.64 2.89 1999 3.79 3.79 2.79 2.79 1.00 2000 1.76 1.76 -0.44 0.44 2.20 2001 4.19 4.19 -2.42 2.42 6.61 2002 4.94 4.94 14.90 14.90 -9.96 2003 -1.82 1.82 -4.33 4.33 2.50
4 The direction of BFV or FE can either have negative or positive sign. If the sign is positive,
this denotes that budget forecast under-forecasted and if the sign is negative, this denotes vice versa.
REVENUE OUTLAYS Year FE (1) AFE (2) (3) FE AFE (4) Difference of FEs [1-3] (5) Mean -5.33 7.89 7.93 9.37 -13.26 Std. Dev. 8.43 5.97 8.87 7.26 12.22
Note: FE and AFE indicate Forecast Error and Absolute Forecast Errors respectively.
Taking the findings in Table 1 into account all the FEs for revenue had, firstly, occurred different than zero; 7 out of 23 FEs have positive sign and the rest negative. This statistically supports our first hypothesis, H1, and rejects the
null-hypothesis of perfect revenue forecasting. With 16 out of 23 negative signed FEs, the hypothesis H3 of over-forecasted revenue cannot also be rejected.
Secondly, all the FEs for outlays had occurred different than zero; 6 out of 23 FEs have negative sign, while the rest positive. This finding, also, statistically supports the assumption of budget-makers cannot accurately forecast outlays, H2. The density
of positive sing, with 17 out of 23, has statistically importance to state that during the period we analyzed budget-makers under-forecasted outlays, therefore we cannot reject the hypothesis H4.
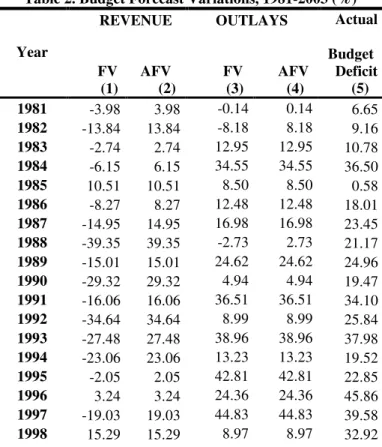
Table 2 shows budget forecast variations for revenues and outlays and actual budget deficits.
Table 2. Budget Forecast Variations, 1981-2003 (%)
REVENUE OUTLAYS Year FV (1) AFV (2) (3) FV AFV (4) Actual Budget Deficit (5) 1981 -3.98 3.98 -0.14 0.14 6.65 1982 -13.84 13.84 -8.18 8.18 9.16 1983 -2.74 2.74 12.95 12.95 10.78 1984 -6.15 6.15 34.55 34.55 36.50 1985 10.51 10.51 8.50 8.50 0.58 1986 -8.27 8.27 12.48 12.48 18.01 1987 -14.95 14.95 16.98 16.98 23.45 1988 -39.35 39.35 -2.73 2.73 21.17 1989 -15.01 15.01 24.62 24.62 24.96 1990 -29.32 29.32 4.94 4.94 19.47 1991 -16.06 16.06 36.51 36.51 34.10 1992 -34.64 34.64 8.99 8.99 25.84 1993 -27.48 27.48 38.96 38.96 37.98 1994 -23.06 23.06 13.23 13.23 19.52 1995 -2.05 2.05 42.81 42.81 22.85 1996 3.24 3.24 24.36 24.36 45.86 1997 -19.03 19.03 44.83 44.83 39.58 1998 15.29 15.29 8.97 8.97 32.92
REVENUE OUTLAYS Year FV (1) AFV (2) (3) FV AFV (4) Actual Budget Deficit (5) 1999 6.08 6.08 5.03 5.03 49.22 2000 3.11 3.11 -0.73 0.73 40.38 2001 6.45 6.45 -4.19 4.19 57.57 2002 7.24 7.24 21.37 21.37 54.10 2003 -2.41 2.41 -5.25 5.25 41.53 Mean -8.98 13.49 14.73 16.58 29.23 Std. Dev. 14.98 10.88 16.15 14.16 15.38
Note: FV and AFV indicate Forecast Variation and Absolute Forecast Variation respectively.
Similar results as the above can also be observed in Table 2. To consider accuracy of budget forecasting, the direction of error, i.e. the sign, is not necessary, but existence of BFVs. As accurate forecasting can be explained with no BFV, i.e. the ratio is equal to zero, we can therefore check out the extent to which whether budget-makers had BFVs during the sample period. Looking at the column FV for revenue, one can observe that budget-makers could not be successful in forecasting revenues with zero variation, even not close to zero. Taking, for example, 1982 financial year into account, revenue FV occurred as %13.84, indicating to over-forecasted revenue. Similar result can also be observed for the ratios of FE for revenue in Table 1, i.e. 13.18 per cent over-forecasted revenue.
In terms of Turkish currency, revenue was initially forecasted as 1,715,640 Million TL, but materialized as 1,515,800 Million TL with the difference of 199,840 Million TL of revenue shortages (State Institute of Statistics, 2001:521). As a result of no accurate forecasting, general budget for the year 1982 materialized with a deficit of 138,910 Million TL. This deficit indicates 9.16 per cent budget FE caused by 13.18 per cent of over-forecasted revenue and 7.61 per cent of over-forecasted outlay (See Table 1 for the year 1982). More obvious and similar results can also be observed for the other observed years, excluding the year 1985.
Looking at the year 1985’s budget deficit, it seems that budget-makers had accurate forecasting with the ratio of 0.58 per cent deficit. However, this ratio is based on overall budget result. Considering budget variations with regard to revenue and outlay separately, it is obvious that there are 10.51 per cent budget variation for revenue and 8.50 per cent budget variation for outlay. That means budget-makers could not succeed to forecast revenue and outlay accurately. This shows that relative variations, even small variation in forecasted and materialized budgets by taking forecasted and materialized revenues and outlays separately, can have quite significant impact on the accuracy of the forecasting and impact on the budget balance.
Comparing these findings with Table 1, mean absolute forecast error, MAFE, for revenues materialized as 7.89 per cent, indicating that, for the sample period, the average revenue FE is 7.89 per cent misestimated. Since the SD for this period is 5.97, which is less than the MAFE of 7.89, one may conclude that the absolute error
could reflect deliberate bias. MAFE for outlays, on the other hand, materialized with 9.37 per cent, which is larger than the SD as 7.26, i.e. forecasted outlays do also reflect deliberate bias of budget-makers.
4.2. Analysis of Forecast Errors
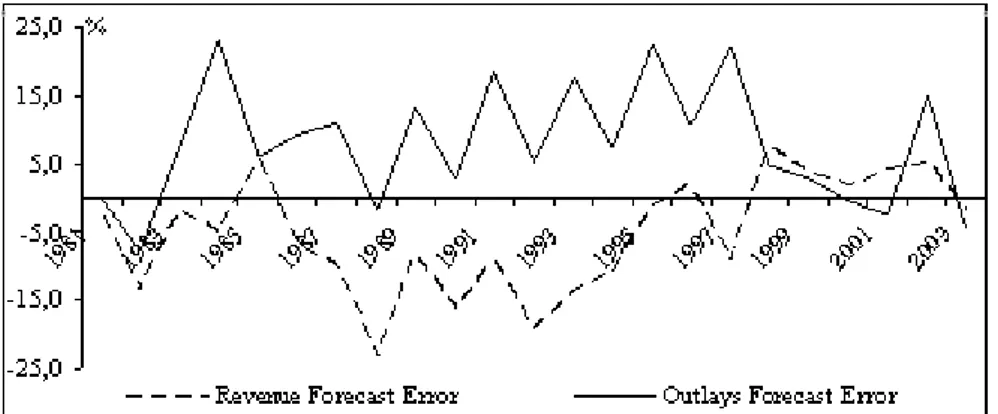
In this section, one sample statistics and one sample t test are used to statistically analyze the hypotheses. Figure 1 outlines FEs for revenue and outlays from 1981 to 2003. A FE below zero indicates that the budget revenue or outlays has over-forecasted and a FE above zero indicates vice versa. An accurate forecast must be equal to materialized revenue or outlay that is, in the figure, shown with the line across zero5.
Figure 1. Comparison of Forecast Errors for Revenue and Outlay, 1981-2003
The figure exposes an inclination toward over-forecasting for budget revenues and under-forecasting for the outlays. For the revenues, it was over-forecasted for 16 out of 23 years and under-forecasted for 7 out of 23 years. For the outlays, it was over-forecasted for 4 out of 23 years and under-over-forecasted for 19 out of 23 years. Comparing MFEs for both revenues and outlays for the period studied, it is obvious that the MFE for revenues is smaller than the MFE for outlays; the value of MFE for revenues is -5.33 and the value of MFE for outlays is 7.93 (see Table 1).
Figure 2 shows AFEs for both revenues and outlays. In this figure, we are only interested in absolute magnitudes of the FEs and therefore directions of FEs are disregarded. Any FE, for either revenue or outlay, over or under the zero line is taken as the FE that we do not need here to know its sing but its magnitude. Our interest rather here is to focus on whether budget-makers had statistically significant FE or not. If the magnitude of FE is equal, or close, to zero, that means there does not occur budget FE for that year, i.e. revenues or outlays were perfectly forecasted.
Figure 2. Absolute Forecast Error for Revenue and Outlay, 1981-2003
Disregarding small deviations in Figure 2, i.e. deviations close to zero –say up to 2 per cent, it is seen that revenues for 18 out of 23 years and outlays for 20 out of 23 years were mis-forecasted; there is no accuracy in forecasting for the sample period. MAFE appears as 7.89 for revenues and as 7.93 for outlays.
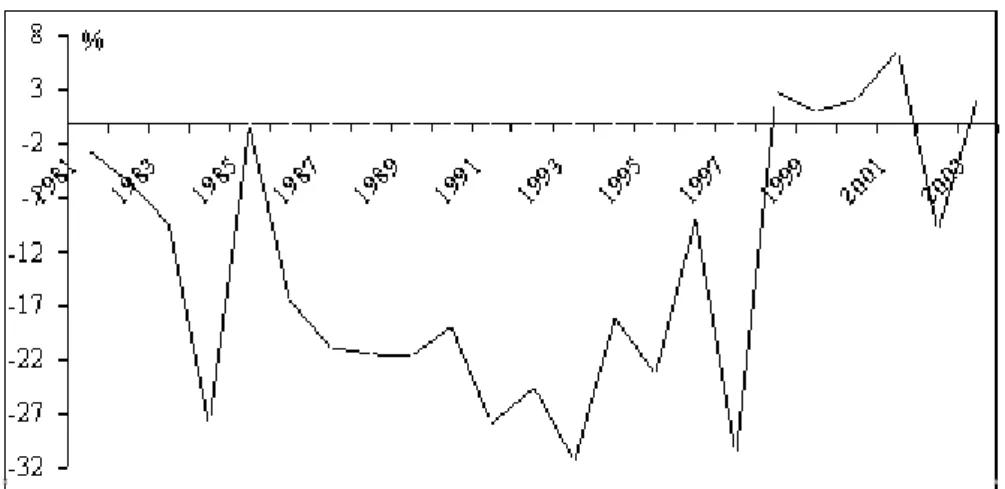
Figure 3 gives us combined FEs of revenue and outlay; i.e. FEs for overall budget.
Figure 3. Budget Forecast Errors, 1981-2003
In Figure 3, the values are obtained by subtracting FEs for outlays from the FEs for revenues. Over/under-forecasts in both revenue and outlay offset budget FEs towards the zero line, while over/under-forecasts in revenues and under/over-forecasts in outlays remove budget FE at somewhere far away from the zero line. Taking, for example, the values for the year 1984 into account in Table 1, the value of -5.05 per cent FE for revenue is subtracted from the value of 23.04 per cent FE for outlay and obtained the value of -28.09 per cent of general budget FE.
For the period analyzed here, it seems obvious that budget-makers had major FEs with the value of 14.58 MFE and the value of 10.53 SD. Disregarding small deviations close to zero, it is shown in Figure 3 that the majority, 21 out of 23, of the
period budgets were mis-forecasted; no accuracy is found for budget forecasts in the period, exception with the years 1985 and 1999. In 1985 and 1999 budgets were forecasted with FEs close to zero, i.e. 0.55 and 1.00 per cent of FEs respectively.
4.3. One Sample t Test
In this section, it is analyzed to find out whether MFEs differs from the specified constant of zero at the 95% confidence level. Since the accuracy is determined with no forecast error, any difference of MFEs, either with negative or positive, will let us to reject the null-hypothesis of accurate forecasting.
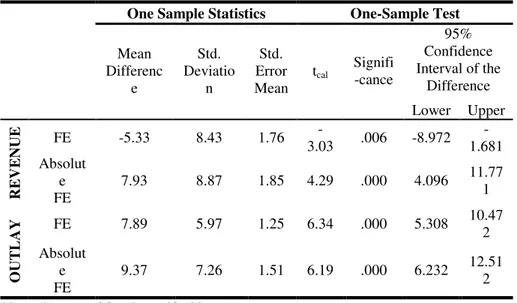
Table 3 presents the results of one sample statistics and t tests of FEs for both revenues and outlays.
Table 3. One-Sample T test
One Sample Statistics One-Sample Test
95% Confidence Interval of the Difference Mean Differenc e Std. Deviatio n Std. Error Mean tcal Signifi -cance Lower Upper FE -5.33 8.43 1.76 3.03 - .006 -8.972 1.681 -R E V E N U E Absolut e FE 7.93 8.87 1.85 4.29 .000 4.096 11.771 FE 7.89 5.97 1.25 6.34 .000 5.308 10.472 O U T L A Y Absolut e FE 9.37 7.26 1.51 6.19 .000 6.232 12.512 Note: degrees of freedom (df): 22.
In Table 3, it is, firstly, analyzed to find answer to whether the null-hypothesis H0 of
revenue and outlay are equal to zero is accepted. With 22 degrees of freedom6, df,
and at 0.05 significance level7, since the tabulated, t
tab8, value of 2.079 is small than
the calculated, tcal, values of -3.03, 4.29, 6.34, and 6.19, H0 cannot statistically be
accepted. In other words, MFEs made during the sample period is far away from
6 Degrees of freedom (df) = (n – 1).
7 Hereafter, all the statistical results were obtained with 22 degrees of freedom and at 0.05
significance level.
8 It denotes to critical value that is the value of a test statistic at or beyond the rejection of null
hypothesis. It is the actual score that cuts off the lowest 5% of the distribution that is called the critical value.
zero, i.e. at a 95 per cent confidence interval, the MFEs of revenues and outlays do not fall inside the calculated confidence intervals.
Secondly, one sample t test is applied to test hypothesis H1 of revenues are over or
under-forecasted. The test result shows that since the ttab value of 2.07 is less than
the tcal value of 4.29, H1 cannot statistically be rejected, i.e. revenues are over or
under-forecasted; large difference occurs between the MFE value of 7.93 and accurate budget forecast value of zero.
Regarding the hypothesis H3 of revenues are overforecasted, the MFE value of
-5.33 is bigger than the ttab value of 1.72.10; i.e. the hypothesis H3 cannot statistically
be rejected.
Regarding the hypothesis H2 of outlays are over or under-forecasted, since the ttab
value of 2.07 is less than the tcal value of 6.19, the assumption of outlays are over or
under-forecasted cannot statistically be rejected. In other words, the MFE value of 9.37 is far away from the value of zero.
In terms of the hypothesis H4 of outlays are under-forecasted, as a result of the
statistical results showing the ttab value of 1.72 is less than the tcal value of 6.34, H4
cannot statistically be rejected. Once again, the MFE value of 7.89 is far away from the perfect forecast value of zero.
5. Conclusion
This paper statistically analyzed accuracy of general budget forecasting in Turkey for the sample period 1981-2003. As statistical tool, tabulated, one sample statistics and one sample t test are applied to test the two main assumptions of there is no accuracy for budget forecasting and revenues/outlays are deliberately over/under-forecasted. The data based on both forecasted and materialized general budget revenues and outlays.
Regarding the first assumption, statistical results have shown that, during the sample period, there is no accuracy in budget forecasting, neither for revenue nor for outlays. The budget-makers had significantly made FEs that are bigger than the value of zero. The findings of one sample t tests also showed that over-forecasting for revenues and under-forecasting for outlays are statistically significant
From these findings it can be concluded that budget-makers had acted cautiously in budget forecasting in a way that their forecasts are deliberately biased; outlays had been purposefully under-forecasted so as not to stand against the will of citizenry’s less tax payment, while revenues had been over-forecasted so as initially to make balanced budget. Outlays were then, during the midcourse of each financial year, amended to spend more. Unfortunately, they were not able to amend revenues in terms of rising taxes, but applying borrowing.
Overall, inaccurate forecasts in budget revenues and outlays were occurred during the period and the implication of this study is that budget-makers might pay some
10 Since the hypothesis three assumes that revenues are over-forecasted, one the direction of
attentions on the magnitudes of the FE ratios so that the accuracy in budgeting would be achieved in the future.
References
AUERBACH, A. (1999) On the Performance and Use of Government Revenue Forecasts, National Tax Journal, 52 (4), pp. 767-82.
AUSTRALIAN NATIONAL AUDIT OFFICE (1999) Management of
Commonwealth Budgetary Process: Preliminary Study, Audit Report No:
38/1998-99, Canberra ACT.
BA D GEN, M. (2002) How Accurate is Revenue Forecasting in Turkey: An Empirical Analysis, Yapı Kredi Economic Review, 13(2), pp. 29-37.
BAHL, R. (1980) Revenue and Expenditure Forecasting by State and Local Governments. In Peterson, J.E. and et al. eds. State and Local Government
Finance and Financial Management, Washington, D.C., Finance Research
Center.
BRETSCHNEIDER, S.I. and GORR, W.L. (1987) State and Local Government Revenue Forecasting. In Makridakis, S. and Whellwrigth, S.C. eds. The
Handbook of Forecasting, New York, John Wiley, pp. 118-134.
GENERAL DIRECTOR OF REVENUE (2004) Tax Statistics (Internet), Available from: <http://www.gelirler.gov.tr/gelir2.nsf> (Accessed October 28, 2004). GENERAL DIRECTOR OF PUBLIC ACCOUNTS (2004) Public Accounts
Bulletin (Internet), Available from: <http://www.muhasebat.gov.tr/mbulten/T3-1-10.htm> and <http://www.muhasebat.gov.tr/mbulten/T4-1-3.htm> (Accessed October 28, 2004)
GRANOF, M.H. (1978) Financial Forecasting in Municipalities: How Accurate,
Government Accountants Journal, Winter, 1977-78, pp. 18-25.
KLIESEN, K.L. and THORNTON, D.L. (2001) The Expected Federal Budget Surplus: How Much Confidence Should the Public and Policymakers Place in the Projections?, Federal Reserve Bank of St. Louis Review, 83 (2), pp. 11-24. MAYPER, A.G., GRANOF, M. and GIROUX, G. (1991) An Analysis of Municipal
Budget Variances, Accounting, Auditing and Accountability Journal, 4 (1), pp. 29-50.
RODGERS, R. and JOYCE, P. (1996) The Effect of Underforecasting on the Accuracy of Revenue Forecasts by State Governments, Public Administration
Review, 56 (1), pp. 48-56.
SCHOEDER, L. (1982) Local Government Multi-Year Budgetary Forecasting: Some Administrative and Political Issues, Public Administration Review, 42 (2), pp. 121-127.
STATE INSTITUTE OF STATISTICS (2001) Statistical Indicators, 1923-1998, State Institute of Statistics, Printing Division, Ankara.
VASCHE, J.D. and WILLIAMS, B. (1987) Optimal Governmental Budgeting Contingency Reserve Funds, Public Budgeting and Finance, Spring, pp. 66-82. WILLIAMS, B., INGENITO, R. and VASCHE, J.D. (1999) Forecasting Revenue
Receipts in the States: Current Challenges in California, National Tax Journal, LII (3), pp. 361-371.