41
Kinetic Study on the OSL Technique Using
Human Blood Sample
Kemal Koç*1, Güneş Tanır2 ,Gülper Aksoy3, M. Hicabi Bölükdemir2
ABSTRACT
It is clear that humans are exposed to ionizing radiation both of internally or externally in radiotherapy. The determination of ionizing radiation dose in human blood has been previously performed by us using optically stimulated luminescence technique. OSL technique is based on measuring the luminescence intensity from a sample that has been exposed to ionizing radiation. In this study, the detrapping constants for human blood samples were investigated using Curve-Fitting, Active OSL-Approximation and Linear Modulation techniques. The Active OSL-Approximation was based on the radioactive decay law of successive disintegration. It allows obtaining the peak forms of luminescence signal. It has been observed that the decay rates for blood sample exposed to different radiation doses were changed with dose. AOSL- Approximation is appropriate for separating the peaks that correspond to decay rates.
Key Words: Active-OSL-Approximation, Radioactive Decay, Kinetic Parameters of OSL, Deconvolution
DOI Number: 10.14704/nq.2018.16.4.1278 NeuroQuantology 2018; 16(4):41-46
Introduction
When the Optically stimulated luminescence (OSL) signals, were detected using constant excitation intensity, it is called continuous-wave OSL (CW-OSL). The measured CW-OSL decay curve has an approximately exponential form. Deconvolution of luminescence decay curve from different samples has been studied by many researchers (Bailiff and Poolton, 1991; Bailiff and Barnet, 1994, Smith and Rhodes, 1994; McEwen and Chen, 1997; Tanır and Bölükdemir, 2010). Most of the studies have shown that there are several overlapping OSL signals, each having different detrapping constants (Bailey et al., 1997; Adamiec, 2005; Kitis et al., 2002). Also, there are several reports on the analysis of CW-OSL decay curve. One of them is the Linear Modulation techniques (LM-OSL) (Bulur, 1996; Larsen et al., 2000; Singrayer and Bailey, 2003). The OSL signals using LM-OSL is in the peak form
and kinetic parameters of the traps can be obtained. Kirsh and Chen, 1991, reported that the parameters can be determined by plotting peak-shape curves (PS-plot).
The application of Active Optically Stimulated Luminescence Approximation (AOSL-A) has been suggested by us brings a new perspective to the luminescence mechanism. AOSL-A has been based on the decay of a radioactive nucleus and the details of it were explained in our previous works (Tanır and Bölükdemir, 2010; 2011).
In this study, the detrapping constants of OSL decay curve from human blood samples were obtained by using experimental data that have been published by Tanır et al., 2016. The results were compared with that of LM-OSL from the same samples.
Corresponding author: Kemal Koç
Address: 1Başkent University, Faculty of Education, 06530 Bağlıca/Ankara/Türkiye; 2Gazi University, Faculty of Science, 06500
Teknikokullar/Ankara/Türkiye; 3Gazi University, Institutes of Sciences, Teknikokullar/Ankara/Türkiye e-mail [email protected]
Relevant conflicts of interest/financial disclosures: The authors declare that the research was conducted in the absence of any commercial
or financial relationships that could be construed as a potential conflict of interest.
42 Methods
Materials
The luminescence signal from blood samples was read using the ELSEC 9010 OSL system(Spooner et al., 1990) as well as the Risø TL/OSL-DA-20 automatic system (Nutech, Technical University of Denmark). The photomultiplier (PM) tube used in the experiments were bialkali EMI 9235QA for ELSEC 9010 and EMI 9235QB15 for Risø TL/OSL systems. All aliquots were left at RT for 72 h before measuring and shielded from sunlight. The more detailed explanation on this section can be found in our previous paper (Tanır et al., 2016). Simple description of the AOSL approximation A short description of the AOSL-A was given in this section. More extensive exposition can be seen by our study in Tanır and Bölükdemir, 2010. Figure 1 shows the schematic AOSL-A. The arrows indicate all of the allowed transitions. The process is similar to the successive decay of a radioactive element but not identical. It was assumed that the absorption of energy from an ionizing radiation source by the human blood causes the trapping states composed of shallow or dosimetric traps. Additionally, the other assumption was that optic light stimulates the trapped electrons in shallow traps into the conduction band at rate λ1, followed not only by recombination with trapped holes but also localization by dosimetric traps. Consequently, the delocalized charges from dosimetric traps go either to the shallow traps or to the conduction band then back to recombination centers to produce the OSL (Tanır and Bölükdemir, 2010).
Accordingly, the Equations describing the OSL counts and the activity (or OSL intensity) are proposed as follows (Tanır and Bölükdemir, 2010):
(1)
(2)
Equation (1) describes the luminescence signals counted experimentally over finite time intervals. N1 is the number of atoms of parent nucleus which decays λ1 into its daughter nucleus; and N2 is the number of daughter nucleus with λ2 decay
constant into a stable element having N3 stable atoms.
Figure1. The schematic diagram of the proposed paths for
movement of charges in samples during optical stimulation. The trapped electron concentrations are N10, N20 and N30 at
t=0 (Tanır and Bölükdemir, 2010).
N1 (t= 0) = N10 and N2 (t=0) = N20. While Equation (1) can be used to plot the OSL decay curves, Equation (2) was used to find the parameters of OSL from human blood sample. It is important to note here, for the compensation of theoretical and experimental data the term λ2 should be inserted in the nominator of the second term in Equation (1). This situation is different from radioactive decay law. Radioactive decay law of successive disintegration can be found in a book written by Krane, 1988.
Linear Modulation Technique (LM-OSL)
LM-OSL technique has been suggested by Bulur, 1996. This technique transforms CW-OSL signal into a peak-shape form. The details of the transformation process are also indicated in the study by Bulur, 2000. CW-OSL decay curve for the first-order kinetic of a material that consisting of one trap and one recombination center is described as follow (Kitis and Pagonis, 2008):
exp 2
where n0 is the initial trap concentration; b describes the decay constant of luminescence curve.
43 Results
During the measurements, the three different procedures were realized: In the section 4.1, the waste blood sample of a patient undergoing radioisotope treatment was used; in the section 4.2, the blood serum not subjected to radioisotope treatment was put in a tube and injected to 99mTc in the OSL laboratory. And, in the section 4.3, The LM-OSL technique was applied to the same experimental data from human blood samples. All the experimental data (in Section 4.1 and 4.2) was fitted by the equation y= a exp (-bx)+ c exp (-dx). After the constants of a, b, c and d were determined, they were inserted to Equation 2, and the graphs (PS-plot) t. I(t ) versus ln(t) were plotted. It should be noted that the experimental data would be directly fitted to Equation
Blood sample of a patient undergoing radioisotope treatment
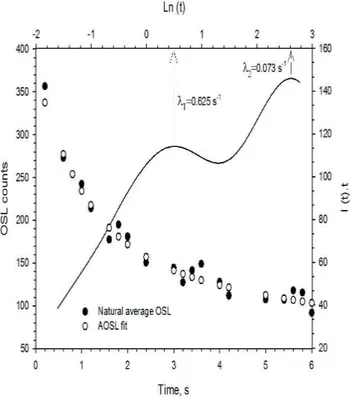
The waste blood sample of a patient undergoing radioisotope treatment was provided from the Nuclear Medicine Center of Ankara University. The natural luminescence counts (from aliquots doses that were not given in the OSL laboratory) were measured. The background counts were subtracted from the total luminescence counts. Natural luminescence measurements were repeated by using three different aliquots. Figure 2 shows the average natural luminescence decay curve from two blood aliquots that plotted using both experimentally and AOSL approximation. In Fig.2, PS- graph was shown using the AOSL approximation. The decay rates from PS plots were listed in Table 1. The decay rates (λ1 = shallow traps and λ2 = dosimetric traps) were clearly observed from the AOSL-A.
One of the aliquots was exposed to four different laboratory radiation doses, 1Gy, 2Gy, 3Gy and 5Gy, using a 90Sr–90Y beta source. The other aliquot was exposed to five different laboratory radiation doses, 0.143Gy, 0.286Gy, 0.429Gy, 0.572Gy, 0.715Gy and 0.858Gy. The algorithm for the measurements was as follows: the natural luminescence counts were measured at 50 s; the bleached aliquot was exposed to the dose and its luminescence counts were re-measured at 50 s.
Figure 3 was based on the counts from the aliquot exposed to 1Gy, 2Gy, 3Gy and 5Gy doses and the Figure 4 from aliquot subjected to the lower doses. The decay rates of them were also shown in Table 1 and under the Figures.
Figure 2. The average natural counts from two blood disc
prepared from a patient undergoing radioisotope treatment. b=0.917, d= 0.073; s (standard deviation) = 8.93, r (correlation coefficient) = 0.99. Solid line: PS-graph plotted using AOSL-A. λ1 corresponds to b = 0.62 s-1λ2 corresponds
tod=0.073 s-1
Figure 3. The PS-plots using AOSL-Approximation. The blood
44
Figure 4. The PS-graphs using AOSL-A
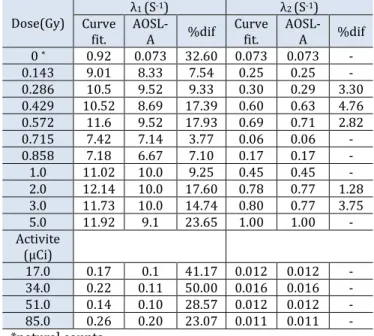
Table1. The detrapping constants using curve-fitting, AOSL-A
and the percentage difference Dose(Gy) λ1 (S-1) λ2 (S-1) Curve fit. AOSL-A %dif Curve fit. AOSL-A %dif 0 * 0.92 0.073 32.60 0.073 0.073 - 0.143 9.01 8.33 7.54 0.25 0.25 - 0.286 10.5 9.52 9.33 0.30 0.29 3.30 0.429 10.52 8.69 17.39 0.60 0.63 4.76 0.572 11.6 9.52 17.93 0.69 0.71 2.82 0.715 7.42 7.14 3.77 0.06 0.06 - 0.858 7.18 6.67 7.10 0.17 0.17 - 1.0 11.02 10.0 9.25 0.45 0.45 - 2.0 12.14 10.0 17.60 0.78 0.77 1.28 3.0 11.73 10.0 14.74 0.80 0.77 3.75 5.0 11.92 9.1 23.65 1.00 1.00 - Activite (μCi) 17.0 0.17 0.1 41.17 0.012 0.012 - 34.0 0.22 0.11 50.00 0.016 0.016 - 51.0 0.14 0.10 28.57 0.012 0.012 - 85.0 0.26 0.20 23.07 0.011 0.011 - *natural counts
Blood serum that was subjected to 99mTc
The blood serum that was not subjected to radioisotope treatment was put into a tube that was 1 cm in diameter and 3.5 cm in length. As a next step, 1.530 ± 0.103mCi of 99mTc was injected into the tube. After the mixture was left at RT for 72 h in a dark room dropped onto the Al discs as follows: one drop on one of the discs, two drops on another disc, and three and five drops on the others. These aliquots were dried at RT and shielded from sunlight. The activity of one drop
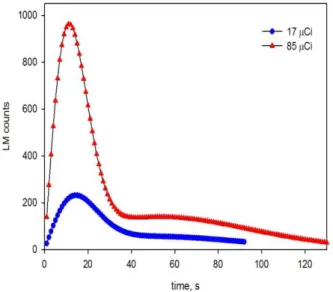
was calculated assuming uniform distribution. The activities of the aliquots were 17μCi, 34μCi, 51μCi, and 85μCi. The integrated luminescence counts were measured at 50 s. The Fig. 5 shows the experimental luminescence decay curves fromthese aliquots. As seen from Fig. 5, the raise in activity has increased luminescence counting on the aliquots. The PS graphs using AOSL approximation from them were plotted in Fig. 6. The detrapping constants corresponding peaks values were shown on the graphs.
Figure 5. Decay curves from the blood aliquots injected to
17μCi, 34μCi, 51μCi, and 85μCi.This figure was taken from Tanır et al., 2016.
Figure 6. PS-plots of the experimental decay curves data in
Figure 5 using AOSL-A 0 5000 10000 15000 20000 25000 30000 0 10 20 30 40 50 C o u n ts ( a .u ) Time (s) 17 34 51 85
45 The LM plots from blood sample
The luminescence counts from natural aliquots and the irradiated aliquots were used to plot the LM-OSL graphs. (Fig.7 and 8).
As it can be seen the peaks were not clearly seen as that of AOSL-A. LM-OSL graphs need re-deconvolution.
As the results,
The optical decay constants were obtained using the curve-fitting programmer from the experimental data and inserted in equation (2). A function I(t)×t versus ln t (PS-plot) was plotted. It gives the PS presentation of OSL decay curve. The two peaks of the PS curve become apparent at which correspond to the two optically sensitive electron traps. The detrapping rates, λ1 and λ2, can be exactly found from these Figures. It is obviously seen that the peaks could be also displayed apparently.
Even the blood samples were bleached to the smallest heating process excluding to the room temperature. So, it can be concluded that the high decay rates (λ1) corresponds the shallow traps that are unstable. In the AOSL Approximation, delocalized charges can be retrapped in the same traps, or others. This only changes the trap concentrations. The decay constants of dosimetric traps (λ2) can be exactly obtained using AOSL –Approximation. It is known that the dosimetric traps are more stable than others (λ1). The dosimetric traps have great importance and also they should be assumed to be the dominate signals in the equivalent dose measurements. It is enough that the experimental signal versus time should be only fitted to equation (1) or (2) to obtain the kinetic parameters in AOSL-A model. The residuals do not show any systematic trends for all the graphics. Using AOSL-A model, it is possible to discriminate overlapping signals and to obtain the decay constants and trap concentrations.
AOSL-A allows clearly observing peak forms of the OSL curves in the PS-presentation and the physical parameters of the decay can be quickly obtained. It provides a precise and an accurate determination of the OSL luminescence parameters. AOSL-A is a practical way to obtain the kinetic parameters of OSL mechanisms. The values of r (correlation coefficients) obtained from curve-fitting procedure were found as 0.999. Figuıre 7 and 8 show the PS-plot for LM-OSL from blood aliquot. The two peaks were not displayed as obviously as that of AOSL Approximation.
Figure 7. LM-OSL graphs for natural aliquot, 0.143Gy, 1Gy,
5Gy and 17μCi, 85μCi
Figure 8. LM-OSL graphs for blood aliquot injected to 17μCi
and 85μCi Conclusion
AOSL-A allows clearly observing peak forms of the OSL curves from blood sample in the PS-presentation and the physical parameters of the decay can be quickly obtained. It provides a precise and an accurate determination of the OSL luminescence parameters. AOSL-A is a practical way to obtain the kinetic parameters of OSL mechanisms.
References
Adamiec G. OSL decay curves—relationship between single-and multiple-grain aliquots. Radiation Measurements 2005; 39(1):63-75.
Larsen NA, Bulur E, Bøtter-Jensen L, McKeever SW. Use of the LM-OSL technique for the detection of partial bleaching in quartz. Radiation Measurements 2000; 32(5-6):419-25.
46 Bailey RM, Smith BW, Rhodes EJ. Partial bleaching and the
decay form characteristics of quartz OSL. Radiation Measurements 1997; 27(2):123-36.
Bailiff IK, Barnett SM. Characteristics of infrared-stimulated luminescence from a feldspar at low temperatures. Radiation Measurements 1994; 23(2-3):541-45.
Bailiff IK, Poolton NR. Studies of charge transfer mechanisms in feldspars. International Journal of Radiation Applications and Instrumentation. Part D. Nuclear Tracks and Radiation Measurements 1991; 18(1-2):111-18. Bulur E. An alternative technique for optically stimulated
luminescence (OSL) experiment. Radiation Measurements 1996; 26(5):701-09.
Bulur E. A simple transformation for converting CW-OSL curves to LM-OSL curves. Radiation Measurements 2000; 32(2):141-45.
Kirsh Y, Chen R. Analysis of the blue phosphorescence of x-irradiated albite using a TL-like presentation. International Journal of Radiation Applications and Instrumentation. Part D. Nuclear Tracks and Radiation Measurements 1991; 18(1-2):37-40.
Kitis G, Pagonis V. Computerized curve deconvolution analysis for LM-OSL. Radiation Measurements 2008; 43(2-6):737-41.
Kitis G, Liritzis I, Vafeiadou A. Deconvolution of optical stimulated luminescence decay curves. Journal of
Radioanalytical and Nuclear Chemistry 2002; 254(1):143-49.
Krane K. Introductory Nuclear Physics, New York: John Wiley and Sons, 1988.
McKeewer SWS and Chen R, 1997. Luminescence Models. Radiat. Meas. 27: 525-661.
Singarayer JS, Bailey RM. Further investigations of the quartz optically stimulated luminescence components using linear modulation. Radiation Measurements 2003; 37(4-5):451-58.
Smith BW, Rhodes EJ. Charge movements in quartz and their relevance to optical dating. Radiation Measurements 1994; 23(2-3):329-33.
Spooner NA, Aitken MJ, Smith BW, Franks M, McElroy C. Archaeological dating by infrared-stimulated luminescence using a diode array. Radiation Protection Dosimetry 1990; 34(1-4):83-86.
Tanır AG, Bölükdemir MH. Application of active-OSL Approximation to some experimental optical stimulated luminescence decay. Turkish Journal of Physics 2011; 35(3):265-72.
Tanır G, Bölükdemir MH. An alternative view on the kinetics of optical stimulated luminescence decay. Journal of Radioanalytical and Nuclear Chemistry 2010; 285(3):563-68.