Dielectric Properties of Opium Poppy Seed
Kâmil SAÇILIK1 Ahmet ÇOLAK1Geliş Tarihi: 06.12.2004
Abstract : The dielectric properties of poppy seed were determined over the frequency range from 50 kHz to 10
MHz at moisture content in a range of 6.12-22.47% dry basis (d.b.) with bulk density changing between 541.99 and 626.37 kg/m3 using parallel-plate capacitor sample holder. The dielectric constant, loss factor, loss tangent and the a.c. conductivity was greatly influenced by the moisture content, bulk density and frequency. The moisture content was the most significant factor affecting the dielectric properties of poppy seed. The dielectric constant and loss factor increased with an increase in moisture content and bulk density and with a decrease in frequency. The dependence of the loss factor and loss tangent on frequency was less regular than that of the dielectric constant. The a.c. conductivity was observed to increase more rapidly with increasing moisture contents than with increasing frequencies. Also, two models have been shown to estimate adequately the dielectric constant and loss factor of poppy seed within the investigated moisture content, bulk density and frequency range.
Key Words : Dielectric constant; loss factor, loss tangent; conductivity; poppy seed
Haşhaş Tohumunun Dielektrik Özellikleri
Öz : Haşhaş tohumunun dielekriksel özellikleri; %6.12-22.47 k.b. (kuru baz) nem, 541.99-626.37 kg/m3 hacim ağırlığı ve 50 kHz-10 MHz frekans aralığında paralel plakalı kondansatör tohum kutusu yardımıyla belirlenmiştir. Dielektrik sabiti, kayıp faktörü, kayıp tanjantı ve iletkenlik değerleri, nem, hacim ağırlığı ve frekanstan büyük ölçüde etkilenmiştir. Tohum nemi, haşhaşın dilektriksel özelliklerini etkileyen en önemli parametre olmuştur. Dielektrik sabiti ve kayıp faktörü, tohumun nemi ve hacim ağırlığıyla artarken uygulanan frekansla azalma göstermiştir. Dielektirik katsayısının uygulanan frekansa bağlı değişimi, kayıp faktörü ve kayıp tanjantına gore daha düzenli olmuştur. İletkenlik değerleri, artan frekanstan ziyade artan nem içeriğiyle daha hızlı bir artış göstermiştir. bir değişim göstermiştir. Ayrıca her iki modelin, çalışma aralığı içerisinde haşhaş tohumunun dielektrik katsayısı ve kayıp faktörünü yeterince tahmin edebildiği görülmüştür.
Anahtar Kelimeler : Dielektrik sabiti; kayıp faktörü; kayıp tanjant, iletkenlik; haşhaş tohumu
1Ankara Üniv. Faculty of Agriculture Department of Agricultural Machinary-Ankara Introduction
Opium poppy seed (Papaver somniferum L.), is one of the oldest cultivated plants in the world and is important in human diets due to its 44-54% oil (Incekara 1979). It is a small, sphere and highly nutritious seed which weighs between 0.3 and 0.5 g per 1000 seeds. It is mainly used for baking and confectionery goods. Currently, the estimated world production is virtually 88 000 t per year. It is one of the important oilseed crops of Turkey and is cultivated on 40000 ha with an annual production of 20000 t. Turkey ranks second among poppy seed producing countries in the world after Czech Republic in 2003 (Anonymous 2004).
Dielectric properties of agricultural materials and products are finding increasing application as new technology is adapted for use in agriculture and related industries. The dielectric properties of these materials are important in the design of electrical and electronics equipment and suitable techniques for measuring these properties for various applications have been developed as they were needed (Nelson 1999). The dielectric properties as well as other physical properties of cereal grains and oilseeds are required to give insight into the interaction between materials and radio and microwave frequency energy when materials were subjected to intense radio frequency or microwave electric fields. The
dielectric properties of cereal grains or oilseeds are of interest for many purposes. In agriculture, the dielectric properties of grains have been widely used to determine the moisture content of grain because of their usefulness for rapid moisture sensing method. Sensing of the moisture content relies on the correlations between the dielectric properties of grains and the amount of water present in the grains. The dielectric properties of grains is primarily proportional to the mass of water in the sample, because the relative permittivity of water is about 80 while that of dry grain matter is less than three. Thus, it is relatively easy to sense the mass of water within a grain sample using dielectric properties (Lawrence et al, 1998, Nelson and Bartley 2000). The dielectric properties of grains are also of importance in the design of equipment for radiofrequency or microwave dielectric heating applications and potential agricultural applications such as the grain drying, seed treatment to improve germination and insect control in stored grain using high-frequency and microwave electric fields (Nelson 1992).
Permittivity or dielectric property is a complex quantity commonly used to describe the electrical properties that influence reflection of electromagnetic waves at interfaces and the attenuation of the wave energy within materials (Ikediala et al. 2000). The complex relative permittivity ε* of a material can be
defined in the following complex form:
ε* = ε' - jε''
(1)where ε' is the dielectric constant or relative permittivity and ε'' is the dielectric loss factor.
The real part, ε', the dielectric constant, indicates the ability of a material to store energy from the electric field of the electromagnetic wave and the imaginary part, ε'', the dielectric loss factor, suggests the ability of a material to dissipate energy (Trabelsi et al. 1999). Loss tangent tan δ is also often used as the power dissipation in a dielectric and can be expressed as follows:
'
"
tan
ε
ε
=
δ
(2) The a.c conductivity of the dielectric can be given by following equation (Nelson & Bartley 2000):"
0
ε
ωε
σ
=
(3) where σ is the a.c. conductivity in S/m, ω is the angular frequency in rad/s and ε0 is the permittivity of the freespace in 8.854 pF/m.
In general, the dielectric properties of cereal grains and oilseed crops depend on moisture content, bulk density, temperature and frequency used. The effect of these parameters on the dielectric properties of grains or oilseeds has been reported by various researchers (Nelson 1965, Jorgenson et al. 1970, Stetson and Nelson 1970, Sokhansanj and Nelson 1988, Noh and Nelson 1989, Kraszewski and Nelson 1991, Lawrence and Nelson 1993, Nelson and Lawrence 1994, Lawrence et al. 1998, Lawrence et al. 2001, Kim et al. 2003, Boldor et al. 2004). Until now, no data on the dielectric properties of opium poppy seed have been reported in the literature or compiled in the ASAE standard D293.2 (ASAE 2002a). Therefore, this present study was carried out to determine the dielectric properties of static samples of poppy seed at excitation frequencies in a range of 50 kHz-10 MHz for the moisture content range of 6.12-22.47% d.b. with bulk density changing between 541.99 and 626.37 kg/m3.
Material and Methods
The poppy seeds were purchased from a local market of Sungurlu, Çorum for this study. They were stored at an ambient temperature of 21±2°C in plastic bags until any conditioning. Before the experiments, the seeds were cleaned manually to remove foreign matter, broken and immature seeds. The initial moisture content of the seed was determined by placing three samples, each weighing about 10 g, in a convective oven at 130±1°C for 4 h (ASAE 2002b). The average moisture content was found to be a moisture content of 6.12% d.b.
In order to determine the effect of moisture content on the dielectric properties of poppy seed, the test samples were conditioned to obtain different moisture contents in the range of 6.12–22.47% d.b. Samples of
desired moisture level within the above range were prepared by adding calculated amounts of distilled water and sealing in separate plastic bags. The samples were kept at 5ºC in a refrigerator for 15 days for the moisture to distribute uniformly throughout the sample. Before each test, the required quantity of seed was taken out of the refrigerator and allowed to warm up to room temperature for 5 h. Then, each conditioned test sample was divided into two sub-lots which were used independently to perform test runs at two different bulk densities in loose and dense fills. The dielectric properties of poppy seed were conducted at the moisture content levels of 6.12, 9.91, 14.07, 18.49 and 22.47% d.b.
The dielectric properties of concern in handling, drying and storage of grains are the dielectric constant ε', dielectric loss factor ε'', loss tangent tan δ and a.c. conductivity σ. To determine the dielectric properties of any granular material, two of the preceding four parameters must be measured (Berbert et al. 2001). The dielectric measurements necessary for the dielectric constant and the dielectric loss factor were determined using a Hewlett-Packard 4192A LF Impedance Analyzer in the measurement range of 5 Hz-13 MHz. The impedance Analyzer was connected to a parallel-plate capacitor or sample holder in which the test samples were confined. The parallel-plate capacitor was designed with 99.7 mm by 70.1 mm copper plates, separated by a distance of 19.4 mm. The total volume of the sample holder was 1.36x10⁻⁴ m3 and was able to hold about 79 g of poppy seed at a moisture content of 6.12% d.b.
The dielectric constant can be obtained from capacitance measurements of the parallel-plate capacitor with and without the test sample between the plates by the following equation: 0 ' C C = ε (4) where C is the capacitance of the capacitor filled with sample in pF and C0 is the capacitance of the empty
capacitor in pF.
Measurements for each combination of moisture content and bulk density levels were taken at intervals of 10 kHz from 50 to 100 kHz; 100 kHz from 100 kHz to 1 MHz; 1 MHz from 1 MHz to 10 MHz.
In all experiments, the moistened test sample was taken out of the refrigerator and allowed to equilibrate to room temperature for about 5 h prior to electrical measurements. An initial measurement with the empty sample holder (air filled) was taken first. In order to asses the effect of bulk density on the dielectric properties of poppy seeds, two fill methods were used in this study. For a loose fill, the samples prepared were poured into the sample holder from a circular container of 125 ml in volume to the top from a height of about 150 mm at a constant rate. After settling, excess amount was removed by a strike-off stick. The seeds were not compacted in any way and a measuring sequence was initiated. The impedance analyzer was programmed to measure dielectric properties of poppy seed at 28 different
frequencies in the range from 50 kHz to 10 MHz at intervals equally spaced on a logarithmic scale. For a
dense fill, after a required quantity of test sample was loosely filled, the bulk density of the seed was changed by shaking the sample holder for 2 min in an electrically driven shaker. When shaking the sample holder, the height of material was reduced and additional seeds were then included in the sample holder thus increasing the packing density. Each sample bulk density was determined by dividing the sample weight by the volume of the electrode chamber. After dielectric property measurements, the sample holder was emptied and a small portion was taken for moisture content determination to determine if moisture was lost during the measurement procedure. The measurements were conducted out in a laboratory where the temperature was about 23±3°C.
Results and discussion
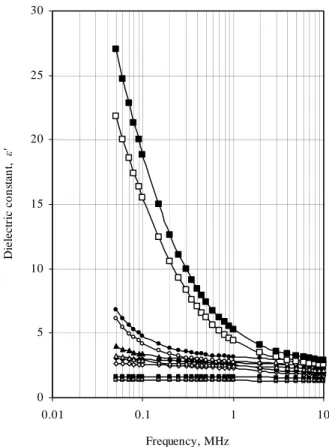
Variation of dielectric constant : Measured value of the dielectric constant as a function of frequency at different moisture contents and bulk densities is shown in Figure 1. At a given moisture content, the dielectric constant was observed to decrease with an increase in frequency of the applied electric field. The same results were obtained with different bulk densities too. As shown in Figure 1, the moisture content was a main dominant factor to the values of ε' in poppy seed as in other grain and oilseed crops. This was because the dielectric constant of water is about 80 while that of the dry grain matter less than three in the radio frequency range (Lawrence et al, 1998). The changes in the values of ε' were lower at lower moisture content than at higher moisture content. Over the frequency range of 50 kHz-10 MHz, the value of ε' for loose fill poppy seed at a moisture content of 6.12% d.b. increased by a ratio of 1.06 while this ratio was 8.56 at a moisture content of 22.47% d.b. Also, the values of ε' increased more rapidly at lower frequencies than at higher frequencies. When the moisture content increased from 6.12 to 22.47% d.b., the values of ε' at the frequency of 50 kHz and 10 MHz were found to increase by about 15.93 and 1.97 times for loose fill, respectively. Similar behaviour has been reported by Stetson and Nelson (1972) and Berbert et al. (2002). To study the effect of bulk density on the dielectric
properties of poppy seed, the values of dielectric constant were determined at two bulk densities, namely loose and dense fill. The bulk density varied from 541.99 to 626.37 kg/m3 in the moisture content range of 6.12-22.47%d.b. Results obtained suggested that with an increase in bulk density at any moisture content, the values of ε' were increased. Denser packing gave rise to reduction in porosity and increase in bulk density. At a moisture content 9.91% d.b. for 1 MHz frequency, dense fill provided an increase in the value of dielectric constant by about 12.51%. It can be stated that the poppy seed at high bulk density offers more the values of ε' because it has less porosity and more bulk density. The results were consistent with the results of Lawrence et al. (1998) for hard red winter wheat, Boldor et al. (2004) for in-shell and shelled peanuts and ASAE standard D293.2(2002). 0 5 10 15 20 25 30 0.01 0.1 1 10 Frequency, MHz Di el ec tr ic co n st a n t, ε'
Figure 1. Frequency dependence of the dielectric constant of poppy seed at various moisture contents and bulk densities: □, 6.12% d.b. (loose); ■, 6.12% d.b. (dense); ◊, 9.91% d.b. (loose); ♦, 9.91% d.b. (dense); ∆; 14.07% d.b. (loose); ▲, 14.07% d.b. (dense); ○, 18.49% d.b. (loose); ●, 18.49% d.b. (dense);
□
, 22.47% d.b. (loose);■
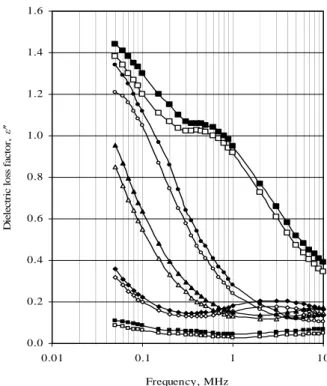
, 22.47% d.b. (dense)Variation of dielectric loss factor : Figure 2 presents the effect of frequency on the dielectric loss factor of poppy seed at different moisture contents and bulk densities. As shown in Figure 2, the frequency dependence of the dielectric loss factor was less regular than that of the dielectric constant. It is clear that the shape of these curves was different for various moisture contents. For loose and dense fill poppy seed at moisture content of 6.12 and 14.07% d.b., the curves representing the variation of the values of ε'' with frequency was very similar. The shape of plots of ε'' for loose and dense fill at 14.07% d.b. decreased curvilinearly from frequencies of 50 kHz to 2 MHz and afterwards, the values increased up to 10 MHz. The same trend was observed for loose and dense fill poppy seed at 5.92% moisture content. However, the changes in the values of ε'' at this moisture content were less than at a moisture content of 14.07% d.b. For loose and dense fill poppy seed at 9.91 and 22.47% d.b. moisture content, the shape of plots became more complex than other moisture contents and was represented by sigmoid-type curves. The values of dielectric loss factor for loose and dense fill at a moisture content of 22.47% d.b. decreased in the range from 50 to 200 kHz, then begun increasing till frequency of 400 kHz and decreasing again from frequencies of 400 kHz to 10
MHz. For loose and dense fill at a moisture content of 9.91% d.b., the values of ε'' decreased curvilinearly from frequencies of 50 to 400 kHz, then begun increasing until frequency of 3 MHz and decreasing again from 3 MHz to 10 MHz. For loose and dense fill at 18.49% d.b. moisture content, the values of ε'' always decreased curvilinearly with increasing frequency from 50 kHz to 10 MHz. Some similar trends observed in this study have been reported by Berber et al. (2001 and 2002) for coffee and bean, respectively.
Results obtained suggested that the values of ε'' increased with an increase in bulk density at any moisture content. For 2 MHz frequency, dense fill provided an increase in the values of dielectric loss factor by about 53.13, 15.06, 14.17, 15.85 and 5.91% at the moisture content of 6.12, 9.91, 14.07, 18.49 and 22.47% d.b., respectively. This increase in the loss factor was due to an increase in bulk density and a reduction in porosity. Similar results have been reported by Lawrence et al. (1998) for hard red winter wheat and Boldor et al. (2004) for in-shell and shelled peanuts.
Variation of loss tangent : The loss factor and frequency relationship for poppy seed at various moisture contents and bulk densities is shown in Figure 3. Of the shape of plot of loss tangent at a moisture content of 22.47% d.b., all trends of loss tangent at moisture content in a range of 6.12-18.49% d.b. were usually observed to be similar to that of dielectric loss factor. For a moisture content of 22.47% d.b., the values of tan δ increased with increasing frequency from 50 kHz to 1 MHz and then, decreased again up to 10 MHz. The loss tangent varies in a way which is very similar to the variation of ε'' on frequency. The crossing of some the curves representing the variation of both ε'' and tan δ on frequency seems difficult to explain (Berbert et al., 2001).
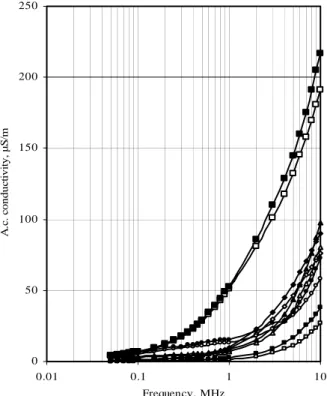
Variation of a.c. conductivity : Figure 4 presents the a.c. conductivity of poppy seed as a function of frequency at various moisture contents and bulk densities. At a given moisture content, the a.c. conductivity increased with an increase in frequency of applied electric field. The same results were obtained with different bulk densities too. It can be seen from Figure 4 that increase in frequency for the same moisture content has a lower effect on a.c. conductivity than increase in moisture content for the same frequency. At a frequency of 50 kHz, when moisture content increased from 6.12 to 18.49% d.b., a.c. conductivity for loose fill poppy seed increased by a ratio of 14.25 while this ratio was 17.40 and 11.52 for the frequencies of 150 and 450 kHz.
However, when the frequency increased from 50 to 150 kHz, the values of σ were found to increase by about 1.77 and 2.16 times at the moisture content of 6.12 and 18.49% d.b., respectively. This indicated that the values of σ increased more rapidly with increasing moisture contents than with increasing frequencies.
Results obtained presented that with an increase in bulk density at any moisture content, the values of σ were increased. For 1 MHz frequency, dense fill provided an increase in the values of σ by about 51.72, 15.26, 16.15, 16.67 and 3.60% at the moisture content of 6.12, 9.91, 14.07, 18.49 and 22.47% d.b., respectively. 0.0 0.2 0.4 0.6 0.8 1.0 1.2 1.4 1.6 0.01 0.1 1 10 Frequency, MHz D iel ec tr ic l o ss f a c to r, ε''
Figure 2. Dependence of the dielectric loss factor of poppy seed on frequency at various moisture contents and bulk densities: □, 6.12% d.b. (loose); ■, 6.12% d.b. (dense); ◊, 9.91% d.b. (loose); ♦, 9.91% d.b. (dense); ∆; 14.07% d.b. (loose); ▲, 14.07% d.b. (dense); ○, 18.49% d.b. (loose); ●, 18.49% d.b. (dense);
□
, 22.47% d.b. (loose);■
, 22.47% d.b. (dense) 0.00 0.05 0.10 0.15 0.20 0.25 0.30 0.01 0.1 1 10 Frequency, MHz L o ss ta nge nt, ta n δFigure 3. Frequency dependence of the loss tangent of poppy seed at various moisture contents and bulk densities:
□
, 6.12% d.b. (loose);■
, 6.12% d.b. (dense); ◊, 9.91% d.b. (loose); ♦, 9.91% d.b. (dense); ∆; 14.07% d.b. (loose); ▲, 14.07% d.b. (dense); ○, 18.49% d.b. (loose); ●, 18.49% d.b. (dense); □, 22.47% d.b. (loose); ■, 22.47% d.b. (dense)Models for dielectric constant and loss factor : Non-linear multiple regression analysis was used to describe the existing relationship between dielectric constant or loss factor and experimental variables i.e., moisture content, bulk density and frequency. Values of experimental dielectric constant or dielectric loss factor were regressed against each and all possible combinations of these variables in a stepwise approach. This technique allowed investigation of the overall and relative effects of the experimental factors by testing the statistical validity of including each of the factors in the model predicting dielectric constant and loss factor. The model developed for the dielectric constant and loss factor is of the form: ) log ln ln exp( ' ' 'orε = a+bM f +cMdρ f +gMh f ε (5)
where M is the moisture content in % d.b., ρ is the bulk density in kg/m3, f is the frequency in MHz, a, b, c, d, g and h are model constants in dimensionless.
The validity of models was evaluated by the coefficient of determination R2, mean relative percent deviation EMD and standard error of estimate Sy using
following equations: n N P E Sy − − =
∑
2 ) ( (6)∑
= − = N i MD E P E N E 1 100 (7)where E is the experimental dielectric constant or loss factor data, P is the predicted dielectric constant or loss factor by model, N is the number of data points and n is the number of constants
The higher the value of the coefficient of determination R2 and the lower the values of the mean relative percent deviation EMD and the standard error of
estimate Sy were chosen as the comparison criteria for the
goodness of fit of the experimental data obtained
Table 1. Estimated constants and comparison criteria’s of Eqn (5) for dielectric constant and loss factor at various moisture contents, bulk densities and frequencies
Dielectric constant Loss factor
Loose Dense Loose Dense
A 0.2505 0.3685 -3.95 -3.63 B 0.0271 0.0297 -0.0826 -0.0787 C 0.0011 0.0010 0.0075 0.0069 D 1.70 1.70 1.40 1.40 G -0.0012 -0.0013 0.0013 0.0012 H 2.20 2.20 2.30 2.30 R2 0.9724 0.9728 0.9701 0.9706 EMD, % 13.98 13.71 14.99 14.12 Sy 0.0514 0.0499 0.0057 0.0054 0 50 100 150 200 250 0.01 0.1 1 10 Frequency, MHz A .c . c o nd uc ti vi ty , µ S /m
Figure 4. Dependence of the a.c. conductivity of poppy seed on frequency at various moisture contents and bulk densities: □, 6.12% d.b. (loose); ■, 6.12% d.b. (dense); ◊, 9.91% d.b. (loose); ♦, 9.91% d.b. (dense); ∆; 14.07% d.b. (loose); ▲, 14.07% d.b. (dense); ○, 18.49% d.b. (loose); ●, 18.49% d.b. (dense);
□
, 22.47% d.b. (loose);■
, 22.47% d.b. (dense) ..
The estimated model constants for the dielectric constant and loss factor are shown in Table 1 along with the comparison criteria used to evaluate goodness of fit namely, the coefficient of determination R2, the mean relative percent deviation EMD and standard error of
estimate Sy. It was found that all model variables improved
the model adequately to ensure inclusion in the model at a significance level of 0.01. Both model developed for predicting the dielectric constant and loss factor provided a good fit to the experimental data with a value for R2 of greater than 0.97. Therefore, it can be stated that both model can be used to estimate sufficiently the dielectric constant and loss factor of poppy seed at any given moisture content, bulk density and frequency within the experimental range of study.
Conclusions
A parallel-plate capacitor sample holder was used to measure the dielectric properties of static samples of poppy seed. The dielectric constant, loss factor, loss tangent and the a.c. conductivity were shown to be dependent on the moisture content, bulk density and frequency of the applied electric field. The moisture content had a dominating effect on dielectric properties because of related effect of moisture changes. The.
dielectric constant increased with increasing the moisture content and bulk density, whereas it decreased with increasing the frequency. The highest changes in dielectric constant were observed to be at greater moisture content than at lower moisture content. The frequency dependence of the loss factor and loss tangent was less regular than that of the dielectric constant. The a.c. conductivity increased more rapidly with increasing moisture contents compared with increasing frequencies. Both model provided a practical and suitable way to predict the dielectric constant and loss factor within the experimental range of study
References
Anonymous, 2004. Statistical database. Available: http:// www.fao.org.
ASAE, 2002a. Standards D293.2, 2002. Dielectric properties of grain and seed. ASAE, St. Joseph, MI.
ASAE, 2002b. Standards S352.2, 2002. Moisture measurement - unground grain and seeds. ASAE, St. Joseph, MI.
Berbert, P A., D. M. Queiroz, E. F. Sousa, M. B. Molina, E. C. Melo and L. R. D. Faroni, 2001. Dielectric properties of parchment coffee. Biosystems Engineering, 81 (1): 65-80. Berbert, P. A., D. M. Queiroz and E. C. Melo, 2002. Dielectric
properties of common bean. Biosystems Engineering, 83 (4): 449-462.
Boldor, D., T. H. Sanders and J. Simunovic, 2004. Dielectric properties of in-shell and shelled peanuts at microwave frequencies. Transactions of the ASAE, 47 (4): 1159-1169. Incekara, F. 1979. Endustri Bitkileri ve Islahi, Lif Bitkileri ve Islahi.
[Industrial Plants and Their Breeding, Fibre Plants and Their Breeding.] Ege University Press, Izmir, Turkey. Ikediala, J. N., J. Tang, S. R. Drake and L. G. Neven, 2000.
Dielectric properties of apple cultivars and codling moth larvae. Transactions of the ASAE, 43 (5): 1175-1184. Jorgenson, J. L., A. R. Edison, S. O. Nelson and L. E. Stetson,
1970. A bridge method for dielectric measurements of grain and seed in the 50-to 250-MHz range. Transactions of the ASAE, 13 (1): 18-20, 24.
Kim, K. B., J. W. Lee, S. S. Lee, S. H. Noh and M. S. Kim, 2003. On-line measurement of grain moisture content using RF impedance. Transactions of the ASAE, 46 (3): 861-867. Kraszewski, A. W, S. O. Nelson, 1991. Density-independent
moisture determination in wheat by microwave measurements. Transactions of the ASAE, 34 (4): 1776-1783.
Lawrence, K. C., S. O. Nelson, 1993. Radio-frequency density-independent moisture determination in wheat. Transactions of the ASAE, 36 (2): 477-783.
Lawrence, K. C., S. O. Nelson and Jr. P. G. Bartley, 1998. Measuring dielectric properties of hard red winter wheat from 1 to 350 MHz with a flow-through coaxial sample holder. Transactions of the ASAE, 41 (1): 143-150.
Lawrence, K. C., W. R. Windham and S. O. Nelson, 1998. Wheat moisture determination by 1-to 110-MHz swept-frequency
admittance measurements. Transactions of the ASAE, 41
(1): 135-142.
Lawrence, K. C., D. B. Funk and W. R. Windham, 2001. Dielectric moisture sensor for cereal grains and soybeans. Transactions of the ASAE, 44 (6): 1691-1696.
Nelson, S. O. 1965. Dielectric properties of grain and seed in the 1 to 50-mc range. Transactions of the ASAE, 8 (1): 38-48. Nelson, S. O. 1992. Correlating dielectric properties of solids and
particulate samples through mixture relationships. Transactions of the ASAE, 35 (2): 625-629.
Nelson, S. O., K. C. Lawrence, 1994. RF impedance and dc conductance determination of moisture in individual soybeans. Transactions of the ASAE, 37 (1): 179-182. Nelson, S. O. 1999. Dielectric properties measurement
techniques and applications. Transactions of the ASAE, 42 (2): 523-529.
Nelson, S. O., Jr. P. G. Bartley, 2000. Measuring frequency-and temperature-dependent dielectric properties of food materials. Transactions of the ASAE, 43 (6): 1733-1736. Noh, S. H., S. O. Nelson, 1989. Dielectric properties of rice at
frequencies from 50 Hz to 12 GHz. Transactions of the ASAE, 32 (3): 991-998.
Sokhansanj, S., S. O. Nelson, 1988. Dependence of dielectric properties of whole-grain wheat on bulk density. Correlating dielectric properties of solids and particulate samples through mixture relationships. Journal of Agricultural Engineering Research, 39 (3): 173-179.
Stetson, L. E., S. O. Nelson, 1970. A method for determining dielectric properties of grain and seed in the 200- to 500-MHz range. Transactions of the ASAE, 13 (4): 491-495. Trabelsi, S., A. W. Kraszewski and S. O. Nelson, 1999.
Determining physical properties of grain by microwave permittivity measurements. Transactions of the ASAE, 42 (2): 531-536.
Correspondence address:
Kâmil SAÇILIK
Ankara University, Faculty of Agriculture, Department of Agricultural Machinery Tel : +90 (312) 317 05 50 / 1592 Fax: +90 (312) 318 38 88 e-mail: [email protected]