DETERMINATION OF SEISMIC PERFORMANCE INDEX OF RC BUILDINGS BY USING FUZZY LOGIC
Mahmut Kömüra*, Melike Altanb
a Department of Civil Engineering, Faculty of Engineering, Harran University, 63300, Şanlıurfa, Turkey
b Department of Civil Engineering, Faculty of Civil Engineering, Istanbul Technical University, 34469, Istanbul, Turkey
Abstract
In this study, fuzzy logic is applied to Japan Seismic Index Method. The values of Seismic Performance Index (IS) have been analyzed by using the fuzzy logic. The Seismic Index Method is modified according to the structural irregularities of the reinforced concrete structures in Turkey. This modified procedure is applied to a damaged reinforced concrete building in Avcılar in Istanbul in Turkey. The results of the numerical analyses have been given in this study.
Key words: Seismic Performance Index; Seismic Safety Evaluation; Fuzzy Logic; Seismic Index Method.
BETONARME BINALARIN SISMIK PERFORMANS INDEKSININ BULANIK MANTIK ILE TAYINI
Özet
Bu çalışmada, bulanık mantık Japon Sismik İndeks Yöntemine uygulanmıştır. Sismik Performans İndeksi (IS), bulanık mantık kullanılarak analiz edilmiştir. Sismik İndeks Yöntemi, Türkiye’deki betonarme yapılarda karşılaşılan yapısal düzensizlikler dikkate alınarak bazı eklentiler yapılmıştır. Bu prosedür, İstanbul-Avcılar’da bulunan hasar görmüş bir betonarme binaya uygulanmıştır. Sayısal analiz sonuçları bu çalışmada sunulmuştur.
Anahtar kelimeler: Sismik Performans İndeksi; Deprem Güvenliğinin Belirlenmesi; Bulanık Mantık; Sismik İndeks Yöntemi.
1. Introduction
Since 1992, seven major earthquakes have struck different highly populated regions of Turkey. These are 1992 Erzincan, 1995 Dinar, 1998 Ceyhan-Adana, 17 August 1999 Marmara, 12 November 1999 Düzce, 2002 Afyon and 2003 Bingöl
*Corresponding author. Tel.: +90-414-344 0020 (1123); Fax: +90-414-344 0031.
earthquakes. These earthquakes caused severe damage and collapse of the structures and killed more than 30.000 people according to official records. The observations made after these earthquakes on the damaged reinforced concrete buildings indicated that the causes of damage could be grouped in three main categories. These are namely: (a) improper configuration of architectural and structural systems, (b) poor detailing and/or proportioning, and (c) poor supervision during construction [1].
Especially in countries that are frequently exposed to earthquake, seismic safety evaluation of existing buildings has been always an important problem. Therefore, this subject has not lost its actuality in earthquake engineering. Various studies have been carried out to find a procedure for seismic safety evaluation having wide application spectrum [2-8].
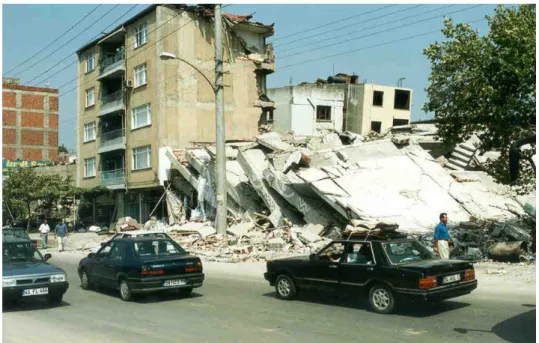
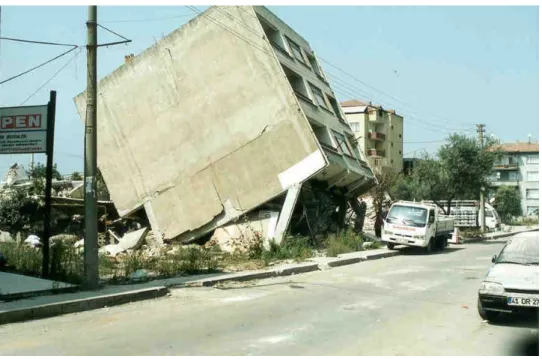
Most of the existing reinforced concrete residential buildings in Turkey and in many other countries are seismically deficient [7]. These buildings are subjected to large deformations under the earthquake loading due to low lateral stiffness of the frames. However, large deformations cannot be reached safely due to lack of ductility, which leads to failure of columns. Post earthquake observations indicated that buildings having lack of symmetry (both in the plan and in the elevation) and displaying structural discontinuities and/or sudden stiffness change from one storey to another are the most vulnerable ones. In this context, presence of soft first floor and short columns, discontinuities in vertical structural members (columns and/or structural walls), existence of large openings in floor systems is the typical causes of structural failures [1]. Failure situation due to lack of lateral stiffness and failure in the form of soft storey mechanism are represented by Figure 1 and Figure 2, respectively.
Studies about seismic safety evaluation of existing buildings have been fairly developed as computer technology improves in recent years [8]. Vagueness, complexity and fuzziness in human judgments lead into several difficulties related to seismic safety evaluation of existing buildings.
Figure 1. Failure due to lack of lateral stiffness (Derince, 17 August 1999 Marmara earthquake)
Figure 2. Failure in the form of soft storey mechanism (Kocaeli, 17 August 1999 Marmaraearthquake)
The estimation of probable future losses is a matter of increasing interest to those concerned with earthquake insurance and the management of facilities or public administration in earthquake-prone regions. Over the last decade, a lot of effort has been devoted to the problem of how to devise reliable estimates, given the large uncertainties in the pattern of earthquake occurrence, both in time and space and our limited understanding of behavior of the vulnerable elements of the built environment [1, 9-11]. Because of various uncertainties and randomness involved both in seismic demand and capacity, assessment of potential damage should be carried out based on statistical and probabilistic, or fuzzy techniques. Current approaches in seismic vulnerability evaluation methods follow three main stages. These stages are namely: Walk-down evaluation, preliminary evaluation and final evaluation. Evaluation in the first stage does not require any analysis and it relies on the past performance of similar buildings. The goal of the walk-down evaluation is to determine the priority levels of buildings that require immediate intervention. The preliminary evaluation covers the buildings that are designated to be inadequate in the first stage. In this stage, the simplified analysis is performed based on a variety of methods. The time needed for a preliminary evaluation of a particular building is about three to four hours. The final evaluation of the structure, mainly based on further detailed seismic performance analyses, is to be carried out by an experienced design engineer. In the final evaluation stage, buildings that cannot be classified in the first two stages are considered. The time needed for final evaluation of a particular structure can range from couple of days to several weeks [1]. In this study, for seismic safety evaluation of the existing buildings, Japan Seismic Index Method by adding the effects of structural irregularities is modified by the authors. The values of Seismic Performance Index of Structure IS in the Japan Seismic Index Method have been analyzed by using the fuzzy sets and logic.
2. Seismic index method
According to the current Japanese Standard, the Seismic Performance of a building is represented by two indices [12]:
Is: Seismic index of structure In: Seismic index of non-structural elements 2.1. Seismic Index of Structure (Is)
Is=Eo×SD×T (1)
Eo : Basic Structural Performance Index SD : Structural Property Sub-index T : Time Deterioration Sub-index
Three levels of screenings procedure are identified; 1st, 2nd and 3rd level. Reliability of performance estimation is directly proportional to the level of the screening procedure, i.e., increase in level means increase in the reliability of the procedure. 1st Level Screening mainly involves the shearing strength of the columns and the walls. The method may underestimate the performance for purely moment resisting structure, and reliability increases with the amount of shear walls used within the frame. 2nd Level Screening mainly involves the computation of the capacities and the ductility of the columns and the shear walls. The beams are assumed to be rigid. The running of the procedure to the weak column/strong beam type of structures yields more reliable estimation. 3rd Level Screening involves all the possible failure mechanisms, including beam failures and the rigid body rotation of the shear walls due to foundation failures. Eo is computed for each level of screening procedure, however SD and T are needed only for the 2nd and 3rd levels.
2.2. Estimation of Structural Property Sub-index SD
Sub-index SD reflects the effects of irregularity in stiffness and/or mass distribution etc. on the performance. For this purpose field survey is necessary. The items to be inspected during the field survey also depend upon the level of screening. 1st Level Screening:
SD1 = q1a×q1b×...×q1k (2)
Where; q1i = {1-(1-Gi)×Ri} ; i=a,b,c,d,e,f,g,i,j,k q1i = {1.20-(1-Gi)×Ri} ; i=h
2nd and 3rd Level Screening:
SD2 = q2a×q2b×...×q2n (3)
Where; q2i = {1-(1-Gi)×Ri} ; i = a,b,c,d,e,f,g,i,j,k,l,n q2i = {1.20-(1-Gi)×Ri} ; i = h
The factors Gi and Ri are determined from Table 1. 2.3. Judgment Process
The judgment for Is is made according to Is>Iso inequality.
Iso=Es×Z×G×U (4)
Iso: Structural seismic index
Es: Seismic basic index. For 1st level screening Es=0.8, for 2nd and 3rd level screening Es=0.6
Z: Seismic zone index G: Soil amplification factor U: Importance factor
For the 2nd and 3rd Level Screening procedures, the product (Ct×SD) should remain between the following limits:
1.25>(Ct×SD)>0.3
Where;
Ct : Cumulative strength index SD : Structural property sub-index
If (Ct×SD)>1.25, then the building is considered to be “SAFE”. For the final judgment the following inequality is used:
Is>Iso, namely, (estimated seismic performance)>(required seismic performance). 3. Modified seismic index method
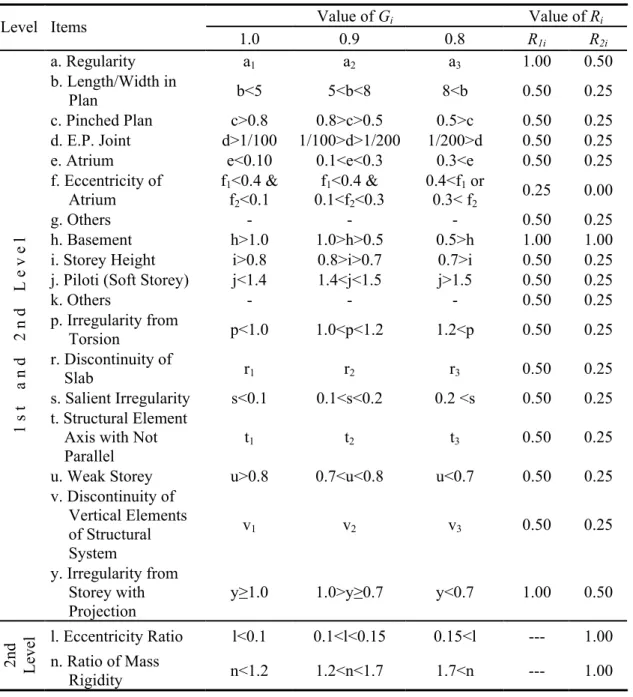
Effect to seismic behavior of building, which has irregularities related to structural system, is taken into consideration as structural property sub-index SD. Therefore, Table 1 is formed by adding irregularity from torsion (p), discontinuity of slab (r), salient irregularity (s), structural element axis with not parallel (t), weak storey (u), discontinuity of vertical elements of structural system (v) and irregularity from storey with projection (y).
The aforementioned irregularities are rather frequently encountered reinforced concrete buildings in Turkey and Turkish Earthquake Code contains these irregularities except for irregularity from storey with projection. In this way, the factors of Gi and Ri are obtained from Table 1 for modified seismic index method.
4. Fuzzy sets and logic
Fuzzy sets and logic were finding out by Zadeh [13], who is leading development of fuzzy logic instead of Aristotelian logic, which have two possibilities only. Fuzzy logic concept provides a natural way of dealing with problems in which the source of imprecision is absence of sharply defined criteria rather than the presence of random variables. Fuzzy approach considers cases where linguistic uncertainties play some role in the control mechanism of the phenomena concerned. Herein, uncertainties do not mean random, probabilistic and stochastic variations, all of which are based on the numerical data. Zadeh has motivated his work on fuzzy logic with the observation that the key elements in human thinking are not numbers but levels of fuzzy sets. Further he saw each linguistic word in a natural language as a summarized description of a fuzzy subset at a universe of discourse representing the meaning of this word. In consequence,
1 2 2 3 3 ( 1) ( ) ( ) t n C C a C a C n i + = + + + (5)
he introduced linguistic variables as variables whose values are sentences in a natural or artificial language [13].
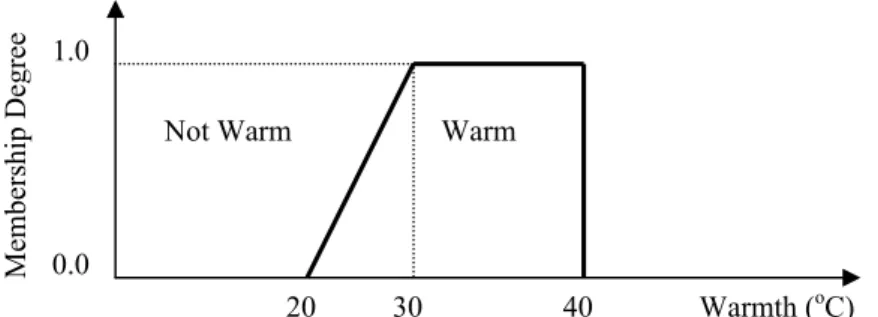
The key idea in fuzzy logic is allowance of partial belongings of any object to different subsets of the universal set instead of belonging to a single set completely. Partial belonging to a set can be described numerically by a membership function, which assumes values between 0 and 1 inclusive (Figure 3 and Figure 4).
Table 1. The factors Gi and Ri for evaluation of modified index SD
Value of Gi Value of Ri Level Items 1.0 0.9 0.8 R1i R2i a. Regularity a1 a2 a3 1.00 0.50 b. Length/Width in Plan b<5 5<b<8 8<b 0.50 0.25 c. Pinched Plan c>0.8 0.8>c>0.5 0.5>c 0.50 0.25 d. E.P. Joint d>1/100 1/100>d>1/200 1/200>d 0.50 0.25
e. Atrium e<0.10 0.1<e<0.3 0.3<e 0.50 0.25
f. Eccentricity of Atrium f1<0.4 & f2<0.1 f1<0.4 & 0.1<f2<0.3 0.4<f1 or 0.3< f2 0.25 0.00 g. Others - - - 0.50 0.25 h. Basement h>1.0 1.0>h>0.5 0.5>h 1.00 1.00
i. Storey Height i>0.8 0.8>i>0.7 0.7>i 0.50 0.25
j. Piloti (Soft Storey) j<1.4 1.4<j<1.5 j>1.5 0.50 0.25
k. Others - - - 0.50 0.25 p. Irregularity from Torsion p<1.0 1.0<p<1.2 1.2<p 0.50 0.25 r. Discontinuity of Slab r1 r2 r3 0.50 0.25 s. Salient Irregularity s<0.1 0.1<s<0.2 0.2 <s 0.50 0.25 t. Structural Element Axis with Not Parallel
t1 t2 t3 0.50 0.25
u. Weak Storey u>0.8 0.7<u<0.8 u<0.7 0.50 0.25
v. Discontinuity of Vertical Elements of Structural System v1 v2 v3 0.50 0.25 1 s t a n d 2 n d L e v e l y. Irregularity from Storey with Projection
y≥1.0 1.0>y≥0.7 y<0.7 1.00 0.50
l. Eccentricity Ratio l<0.1 0.1<l<0.15 0.15<l --- 1.00
2nd Level n. Ratio of Mass
Rigidity n<1.2 1.2<n<1.7 1.7<n --- 1.00
Fuzzy logic has been developing since then and is now being used especially in Japan for automatic control for commercial products such as washing machines,
cameras and robotics. Many textbooks provide basic information on the concepts and operational fuzzy algorithms [14-17].
Within frame of this study, a simplified view of linguistic variables of Seismic Performance Index IS is adopted. In this context, fuzzy propositions, i.e. if-then statements are used to characterize the state of a system and the truth-value of the proposition is a measure of how well the description matches the state of the system. The literature is rich with references concerning the ways to assign membership values or functions to fuzzy variables. Among these ways are intuition, inference rank ordering, angular fuzzy sets, neural networks, genetic algorithms, inductive reasoning, etc. [17]. Especially, the intuitive approach is used rather commonly because it is simply derived from capacity of humans to develop membership functions through their own innate intelligence and understanding. Intuition involves contextual and semantic knowledge about an issue; it can be also involving linguistic truth-values about this knowledge [16]. Even if the measurements are carefully carried out as crisp quantities they can be fuzzified. Furthermore, if the form of uncertainty happens to arise because of imprecision, ambiguity or vagueness, then the variable is fuzzy and can be represented by a membership function. In order to simplify the calculations, usually the membership function is adopted as linear in practical applications. The objective then can be formulated as maximizing the minimum membership value, which has the effect of balancing the degree to which the objective is attained with degrees to which the constraints have to be relaxed from their optimal values [18].
Membershi p Degree Warm 20 0.0 1.0 Warmth (oC) 40 30 Not Warm
Figure 3. Demonstration of “warm” fuzzy set which suitable to fuzzy sets theory
Membershi p Degree 15 Cold 0.5 20 0.0 1.0 Warmth (oC) 40 Warm
Figure 4. Covering of fuzzy sets
5. Fuzzy logic algorithm for seismic performance index IS
5.1. Fuzzy input and output variables
IS = E0×SD×T (6)
IST = IS /T = E0×SD (7)
Fuzzy input variables are Basic Structural Performance Index E0 and Structural Property Sub-index SD, which are called as ‘INDEX E0’ and ‘INDEX SD’ respectively. Fuzzy output variable is “IST” and Eq. (7) expresses it. It is called as ‘INDEX IST’.
5.2. Fuzzy subsets and membership functions
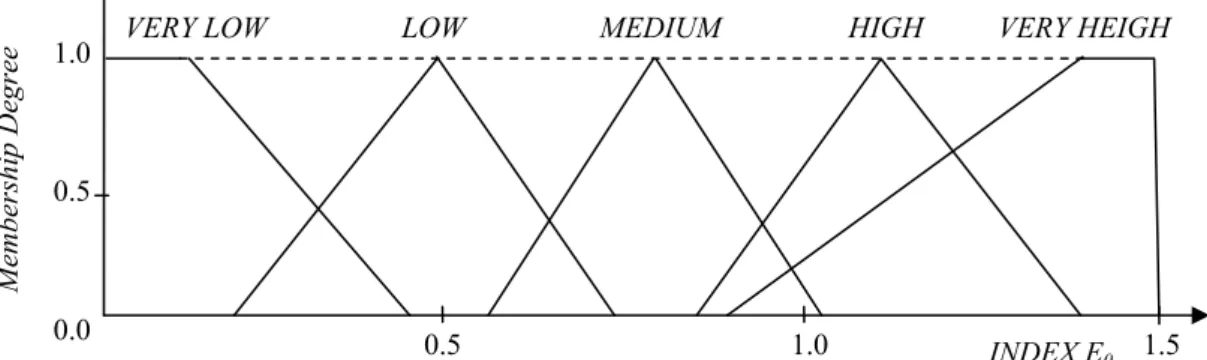
Figure 5 and Figure 6 represent trained membership functions for input, respectively. Trained membership function for output is represented in Figure 7.
5.3. Fuzzy rule base
Fuzzy rule base contains eighteen rules. These rules are given as follows: 1. If INDEX E0 is VERY LOW and INDEX SD is VERY SMALL, then INDEX IST is BAD 2. If INDEX E0 is LOW and INDEX SD is SMALL, then INDEX IST is NOT BAD 3. If INDEX E0 is MEDIUM and INDEX SD is MEDIUM, then INDEX IST is GOOD 4. If INDEX E0 is HIGH and INDEX SD is BIG, then INDEX IST is RATHER GOOD
5. If INDEX E0 is VERY HIGH and INDEX SD is VERY BIG, then INDEX IST is VERY GOOD 6. If INDEX E0 is VERY LOW and INDEX SD is MEDIUM, then INDEX IST is NOT BAD 7. If INDEX E0 is VERY LOW and INDEX SD is VERY BIG, then INDEX IST is NOT BAD 8. If INDEX E0 is MEDIUM and INDEX SD is VERY BIG, then INDEX IST is RATHER GOOD 9. If INDEX E0 is MEDIUM and INDEX SD is VERY SMALL, then INDEX IST is NOT BAD 10. If INDEX E0 is MEDIUM and INDEX SD is BIG, then INDEX IST is GOOD
11. If INDEX E0 is MEDIUM and INDEX SD is VERY SMALL, then INDEX IST is BAD 12. If INDEX E0 is VERY LOW and INDEX SD is MEDIUM, then INDEX IST is BAD 13. If INDEX E0 is VERY HIGH and INDEX SD is VERY SMALL, then INDEX IST is GOOD 14. If INDEX E0 is HIGH and INDEX SD is VERY SMALL, then INDEX IST is NOT BAD 15. If INDEX E0 is HIGH and INDEX SD is SMALL, then INDEX IST is GOOD
16. If INDEX E0 is HIGH and INDEX SD is MEDIUM, then INDEX IST is RATHER GOOD 17. If INDEX E0 is LOW and INDEX SD is BIG, then INDEX IST is GOOD
6. Example
A 4-storey reinforced concrete building, which ground storey floor plan shown in Figure 8 and dimensions of the column and rebar arrangement are shown in Figure 9, is considered in order to show the implementation of the Seismic Index Method which contains of fuzzy logic algorithm. Some properties of the building are given as follows:
İNDEX SD
1.0
0.5
0.0
0.2 0.4 0.6 0.8 1.0 1.2
VERY SMALL SMALL MEDIUM BIG VERY BIG
Membershi
p Degree
Figure 6. Trained membership functions for input variableINDEX SD
Membershi
p Degree
Figure 5. Trained membership functions for input variableINDEX E0
0.5 1.0 1.5 1.0
0.5
0.0
VERY LOW LOW MEDIUM HIGH VERY HEIGH
INDEX E0
Figure 7. Trained membership functions for output variableINDEX IST
1.0
0.5
0.0
BAD NOT BAD GOOD RATHER GOOD VERY GOOD
0.2 0.4 0.6 0.8 1.0 1.2 1.4 1.6 1.8
Membershi
p Degree
Year built is 1992 and building type is moment resisting frame (MRF) with X and Y direction. Building consists of basement+ground storey+3 normal storeys. Storey heights and beam heights are 2.75 and 0.50 meter, respectively. Whole reinforcement is S220. φ16 in columns and φ16-φ14 in beams are used as longitudinal reinforcement. As stirrup reinforcement, φ8 in columns and φ10 in beams are used. Distance between two stirrups is 0.12 meter. The design compression strength of concrete and yield strength of reinforcement are respectively fcd=10 MPa and fyd=191 MPa (found in the result of testing). The weight of the building per m2 is 10.75 kN/m2 and the weight of a storey is 1064 kN. Then, the total weight of the building is 4256 kN. Building ground has irregular ground layers. The state of deterioration of the building is not good.
6.1. First level screening
For whole storey with X and Y direction; H0=2.75-0.50=2.25 m For X-direction;
C1, C2, C3, C4, C5, C6, C7, C13, C14, C15, C16, C17 H0/D=2.25/0.30=7.50
C10, C11 H0/D=2.25/0.50=4.50
C8, C9, C12 H0/D=2.25/0.40=5.625
Because of H0/D>2, there is no short column for X-direction of the building. Where, H0 is heigth of column and D is width of column.
For Y-direction;
C1, C2, C3, C4, C5, C6, C7, C13, C14, C15, C16, C17 H0/D=2.25/0.40=5.625
C10, C11 H0/D=2.25/0.30=7.50
C8, C9, C12 H0/D=2.25/0.30=7.50
C18 H0/D=2.25/0.80=2.81
Because of H0/D>2, there is no short column for Y-direction of the building. The results of the first level screening given by Table 2.
Table 2. The results obtained from first level screening
6.1.1. Judgment process for first level screening IS0=ES×Z×G×U=0.80×1.0×1.10×1.0=0.88
As a result, for all storey with X and Y-direction IS<IS0. Therefore, it is say that seismic behavior of the building is indefinite according to the first level screening of the Seismic Index Method.
6.2. Second level screening
This screening level applied only to the ground storey. Behavior of the ground storey gives an idea about behavior of whole building. Table 3 gives the results obtained from second level screening.
X-Direction Y - Direction Storey Cc Fw E0 SD T IS Cc Fw E0 SD T IS Ground 0.21 1.0 0.21 1.0 0.90 0.191 0.25 1.0 0.25 1.0 0.90 0.222 1. 0.27 1.0 0.23 1.0 0.90 0.207 0.26 1.0 0.26 1.0 0.90 0.234 2. 0.40 1.0 0.29 1.0 0.90 0.261 0.33 1.0 0.33 1.0 0.90 0.297 3. 0.80 1.0 0.50 1.0 0.90 0.450 0.58 1.0 0.58 1.0 0.90 0.522
Whole columns are gathered one group for X-direction of the building, since all of the columns have high ductility and their failure mechanisms are predicted to be flexure.
1st Group: All of the eighteen columns. Failure Mode: Flexure
F1=3.06 C1=ΣQmu/W=0.2451 E01=C1×F1=0.2451×3.06=0.7490 E0=[(n+1)/(n+i)] × [E012+E022+E032]0.5 E0=[(4+1)/(4+1)] × [(0.7490)2]0.5=0.7490 IS=E0×SD×T=0.7490×1.00×0.90=0.6740 For Y-direction; 1st Group: C18 column. Failure Mode: Flexure F=1.27
C1=Qmu/W=0.0575
E01=C1×F1=0.0575×1.27=0.0730
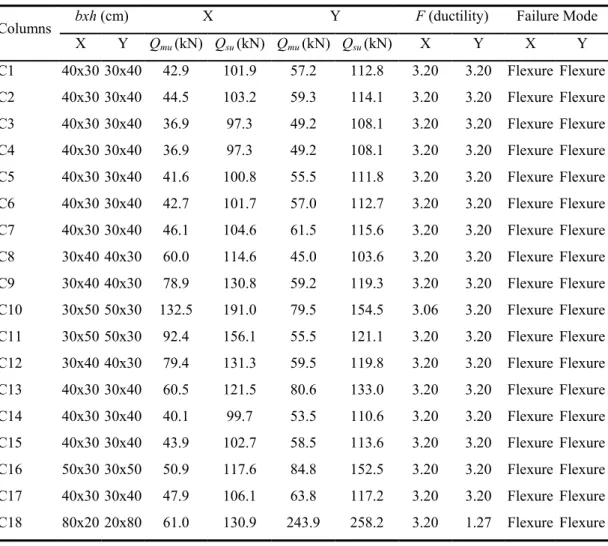
Table 3. The results obtained from second level screening (for ground storey)
bxh (cm) X Y F (ductility) Failure Mode
Columns
X Y Qmu (kN) Qsu (kN) Qmu (kN) Qsu (kN) X Y X Y
C1 40x30 30x40 42.9 101.9 57.2 112.8 3.20 3.20 Flexure Flexure C2 40x30 30x40 44.5 103.2 59.3 114.1 3.20 3.20 Flexure Flexure C3 40x30 30x40 36.9 97.3 49.2 108.1 3.20 3.20 Flexure Flexure C4 40x30 30x40 36.9 97.3 49.2 108.1 3.20 3.20 Flexure Flexure C5 40x30 30x40 41.6 100.8 55.5 111.8 3.20 3.20 Flexure Flexure C6 40x30 30x40 42.7 101.7 57.0 112.7 3.20 3.20 Flexure Flexure C7 40x30 30x40 46.1 104.6 61.5 115.6 3.20 3.20 Flexure Flexure C8 30x40 40x30 60.0 114.6 45.0 103.6 3.20 3.20 Flexure Flexure C9 30x40 40x30 78.9 130.8 59.2 119.3 3.20 3.20 Flexure Flexure C10 30x50 50x30 132.5 191.0 79.5 154.5 3.06 3.20 Flexure Flexure C11 30x50 50x30 92.4 156.1 55.5 121.1 3.20 3.20 Flexure Flexure C12 30x40 40x30 79.4 131.3 59.5 119.8 3.20 3.20 Flexure Flexure C13 40x30 30x40 60.5 121.5 80.6 133.0 3.20 3.20 Flexure Flexure C14 40x30 30x40 40.1 99.7 53.5 110.6 3.20 3.20 Flexure Flexure C15 40x30 30x40 43.9 102.7 58.5 113.6 3.20 3.20 Flexure Flexure C16 50x30 30x50 50.9 117.6 84.8 152.5 3.20 3.20 Flexure Flexure C17 40x30 30x40 47.9 106.1 63.8 117.2 3.20 3.20 Flexure Flexure C18 80x20 20x80 61.0 130.9 243.9 258.2 3.20 1.27 Flexure Flexure
2nd Group: Entire columns except for C18 column. Failure Mode: Flexure
F=3.20
C=Qmu/W=0.2426
E02=C2×F2=0.2426×3.20=0.7764
E0=[(4+1)/(4+1)] × [(0.0730)2+(0.7764)2]0.5=0.7798
IS=E0×SD×T=0.7798×1.00×0.90=0.7018 6.2.1. Judgment process for second level screening:
IS0=ES×Z×G×U=0.60×1.0×1.10×1.0=0.66
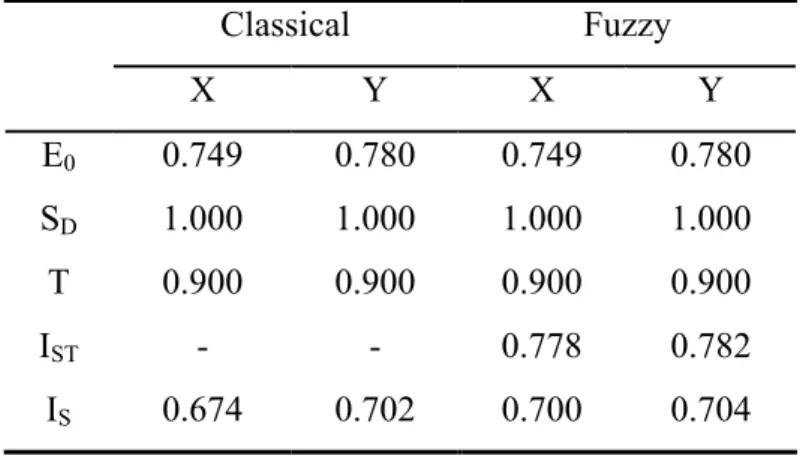
It is seen that IS>IS0 in both of direction. Therefore, it is said that seismic safety in both of direction of the building is sufficient according to the Seismic Index Method. IS values obtained from second level screening for ground storey of the building are compared with IST INDEX values in other words IS values which is found out based upon fuzzy logic algorithm. Within the framework of this study it is reached to convenient results (Table 4).
Table 4. The values of the Seismic Performance Index as classical and fuzzy
7. Results
In the result of 1st Level Screening, it is found that IS<IS0 for each storey in X and Y-direction of the building in example. Therefore, it is expressed that seismic safety of the building is undetermined according to the Seismic Index Method. In respect of 2nd Level Screening, it is seen that IS>IS0 in both of direction. Therefore, it is said that seismic reliability in both of direction of the building is adequate as to the Seismic Index Method. 2nd Screening Level applied only to the ground storey of the building. Behavior of the ground storey gives an idea about behavior of whole building. Besides, the values of the Seismic Performance Index IS have been analyzed by using the fuzzy logic. When the results are examined, it has been observed that the fuzzy logic compared with the Aristotelian logic having crisp and no compensational boundary has given more convenient results to human thinking and judgment. The inspection of the results yields that the fuzzy logic solution has softened and it has clearly gained
Classical Fuzzy X Y X Y E0 0.749 0.780 0.749 0.780 SD 1.000 1.000 1.000 1.000 T 0.900 0.900 0.900 0.900 IST - - 0.778 0.782 IS 0.674 0.702 0.700 0.704
flexibility as to sharp passing of conventional solution. Furthermore, it is observed that this situation gives more reliable results. Authors carry on their studies which applying to assessment of seismic safety of RC buildings in Turkey with Japan Seismic Index Method.
References
[1] Ozcebe G, Yucemen MS, Aydogan V. Statistical seismic vulnerability assessment of existing reinforced concrete buildings in Turkey on a regional scale. Journal of Earthquake Engineering 2004; 8(5): 749-773.
[2] Song B, Hao S, Murakami S, Sadohara S. Comprehensive evaluation method on earthquake damage using fuzzy theory. Journal of Urban Planning and Development 1996; 122 (1): 1-17.
[3] Shwe TT, Adeli H. AI and CAD for earthquake damage evaluation. Engineering Structures 1993; 15(5): 315-319.
[4] Shepherd R, Haynes TE. Expert system and assessment of earthquake hazard reduction, Proceedings of the IABSE Colloquium on Knowledge Based Systems in Civil Engineering 1993, Beijing, China, September 1993, 351-360.
[5] Molas GL, Tamazaki F. Neural networks for quick earthquake damage estimation. Earthquake Engineering&Structural Dynamics 1995;24: 505-516.
[6] Revadigar S, Mau ST. Automated multicriterion building damage assessment from seismic data. Journal of Structural Engineering 1999; 125(2): 211-217.
[7] Ersoy U, Ozcebe G. Lessons from recent earthquakes in Turkey and seismic rehabilitation of buildings, SM Uzumeri Symposium 2000 — Behavior and Design of Concrete Structures for Seismic Performance, eds. Bayrak O, Sheikh S. (SP-197, ACI International, Farmington Hills, MI), 105–126.
[8] Komur M. Fuzzy logic approach for seismic safety evaluation of buildings, PhD. thesis, Istanbul Technical University, Institute of Science and Technology, 2004. [9] Dolsek M, Fajfar P. Soft storey effects in uniformly infilled reinforced concrete
frames. Journal of Earthquake Engineering 2001; 5(1): 1-12.
[10] Brookshire DS, Chang SE, Cochrane H, Olson RA, Rose A, Steenson J. Direct and indirect economic losses from earthquake damage. Earthquake Spectra 1997; 13(4): 683-701.
[11] Hassan AF, Sozen MA. Seismic vulnerability assessment of low-rise buildings in regions with infrequent earthquakes, ACI Structural Journal 1997; 94(1): 31-39. [12] Ohkubo M. Technical report: Current Japanese system on seismic capacity and
retrofit techniques for existing reinforced concrete buildings and post-earthquake damage inspection and restoration techniques. Report No. SSRP-91/02, Department of Applied Mechanics and Engineering Sciences, University of California, San Diego, 1991.
[13] Zadeh LA. Fuzzy sets. Information and Control 1967; 8: 38–53.
[14] Klir GJ, Fogel TA. Fuzzy sets, uncertainty and information. New York (NY): Prentice Hall; 1988.
[15] Kosko B. Neural networks and fuzzy systems. Englewood Cliffs (NJ): Prentice Hall; 1992.
[16] Zadeh L. Fuzzy logic for the management of uncertainty, Kacprzyk J, editors. 1992.
[17] McNeill FM, Thro E. Fuzzy logic: A practical approach. Boston (MA): AP Professional; 1994.
[18] Sen Z. Fuzzy algorithm for estimation of solar irradiation from sunshine duration. Solar Energy 1998; 63: 39-49.