KADİR HAS ÜNİVERSİTESİ SCHOOL OF GRADUATE STUDIES IN
ENERGY AND SUSTAINABLE DEVELOPMENT PROGRAM
RENEWABLE ENERGY IN TURKEY: A CLEANER,
SELF-SUFFICIENT ALTERNATIVE TO COAL
GÖZDE NUR KARAGÖZ
SUPERVISOR: PROF. DR. VOLKAN Ş. EDİGER CO-SUPERVISOR: ASSOC. PROF. DR. GÖKHAN KİRKİL
MASTER’S THESIS
İSTANBUL, JULY, 2019
RENEWABLE ENERGY IN TURKEY: A CLEANER,
SELF-SUFFICIENT ALTERNATIVE TO COAL
GÖZDE NUR KARAGÖZ
MASTER’S THESIS
SUPERVISOR: PROF. DR. VOLKAN Ş. EDİGER CO-SUPERVISOR: ASSOC. PROF. DR. GÖKHAN KİRKİL
Submitted to the Institute for Graduate Studies of Kadir Has University in partial fulfillment of the requirements for the degree of Master’s in the Program of Energy and Sustainable Development.
İSTANBUL, JULY, 2019 APPENDIX B
TABLE OF CONTENTS ABSTRACT... i ÖZET... ii ACKNOWLEDGMENTS...iii LIST OF ABBREVIATIONS...iv LIST OF FIGURES... vi LIST OF TABLES...vii INTRODUCTION... 1
1. COAL DEVELOPMENTS IN THE WORLD... 5
1.1. Energy Mix and Transition... 5
1.2. Renewable Energy Sources... 6
1.3. Coal Outlook in the World... 9
2. ENERGY SITUATION IN TURKEY WITH A SPECIAL EMPHASIS ON COAL... 13
2.1. Turkey’s Energy Outlook...13
2.2. Coal Outlook... 15
2.3. Coal Consumption and Imports of Turkey... 17
2.3.1. Coal-Fired Power Plants in Turkey... 20
3. EXTERNAL EFFECTS OF COAL... 23
3.1. Harmful Effects of Lignite... 27
3.2. Accidents in Coal Mining Sector in Turkey... 29
4. RENEWABLE ENERGY SOURCES IN TURKEY... 31
4.1. Hydropower... 31
4.2. Wind Energy...33
4.3. Geothermal Energy... 35
4.4. Solar Energy... 38
5. NATIONAL AND DOMESTIC ENERGY POLICIES AND A COMPARISON BETWEEN RENEWABLES AND COAL... 41
5.1 Renewable Energy Incentives... 43
5.2.1 New Investment Incentive System... 49
5.2.2 Capacity Market... 50
5.3.3 Purchasing Agreement From Tetaş... 51
5.3.4 Environmental Legislation... 52
5.3.5 Outcomes of the Policies... 52
SUGGESTIONS AND CONCLUSION... 56
i
RENEWABLE ENERGY IN TURKEY: A CLEANER, SELF-SUFFICIENT ALTERNATIVE TO COAL
ABSTRACT
The world is in the midst of a transformative energy transition, moving to renewable energy sources from fossil fuels. The biggest reasons for this transition are global climate change and resource scarcity, both of which are caused by the use of fossil fuels. Among fossil fuels, coal has the highest emissions and causes more significant damage to people and the environment. Despite its negative effects, coal has a large share of the world’s energy mix. However, many countries are moving away from coal and switch to renewable energy sources. Turkey is not one of those countries, as the energy system is still heavily dependent on fossil fuels and coal specifically. Turkey is planning on new coal-fired power plants in addition to existing ones and is generally supporting the coal industry. In addition to the environmental harm to Turkey – and the world – of its coal usage, most of the coal that Turkey burns is imported, thus contributing to the country’s trade deficit. In order to limit the negative effects of coal use, Turkey needs to utilize its high renewable energy potential. This study reviews the current situation of coal and renewable energy sources in Turkey. It aims to look at current coal and renewable energy policies and compare them. According to this analysis, it will then offer suggestions for how Turkey can phase out coal and switch to renewable energies.
ii
TÜRKİYE’DE YENİLENEBİLİR ENERJİ: KÖMÜRE DAHA TEMİZ BİR ALTERNATİF
ÖZET
Dünya, bir enerji dönüşümü sürecinde ve fosil yakıtlardan yenilenebilir enerji kaynaklarına geçmekte. Bu geçişin en büyük nedenleri, fosil yakıtların kullanımından kaynaklanan küresel iklim değişikliği ve kaynak kıtlığıdır. Fosil yakıtlar arasında kömür en yüksek emisyonlara sahiptir ve insanlara ve çevreye daha fazla zarar vermektedir. Olumsuz etkilerine rağmen, kömür dünyanın enerji tüketiminde büyük bir paya sahiptir. Ancak, birçok ülke kömürden uzaklaşmakta ve yenilenebilir enerji kaynaklarına geçiş yapmaktadır. Türkiye, bu ülkelerden biri olmaya çalışmakta fakat henüz bu ülkelerden biri değildir çünkü var olanlara ek olarak yeni kömür yakıtlı enerji santralleri planlıyor ve genellikle kömür endüstrisini desteklemeye yönelik politikalar izlemekte. Kömür kullanımının Türkiye'ye ve dünyaya sağladığı çevresel zararlara ek olarak, Türkiye'nin yaktığı kömürün çoğu ithal edilmekte ve bu da ülkenin ticari açığını arttırmaktadır. Kömür kullanımının olumsuz etkilerini azaltmak için, Türkiye'nin yüksek yenilenebilir enerji potansiyelini kullanması gerekir. Bu çalışma, Türkiye'deki kömür ve yenilenebilir enerji kaynaklarının mevcut durumunu gözden geçirmektedir. Mevcut kömür ve yenilenebilir enerji politikalarına bakmayı ve bunları karşılaştırmayı amaçlamaktadır. Çalışma bu analize göre, daha sonra Türkiye'nin kömürü nasıl aşabileceği ve yenilenebilir enerjilere nasıl geçebileceği konusunda öneriler sunacaktır.
iii
ACKNOWLEDGMENTS
I would first like to express my gratitude to my supervisor Prof. Dr. Volkan Ş. Ediger from Energy and Sustainable Development Master Program of Kadir Has University. He consistently allowed this paper to be my work but steered me in the right the direction whenever he thought I needed it. I would also like to thank my co-supervisor, Assoc. Prof. Gökhan Kirkil. Without useful comments, remarks, and suggestions of my supervisors, this thesis would not have been successfully completed.
My thesis was also made possible in part by a scholarship from the TEMA Foundation. I also would like to thank them for their support for my thesis.
I would like to thank my loved ones especially Burak Şuşoğlu, who stood by me, both encouraging me and helping me to complete my thesis during the entire process. I want to thank my dear friends, Hazal Mengi Dinçer and Elif Güney for their support. I also very much appreciate Dr. John W. Bowlus for his help for editing my thesis.
My sincere gratitude goes to my parents, they always encouraged me and stood behind me with their best wishes.
iv
LIST OF ABBREVIATIONS ADHD: Attention Deficit and Hyperactivity Disorder BP: British Petroleum
CO2: Carbon dioxide
CSP: Concentrated Solar Power EGC: Electricity Generation Company EIA: Environmental Impact Assessments EMRA: Energy Market Regulatory
ETKB: Ministry of Energy and Natural Resources ETUC: The European Trade Union Confederation EU: European Union
EÜAŞ: Electricity Production Incorporated Company GHG: Green Gas Emissions
GW: Gigawatt
GWEC: Global Wind Energy Council
HEAL: Health and Environment Alliance IEA: International Energy Agency
IPCC: Intergovernmental Panel on Climate Change
IRENA: International Renewable Energy Agency LCOE: Levelized Cost of Energy
MTA: General Directorate of Mineral Research and Exploration
MTAE: General Directorate of Mineral Research and Exploration Institute Mtoe: Million Tons of oil equalivent
MW: Megawatt
MWt: Thermal megawatt
OECD: Organisation for Economic Co-operation and Development
PM: Particulate Matter PV: Photovoltaics
R/P: Resource to Production
RERA: Renewable Energy Resource Areas RES: Renewable Energy Sources
v
TEMA: The Turkish Foundation for Combating Soil Erosion, for Reforestation and the Protection of Natural Habitats
TKİ: Turkey Coal Enterprises
TMMOB: The Union of Chambers of Turkish Engineers and Architects Toe: Tons of oil equalivent
TPAO: Turkish Petroleum Corporative Tpes: Total primary energy supply TTK: Turkey Hard Coal Enterprises TÜREB: Turkey Wind Energy Union TURKIS: Mine and Coal Enterprises TWh: Terawatt Hour
UNFCCC: United Nations Framework Convention on Climate Change US: United States
VAT: Value Added Tax
WBA: World Bioenergy Association
YEGM: General Directorate of Renewable Energy YEKA: Renewable Energy Resource Areas
vi
LIST OF FIGURES
Figure 1.1 World energy mix 2017... 5
Figure 1.2 World energy generation from RES... 7
Figure 1.3 World total coal consumption... 8
Figure 1.4 Share of each fossil fuel in total fossil fuel consumption in the World... 10
Figure 1.5 Global energy related CO2 emissions by source ... 11
Figure 2.1 Turkey’s electricity installed capacity, 2019... 13
Figure 2.2 Turkey’s electricity generation by source, 2018... 14
Figure 2.3 Natural gas trade volumes by country... 15
Figure 2.4 Turkey’s oil imports as percentage by country 2017... 15
Figure 2.5 Coal consumption of Turkey... 18
Figure 2.6 Total import of hard coal and coke... 18
Figure 2.7 Number of existing and under construction coal power plants in Turkey ... 21
Figure 3.1 Health Effects of Coal-fired Power Plants... 24
Figure 4.1 Renewable energy generation by source in Turkey... 31
Figure 4.2. Electricity generation from hydropower... 33
Figure 4.3 Turkey wind energy potential atlas ... 34
Figure 4.4 Turkey wind energy installations ... 35
Figure 4.5 Geothermal potential of Turkey ... 36
Figure 4.6 Geothermal installed capacity of Turkey ... 37
Figure 4.7 World solar installed capacity ... 39
Figure 4.8 Solar energy production in Turkey ... 40
Figure 4.9 Solar energy for electricity generation installed capacity in Turkey... 40
Figure 5.1 Historical unsubsidized LCOE of utility-scale generation... 43
Figure 5.2 Share of coal in electricity generation by source ... 53
vii
LIST OF TABLES
Table 1.1 World primary energy demand projection... 8
Table 2.1 Total lignite reserves by basin... 16
Table 2.2 Turkey hard coal reserves... 17
Table 2.3 Turkey’s coal-fired power plants... 21
Table 3.1 Health effects and economic costs of coal-fired power plants... 27
Table 3.3 Occupational injuries and deaths related to coal mines in Turkey... 29
Table 4.1 World wind energy installed capacity... 33
Table 4.2 Turkey solar potential map... 39
Table 5.1 Renewable energy targets of turkey... 41
Table 5.2 Renewable Energy Feed-in-tariffs ... 44
Table 5.3 Renewable Energy Local Content Contributions ... 45
1
INTRODUCTION
Energy has always played an essential role in human life and has served as a critical input for the economies. Prior to the advent of coal, people could only use wood, wind, fire and water streams in their daily lives as energy sources. Thereafter, coal enabled the Industrial Revolution and became the main energy source, followed by oil and natural gas in the twentieth century. Coal, oil and natural gas – fossil fuels – have become the most important sources for meeting the rising energy demand of a majority of countries. At present, countries are adapting new strategies to move away from fossil fuels, and the share of renewable energy sources (RES) in the world energy mix is increasing. There are two important reasons for this: global climate change and resource scarcity. The biggest contributor to global climate change is fossil fuels, which emit carbon dioxide (CO2) and other greenhouse gases (GHG) when they are combusted. The increasing
amount of GHG in the atmosphere causes temperatures to rise and accordingly serious results of climate change. Today, the world’s average temperature is almost 1.5 °C higher than pre-industrial levels and is set to continue to rise (IPCC, 2018). This rise in temperature is changing the planet’s ecosystem, including hydrological, meteorological and climatological parameters (van Vliet et al., 2012). The most dramatic and direct impacts of climate change are extreme storms, droughts and floods, but further effects are seen in reduced crop productivity and forced migration (UNFCCC, 2018).
Resource scarcity is another important reason for the energy transition. Fossil fuels are finite resources, meaning they will run out eventually. According to BP (2018a), global proven reserves of oil and natural gas are only sufficient enough to meet 50.2 years and 52.6 years, respectively. The reserves-to-production (R/P) ratio of 134 years for coal, however, is almost three times higher than the other fossils fuels (BP, 2019a). Hence, an energy system based on fossil fuels is not a sustainable option for the world (BP, 2018a). Also, fossil fuels are unevenly distributed, which creates a problem of energy security for countries that are poor in them. In the age of fossil fuels, energy security has been a major concern of states. Dependence on fossil fuels remains so today, as 69% of countries face energy-import dependency (TheGlobalEconomy, 2015).
2
Among fossil fuels, coal is the most harmful. Because of its higher carbon and sulphur content, coal causes higher GHG emissions and more pollution than oil or gas. Nevertheless, coal still retains a significant share in the total global primary energy consumption (27.1%) and in electricity generation (38.1%). Moreover, many new coal power plants are expected to be built in the future, and coal is forecast to have a 20% share in the world energy supply until 2040 ( BP, 2018a; ExxonMobil, 2017).
However, due to coal’s negative impacts, countries are adopting new policies to move away from it and switch to RES, which provide electricity generation with no GHG emissions and, by nature of being renewable, are also inexhaustible. In addition, RES are present in many regions across the world and are thus available for local use. Hence, energy import-dependent countries could switch to RES to become more self-sufficient. The transition to RES is happening quickly. In 2018, the world added an estimated 178 gigawatts (GW) of renewable energy to its energy mix (REN21, 2018). The electricity generated from RES has more than doubled in the last decade (BP, 2018a). This increase is expected to continue. Until 2040, the largest installed capacity is expected to come from solar PV and other renewables. To accelerate the pace of this transition, countries are crafting new strategies and on both the national and international levels (REN21, 2018).
Turkey is struggling with this transition. It remains highly dependent on imports for supplying energy. According to data from the Energy Ministry of Turkey, the country imported 75% of its total primary energy demand in 2017. Import dependency of hydrocarbon sources reached 93.9% in oil and 99.3% in natural gas. On the other hand, import dependency is the lowest in coal, consisting of 61.9% of consumption. This external dependence has led to a steady increase in the country’s current account deficit (Kok and Benli, 2017). Energy import-dependence is a major issue for the Turkish economy; energy imports cost $43 billion and account for 20% of total imports (Türkiye Cumhuriyeti Ticaret Bakanlığı, 2019). This overall situation not only threatens Turkey’s energy security but also harms the economy and environment.
Turkey’s CO2 emissions are also rapidly increasing. In the last decade, Turkey’s CO2
emissions rose by 50.51%. At present, Turkey’s annual growth of CO2 emissions is,
12.7%, which is the second largest growth rate in the world after Estonia (BP, 2018a). The biggest contribution to its CO2 emissions is from the power sector, in which
coal-3
powered plants accounted for 37.2% of Turkey’s electricity at the end of 2018 (TEİAŞ, 2018). The country currently has 71 coal power plants; there are also four plants under construction, 29 that are pre-permitted, and 12 that are permitted (EndCoal, 2019). Imported coal accounted for 20.66% of Turkey’s electricity generation in 2018 (TEİAŞ, 2018). The amount paid for coal imports was $749 million in 2002; this increased to $4.6 billion in 2018 (TTK, 2018). In order to offset this economic burden, one of the main objectives of the Turkish government is to reduce coal imports and promote domestic coal by providing incentives to domestic coal production; however, coal imports keep increasing. In addition to the economic and environmental impacts, coal mining in Turkey presents many social issues. Since 2009 coal mining-related deaths totaled 403, which is the highest among European countries (TMMOB Makina Mühendisleri Odası, 2018; Wikiwand, 2019). There are also many health costs of using coal for electricity generation: at least 2,876 premature deaths per year, around 3,823 new cases of chronic bronchitis in adults, 4,311 hospital admissions and 637,643 lost working days (Gümüşel and Stauffer, 2015). The economic cost of the effects of coal on health is estimated to be between €2.9 and €3.6 billion annually (Gümüşel and Stauffer, 2015).
Despite these facts, coal is still forecast to have a significant share in Turkey’s power generation in the coming decades. Existing policies aim to supply the increasing energy demand with coal-powered generation facilities. Among the most prominent objectives of the Ministry of Energy and Natural Resources’ 2015-2019 Strategy Plan is the use of domestic coal resources. Goals 2, 4, and 10 of the Plan included targets and strategies to use domestic energy resources, including coal. In the plan, the most efficient use of domestic coal resources was identified as one of the main objectives, and electricity generation from domestic coal is targeted to reach 60 billion kWh/year in 2019. On the other hand, in the Electricity Market and Security of Supply Strategy Paper prepared by the Ministry, the government targeted to use more lignite for electricity generation by 2023. The emphasis on imported coal is also given in these texts.
In order to reduce the harmful effects of burning coal, Turkey could switch to renewable energy resources, as it has high renewable energy potential. So far, its utilization of these resources has been well below its potential. Renewable energy resources, including hydro and geothermal, accounted for 32% of electricity generation in 2018; if these were removed, and only wind and solar were measured, the figure would drop to 9% of total
4
generation. As is the case around the world, Turkey’s share of RES in its energy mix is increasing. Turkey added 3,995 megawatts (MW) of installed capacity in 2018; RES accounted for 48% of this total installed capacity, including total hydro and geothermal power (TEİAŞ and TÜBİTAK, 2019). In the last decade, installed capacity of renewables grew by 185%, from just 13,586.55 MW in 2007 to 38,751.10 MW in 2017 (TEİAŞ, 2018).
These increases, however, are not enough. In order to achieve energy security and become more self-sufficient, Turkey is aiming to further increase its share of RES. The renewable energy targets are included in the strategic plans of the Energy Ministry. However, there are many barriers to the dissemination of renewable energy installments. Although a rapid increase in RES is expected, coal will continue to contribute a higher level of electricity generation than renewables.
The main purpose of this study is to examine the situation of coal and RES practices and policies in Turkey and make a comparison between these two sources. In order to compare them, this study will focus on the incentives and external costs of coal use, namely health and environmental indices. In this regard, to be able to understand the effects of followed policies and given incentives, the external cost of coal use will be shown with numeric data, which will be used to compare with cost analyses of wind and solar power.
This work is presented in five chapters. The first chapter is the “Coal Developments in the World”. The second chapter provides a brief overview of energy in the Turkey with a focus on coal. It provides a brief background on coal in Turkey: its current reserves, consumption and trade. The third chapter gives the external costs of burning coal mainly in combustion and in mining. The fourth chapter introduces the current situation of renewable energy source in Turkey; the potential and its consumption. Chapter 5 reviews the recent policies that have been directed towards coal and the dissemination of RES. The fifth chapter makes a comparison between coal and renewable energy policies. Finally, conclusion section gives recommendations to Turkey on its coal and RES policies so that it might make a more successful switch to RES based on other successful examples in the world.
5
CHAPTER 1
COAL DEVELOPMENTS IN WORLD
1.1. ENERGY MIX AND TRANSITION
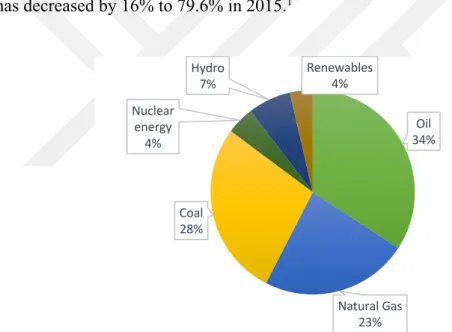
The world is dependent on fossil fuels for its energy. Today, fossil fuels account for 83.9% of the total primary energy consumption in the world (Figure 1.1) (BP, 2018a). This share has been high since the nineteenth century, and the consumption of fossil fuels is constantly rising in gross terms, even if in relative terms it has gradually declined. For instance, the share of fossil fuels in primary energy consumption was 94.1% in 1960, but has decreased by 16% to 79.6% in 2015.1
Figure 1.1 World energy mix 2017 Source: BP 2018a
However, the world is in the midst of an energy transition to RES from fossil fuels. There are two main reasons behind this transition: global climate change and resource scarcity. Fossil fuels are having significant negative impacts on human life and the environment. Burning them creates huge amounts of CO2 and GHG emissions. Air pollution caused by
1 World Bank, N.D. (https://data.worldbank.org/indicator/eg.use.comm.fo.zs)
Oil 34% Natural Gas 23% Coal 28% Nuclear energy 4% Hydro 7% Renewables4%
6
fossil fuels creates undesirable living conditions for people and other health issues, premature deaths, environmental and air pollution, and many other deleterious effects. Today, the earth’s temperature is 1.5°C higher than during pre-industrial times (IPCC, 2018). This will have major impacts on the world like changing climate patterns, floods, droughts and many others.
Today, there are many treaties and conventions to limit global climate change and its consequences. Under the Paris agreement, countries made policy commitments to reduce demand for fossil fuels, but these have yet to put emissions on a course consistent with climate change targets. Policies for to slow extraction of fossil fuels gained attention lately (Day and Day, 2017). Supply-side policies can be categorized as government provision of fossil fuels or funds, whereby the government acquires production rights or compensates resource owners to leave reserves undeveloped (Harstad, 2012).
The fossil fuels are also scarce, meaning that they will be depleted in the future. The global reserves-to-production (R/P) ratio, which measures the average life of a specific resource’s reserves, is 50.2 years for oil, 52.6 years for natural gas, and 134 years for coal (BP, 2018a). Thus, an energy system based on resources that will eventually deplete is not sustainable. This is an important factor propelling the energy transition.
In addition, the reserves of these sources are not unevenly distributed around the world, which creates problems for importing countries to access energy. The legacy of the 1973-4 oil crisis was to conceptualize energy sources as a form of power. The experience of the use an oil embargo to coerce Western states to act in a particular way contributed to analysts conceptualizing energy mainly in terms of its use as a possible weapon (Balmaceda, 2018). This led countries to seek to meet their energy demand by using domestic sources.
1.2 RENEWABLE ENERGY SOURCES
RES are driving the energy transformation that we see today. Because of the severe effects of fossil fuels, the world is now transitioning to RES. There are many reasons why RES is preferred over fossil fuels. First of all, RES provide a cleaner type of energy generation. The sources are not exhaustible as opposed to fossil fuels and are well distributed throughout the world. Thus, many import-dependent countries could use them
7
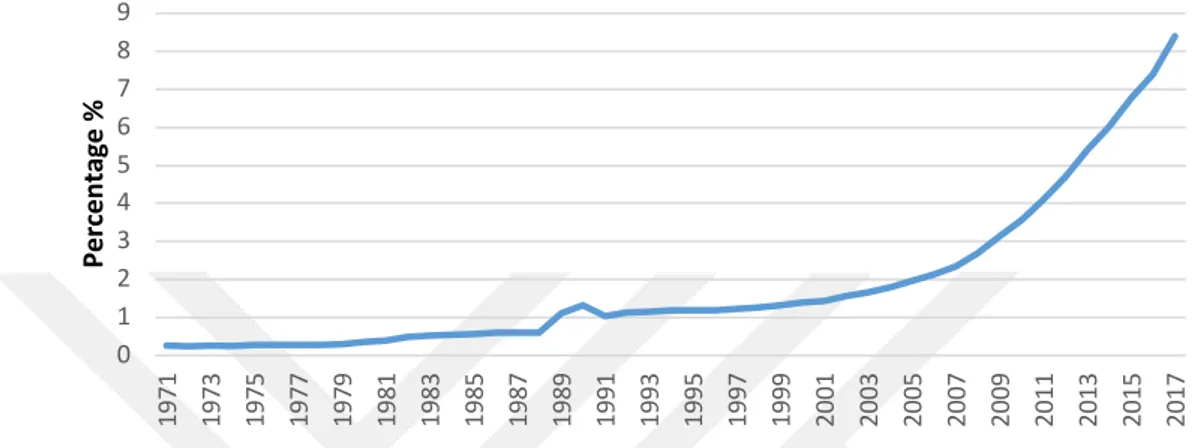
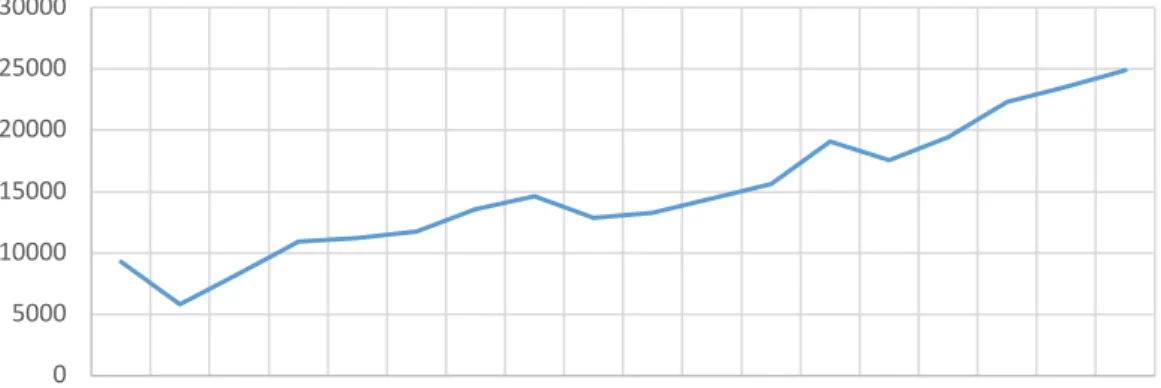
to become self-sufficient in energy. Thus, RES consumption has been growing rapidly in the last decade. Since 2008, the global installed capacity of RES more than doubled (Figure 1.2) (IRENA, 2018a). It increased from 1,057,962 MW in 2008 to 2,179,099 MW in 2017. Excluding hydro power, the share of RES in global electricity generation was 8.4% (BP, 2018a).
In 2017, excluding hydropower, RES consumption grew by 17% (REN21, 2018). Looking at each individual RES, there has been significant change. Solar power installments were 98 GW, accounting for 37% of the total installed capacity in 2017, which is the highest share among all resources. Total solar PV installed capacity grew by 1642% in the last decade (BP, 2018a). Wind installations also grew by astronomical numbers. In the last decade, wind installations grew by 341.8%. There have been records in wind installations in Europe and India, and in offshore wind installations in 2017; overall global wind installations grew by 11% in 2017 compared to 2016 (GWEC, 2017). Biomass and geothermal grew at a much slower rate than solar and wind. Biomass applications grew by 23.1% from 2005 to 2016 (WBA, 2018). Geothermal occurrence depends on the geographical location and geology of a country; thus geothermal is not as abundant as solar and wind, and it only grew by 34.1% over the last decade (WBA, 2018). With growing concern about the environment and importing energy, some countries are adopting new policies to increase their use of RES. These policies are generally in the form of subsidies or tax cuts; governments offer different types of incentives to increase the share of RES in their energy mix. As of 2017, RES policies were established in 121
0 1 2 3 4 5 6 7 8 9 1971 1973 1975 1977 1979 1981 1983 1985 1987 1989 1991 1993 1995 1997 1999 2001 2003 2005 2007 2009 2011 2013 2015 2017 Pe rc en tage %
Figure 1.2 Share of RES in total electricity generation Source: BP 2018a
8
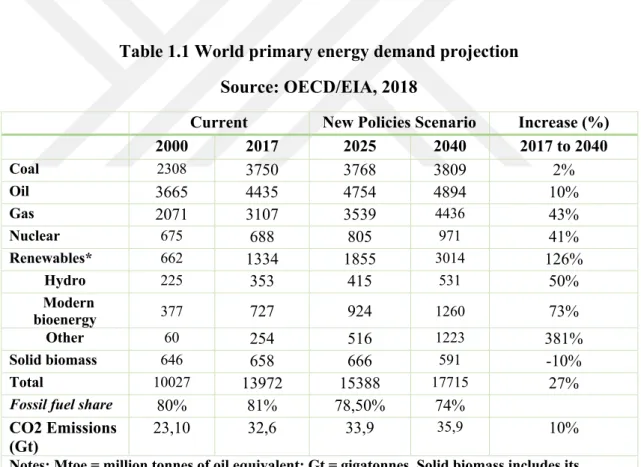
countries (IRENA et al., 2018). These policies will have a significant effect in increasing RES installed capacity. Forecasts show that the share of RES will increase rapidly in the upcoming decades. In 2023, it is expected that RES, excluding hydro, will cover 13% of the total power generation in the world (OECD/IEA, 2018). With many energy efficiency improvements, the increase of electrification, and the adaptation of home appliances to energy transition, the share of RES is expected to reach nearly 18% by 2040, up from only 3.6% today (BP, 2018a; OECD/IEA, 2018). When the projections of IEA examined, the new policies scenario, which includes current policy frameworks and ambitions and evolution of known technologies together, between 2018-2040 global primary energy demand shows an increase over a quarter. According to this scenario highest increase is expected on renewables. Even though there is no decrease demand for coal expected increase is a small number as 2% (Table 1.1) (OECD/IEA, 2018).
Table 1.1 World primary energy demand projection Source: OECD/EIA, 2018
Current New Policies Scenario Increase (%)
2000 2017 2025 2040 2017 to 2040 Coal 2308 3750 3768 3809 2% Oil 3665 4435 4754 4894 10% Gas 2071 3107 3539 4436 43% Nuclear 675 688 805 971 41% Renewables* 662 1334 1855 3014 126% Hydro 225 353 415 531 50% Modern bioenergy 377 727 924 1260 73% Other 60 254 516 1223 381% Solid biomass 646 658 666 591 -10% Total 10027 13972 15388 17715 27%
Fossil fuel share 80% 81% 78,50% 74%
CO2 Emissions
(Gt) 23,10 32,6 33,9
35,9 10%
Notes: Mtoe = million tonnes of oil equivalent; Gt = gigatonnes. Solid biomass includes its traditional use in three-stone fires and in improved cookstoves.
9 1.3 COAL OUTLOOK IN THE WORLD
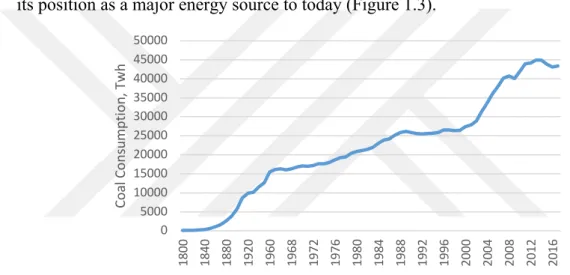
Coal has a significant place in today’s energy world as it has been for many centuries. Coal consumption dates back thousands of years ago to China around 4000BC, although it has been for different purposes than people do today (Ritchie and Roser, 2019). Coal has been known and used for centuries as an energy source, but was not a major component of global energy consumption until the Industrial Revolution. After this, however, coal began to be used extensively. Coal led to many foundational technological developments, such as the steam engine, the railroad, and the steamship, which fundamentally shaped society. Coal consumption has grown ever since, and has retained its position as a major energy source to today (Figure 1.3).
Figure 1.3 World total coal consumption Source: Ritchie and Roser, 2019
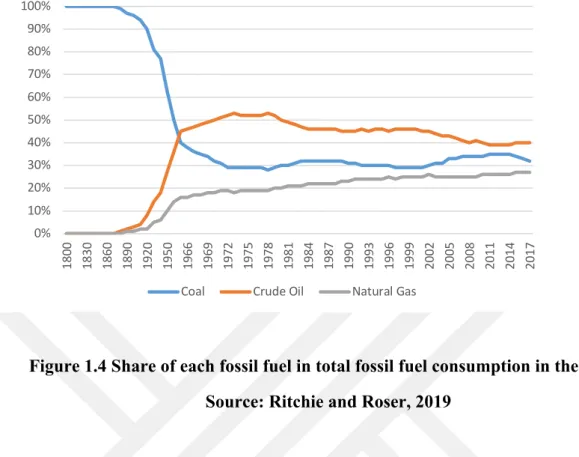
When it first started being used, coal dominated the world and for over a century, coal was the world’s dominant energy source (Cleveland, 2009). With the introduction of other resources such as oil and natural gas, the share of coal naturally fell (Figure 1.4). However, it still has a significant share (27.6%) in the total primary energy consumption (BP, 2018a). 0 5000 10000 15000 20000 25000 30000 35000 40000 45000 50000 1800 1840 1880 1920 1960 1968 1972 1976 1980 1984 1988 1992 1996 2000 2004 2008 2012 2016 Co al Co ns um pt io n, T w h
10
Figure 1.4 Share of each fossil fuel in total fossil fuel consumption in the world Source: Ritchie and Roser, 2019
Despite efforts to curtail the use of fossil fuels, coal production has steadily increased. In 2017, coal production rose by 3.2%, which corresponds to 105 million tons of oil equivalent (Mtoe), the highest increase since 2011. This growth came mostly from Asia, namely from China and India, where production rose 3.6% and 6.9%, respectively. Consumption has also increased in many others regions. India had the highest consumption growth rate in 2017 of 18 Mtoe. While many countries have dramatically increased their use of coal, others have reduced theirs (BP, 2019b).
At the same time, people are growing more aware of the negative effects of coal consumption and more concerned about the environment, prompting more countries to move away from coal. According to the International Energy Agency (IEA), the world had the largest decline of coal production, 418 metric tons (mt), in 2016. This decline, which doubled the one in 2015, can be mainly attributed to the setting of quotas for mine operating days in China. Looking at different regions, overall consumption of coal increased only in Europe and in Asia in 2017 (Enerdata, 2018). India and China were the main drivers of Asia’s consumption growth. Although there has been a decline in two consecutive years in 2015 and 2016, overall consumption of coal has risen over the past
0% 10% 20% 30% 40% 50% 60% 70% 80% 90% 100% 1800 1830 1860 1890 1920 1950 1966 1969 1972 1975 1978 1981 1984 1987 1990 1993 1996 1999 2002 2005 2008 2011 2014 2017
11
four decades. Moreover, after the decline in 2015 and 2016, coal demand rose again in 2017 (IEA, 2018a).
Coal consumption has significant negative impacts on the environment. Energy-related CO2 emissions are the highest in the world compared to any other sector. Moreover,
global energy-related CO2 emissions reached an historic high of 33.1 Gt CO2 in 2018
(IEA, 2019). The growth in CO2 emissions in 2018 was 1.7%, which was 70% higher
than the average increase since 2010. This increase in global CO2 levels was mainly
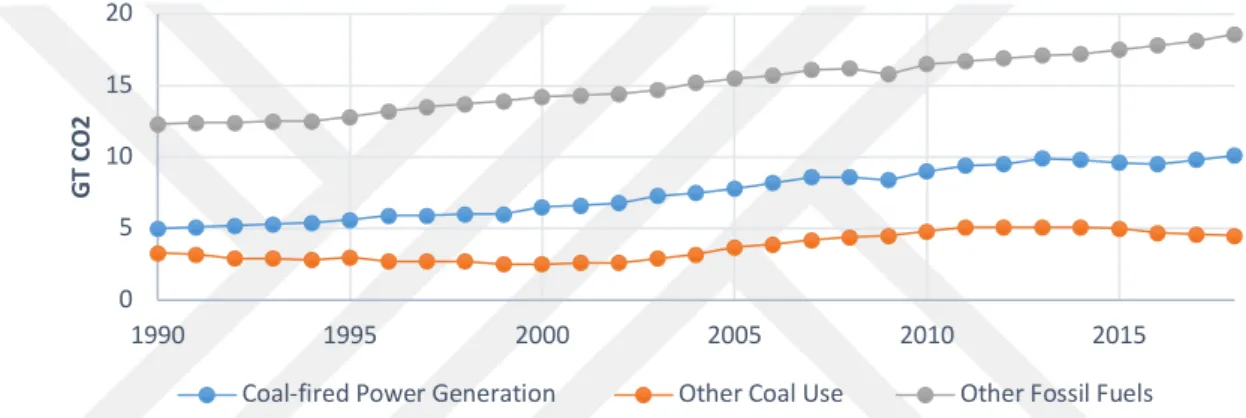
caused by the combustion of fossil fuels (Figure 1.5). The biggest contributor to this increase came from coal-fired power plants.
Figure 1.5 Global energy-related CO2 emissions by source Source: IEA, 2019
Current CO2 levels are three times higher than preindustrial levels. The consequences of
this rise are already apparent. Global temperatures are 1°C higher than preindustrial levels, and the forecasts show that these levels might reach up to 1.5°C depending on different scenarios (IPCC, 2018). Coal alone is responsible for 0.3°C of the 1°C increase of global temperatures (IEA, 2019).
It is estimated that the share of coal consumption in the world’s total energy mix will fall slightly. However, coal consumption will still have a significant share in the global energy mix. The projections show that coal’s share in the energy mix will fall to 25% from 27% (IEA, 2018b). This decrease will come from the policies hindering the growth of coal specifically in Europe and the United States, while those supporting coal in India and China will offset this decline.
0 5 10 15 20 1990 1995 2000 2005 2010 2015 GT C O 2
12
Despite its effects, coal will retain a significant share because it is the largest and most readily available energy source (Cleveland, 2009). Among fossil fuels, coal has the largest share of R/P. The average R/P ratio is 134 for coal in the world as mentioned before (BP, 2018a). The largest coal reserves in the world are in the United States, followed by China, Russia and Australia.
The coal trade constitutes a massive portion of global energy trade. Many countries import coal for their energy security. In 2017, exports of all types of coal increased by 3.3% (IEA, 2018b). Since 2000, total exports of coal grew by 119.5%. Interestingly enough, the trade of coal is growing faster than coal consumption itself. In 2017, the biggest exporters of coal were Indonesia with 28.5% and Australia with 27.6% of the total global coal exports. On the other hand, total coal imports grew by 5.2% in 2017 compared to the previous year. The biggest contribution to this increase came from China, where total coal imports have risen by 6.1%. The three biggest coal importers are China, India and Japan.
With coal being the most readily available energy source, countries around the world are still using it. To overcome the environmental and health costs associated with coal use, new technologies are being developed to decrease the amount of emissions and particles caused by coal combustion. One of the latest technologies is the “clean coal technology”. “Clean coal technologies (CCTs) are technologies that facilitate the use of coal in an environmentally satisfactory and economically viable way” (Chang et al., 2016). With the improvements of this technology, clean coal power plants are now more efficient in electricity generation and have lesser GHG emissions (Melikoglu, 2018). However, the cost of this technology is still too high. This technology is now becoming more widespread in the world specially in the US, China and the European Union.
13
CHAPTER 2
ENERGY SITUATION IN TURKEY WITH A SPECIAL EMPHASIS
ON COAL
2.1. TURKEY’S ENERGY OUTLOOK
Turkey is one of the world’s major developing countries. It has a growing economy and population. In line with this growth, Turkey’s energy demand is growing rapidly. Turkey has a total primary energy supply (tpes) 157.7 Mtoe (BP, 2018a). The country’s tpes had an average growth rate of 4.4% in the last decade and grew by 9.5% from 2016 to 2017. This growth is the third highest in the world after Estonia and Latvia. This fact puts energy security on top of items of Turkish policy agenda.
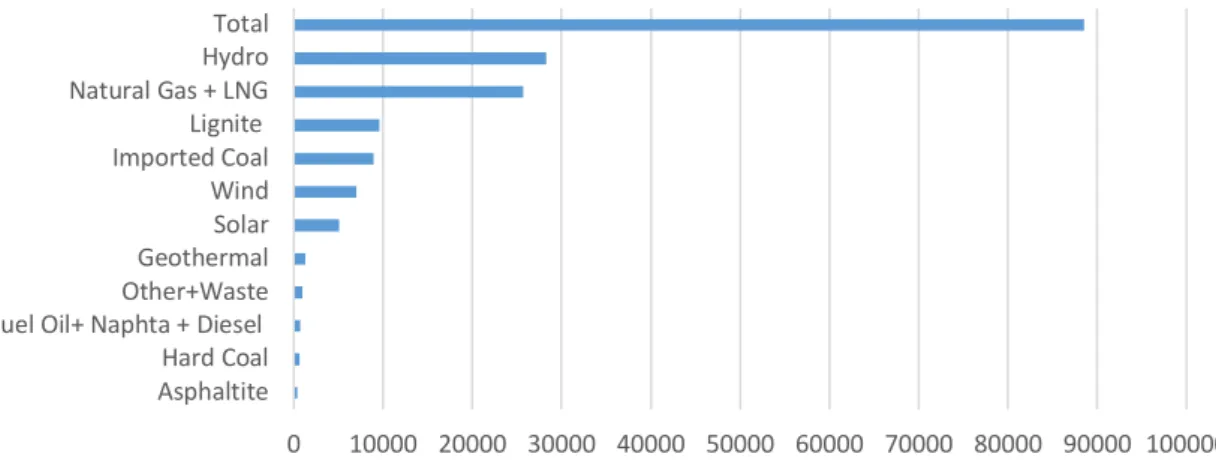
Turkey’s installed capacity for generating electricity was 88,497 MW as of January 2019 (Figure 2.1). Hydropower has the largest share with 31.9%, natural gas 29%, and total coal 22%. However, Turkey required 300,716 GW of electricity generation at the end of 2018 (Figure 2.2). Natural gas has the biggest share of production with 30%, followed by imported coal with a share of 20.66%, or 62,149 GW of total production. The share of total coal is 37% of Turkey’s total electricity generation.
Figure 2.1 Turkey electricity ınstalled capacity, 2019 Source: TEİAŞ and TÜBİTAK, 2019
0 10000 20000 30000 40000 50000 60000 70000 80000 90000 100000 AsphaltiteHard Coal
Fuel Oil+ Naphta + DieselOther+Waste GeothermalSolar Wind Imported Coal Lignite Natural Gas + LNGHydro Total
14
The energy and electricity composition has a big disadvantage. Turkey is an energy-dependent country because there are not enough fossil fuels to produce its own energy to meet domestic energy demand. Turkey thus relies on imports for 75% of its energy consumption. This dependency causes a huge burden on the economy. For the year 2018, the total amount paid for energy imports was $43 billion, which equals to almost 20% of total imports. This amount was 15.6% higher than the year before (Türkiye Cumhuriyeti Ticaret Bakanlığı, 2019).
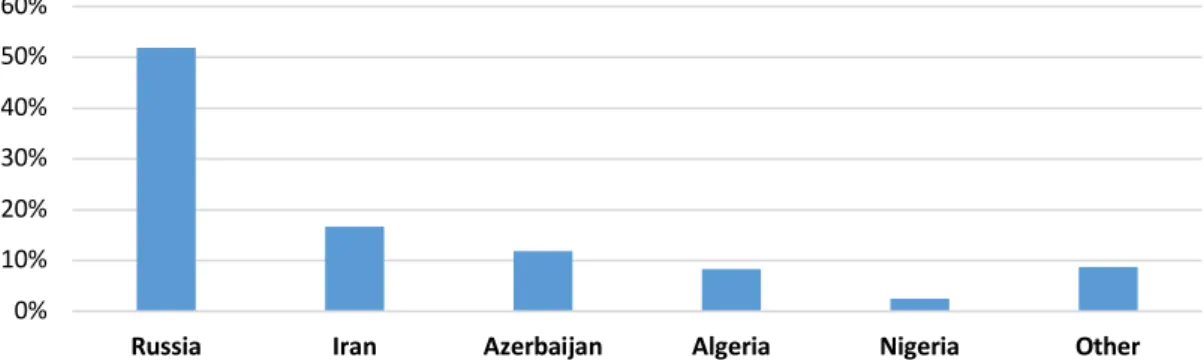
Turkey import almost all of its oil and natual gas consumption. Fossil fuels account for In 2017 Turkey’s natural gas production was equal to less than 1% of its natural gas demand (EPDK, 2018). To cover its energy demand, Turkey imported 99.3% of its natural gas consumption, and Russia had the most significant share of these traded volumes (Figure 2.3.) (EİGM, 2018). During the same year, Turkey produced approximately 6% of its oil demand and imported 93.9% of it, primarily from Iran, Russia and Iraq. 27% of oil imports came from Iran, 19% from Russia and 17% from Iraq in 2017 (Figure 2.4.) (TPAO, 2018). Compared to gas and oil, Turkey has more coal reserves than other fossil fuels, and its import dependency is lower at 61.9% (TPAO, 2018).
Figure 2.2 Turkey electricity generation by source, 2018 Source: TEİAŞ, 2018
0 50000 100000 150000 200000 250000 300000 350000 Fuel Oil+ Naphta + DieselOther+Waste
Geothermal Solar Wind Hard Coal + Lignite +Asphaltite Total Hydro Imported Coal Natural Gas + LNGTotal
15 2.2. COAL OUTLOOK
However, Turkish coal production remained insufficient to meet the energy needs of Turkey, including during the Ottoman period. Nevertheless, at the beginning of the twentieth century, coal was the most important produced source for the Empire in terms of quantity and value (Eldem, 1994). Lignite also existed in the pre-Republic period; lignite deposits in Anatolia began to be explored in the 1860s and, whether lignite or hard coal, coal has been the most important source of energy in Turkey for a long time (Yorulmaz, 1998).
There are different statistics for Turkey’s coal reserves from international and national sources. For example, according to the data from the BP Statistical Review of World
Energy, Turkey has 11,353 million tons of proved coal reserves, with 10,975 million tons
of sub-bituminous and lignite and 378 million tons of anthracite and bituminous coal. This equals 1.1% of all proved reserves of coal in the world (BP, 2018b). On the other
0% 10% 20% 30% 40% 50% 60%
Russia Iran Azerbaijan Algeria Nigeria Other
0% 5% 10% 15% 20% 25% 30%
Iran Russia Iraq Other India Saudi
Arabia Kuwait Greece Bulgaria Israel
Figure 2.3. Natural gas trade volumes of Turkey by country (million sm3) Source: EPDK, 2018
Figure 2.4 Turkey’s Oil Imports as percentage by country 2017 Source: TPAO, 2018a
16
hand, according to Republic of Turkey Ministry of Energy and Natural Resources, Turkey's total coal reserves are about 3.2% of the world's total lignite/sub-bituminous coal reserves, and Turkey has 17.3 billion tons of lignite reserves (T.C. Enerji ve Tabii Kaynaklar Bakanlığı, 2018). Of its 17.3 billion tons of lignite reserves, 46% are located in the Afşin-Elbistan basin (T.C. Enerji ve Tabii Kaynaklar Bakanlığı, 2018). Turkey’s lignite reserves by basin can be seen in Table 2.1.
Table 2.1 Total lignite reserves by basin Source: MTA, 2017
Basin Total Reserve (Ton) Basin Total Reserve (Ton) Afsin- Elbistan 4.642.340.000 Tekirdag — Saray 141.175.000 Konya-Karapinar 1.832.000.000 Cankiri-Orta 123.165.000 Eskisehir (Alpu) 1.453.000.000 Bolu (Salip.-Merkez) 98.000.000
Afyon-Dinar-Dombayova
941.000.000 Canakkale — Can 92.483.000 Manisa-Soma 861.450.000 Edirne 90.000.000 Mugla — Milas 750.214.000 Bingol — Karliova 88.884.000 Tekirdag-Malkara 618.000.000 Bursa (Keles—
Orhaneli) 85.000.000 Tekirdag-Cerkezkoy 573.600.000 Eskisehir(Koyunagili) 57.430.000 Afsin — Elbistan (MTA) 515.000.000 Adiyaman-Golbasi 57.142.000 Ankara-Beypazari 498.000.000 Ankara (Golbasi) 48.000.000 Adana-Tufanbeyli 429.549.000 Bolu — Goynuk 43.454.000 Konya(Beysehir-Seydisehir) 348.000.000 Corum-Dodurga 38.500.000 Kutahya-Tuncbilek 317.732.000 Balikesir 34.000.000 Sivas — Kangal 202.607.000 Kutahya-Gediz 23.945.000
Kutahya-Seyitomer 198.666.000 Amasya-Yeniceltek 19.791.000 Istanbul (Silivri) 180.000.000 Yozgat — Sorgun 13.206.000 Bolu — Mengen 142.757.000 Others 1.928.810.000
As much as considered as a small amount, according to the Turkey Hard Coal Institute, Turkey had a total of 1,520,095,725 tons of hard coal reserves as of 2017 (Table 2.2) (Türkiye Taş Kömürü Kurumu, 2018). The most critical hard coal reserves in Turkey are in Zonguldak and its vicinity, where reserves are estimated at 1.3 billion tons, and the proved reserves are roughly 506 million tons (T.C. Enerji ve Tabii Kaynaklar Bakanlığı, 2018).
17
Table 2.2 Turkey hard coal reserves (Tons) Source: TTK, 2018
On the other hand, most of Turkey’s coal reserves are lignite coal with low thermal value. Although thermal values of lignite are between 1,000 kcal/kg and 4,200 kcal/kg, approximately 90% of Turkey’s lignite’s value is below 3,000 kcal/kg (Türkiye Kömür işletmeleri Kurumu, 2016).
2.3. COAL CONSUMPTION AND IMPORT OF TURKEY
Turkey uses all of its lignite production and does not import any lignite. Until the 1980s, almost all of Turkey’s hard coal needs were met by domestic production, especially for consumption in the iron and steel sector. However, in the following years, domestic production could not keep pace with the increase in demand (Figure 2.5). While 80% percent of total coal consumption was covered by domestic sources at the beginning of the 1980s, this number declined to 45% by the end of that decade. As of 2017, total hard coal consumption was 37,475,000 tons, only 3.29% of which could be covered with domestic sources (Türkiye Taş Kömürü Kurumu, 2018).
Zonguldak
RESERVES Total Hard Coal
A B Amasra 605.929.485 1.520.095.725 Total 31.826.669 154.887.74 8 302.500.80 4 408.899.711 16.051.308 151.161.950 464.758.235 Probable 7.883.164 47.975.000 74.020.000 117.034.000 7.758.000 58.812.778 313.482.942 Possible 15.859.636 40.539.000 94.342.000 159.162.000 3.693.649 7.900.762 Visible 6.174.821 63.052.937 133.756.420 130.855.192 4.159.659 395.954.757 733.953.786 Ready 1.909.048 3.320.811 382.384 1.848.519 440 -
Armutçuk Kozlu Üzülmez Karadon
Reserve Types
18
Starting with a symbolic amount of 16,000 tons in 1973, hard coal imports exceeded 1.5 million tons/year in only a 10-year period. In 2009, imports reached 20.3 million tons. In 2017 coal consumption in Turkey was 37.4 million tons and only 3.29% of which could be provided with domestic hard coal (Figure 2.6.).
Turkey paid $749 million for coal imports in 2002 and $986 million in 2003. In 2007, this amount increased to $2,049 million. In 2016, the amount of foreign exchange outlaid for coal imports rose to $5,300 million. In the first three months of 2017, $5,379,000 of precious foreign currency was paid for hard coal imports (Türkiye Taş Kömürü Kurumu, 2018). 0 5 10 15 20 25 30 35 40 45 50 1960 1965 1970 1975 1980 1985 1990 1995 2000 2005 2010 2015 2020 Co ns up m tio n, M to e 0 5000 10000 15000 20000 25000 30000 2000 2001 2002 2003 2004 2005 2006 2007 2008 2009 2010 2011 2012 2013 2014 2015 2016 2017 Im po rt s, T oe
Figure 2.6 Total import of hard coal and coke Source: (ETKB, 2018).
Figure 2.5 Coal consumption of Turkey Source: (BP, 2018b)
19
In order to meet Turkey’s rising energy demand since 2005, domestic resources have been given importance in the country's policies. This included detailed lignite exploration activities in the Afşin-Elbistan lignite basin from 2005-2008 financed by EÜAŞ and implemented by the MTA. Support from the Turkey Coal Enterprises in various basins has also provided significant increases in exploration work, which was carried out by MTA lignite reserves, so that lignite reserves could be discovered in more than forty cities (Ediger, 2014). As a result of ongoing coal-exploration activities, which were intensified since 2005 by the MTA in line with the policy of the use of domestic resources in energy, 13 new coalfields were discovered, four of which had vast reserves (Karapınar-Ayrancı, Eskişehir-Alpu, Afyon-Dinar, Tekirdağ-Malkara). Also, the amount of reserves was increased in three existing fields (MTA, 2017). As a result of this policy, lignite reserves, which were 8.3 billion tons in 2005, reached 17.3 billion tons in 2018, with an increase of over 9 billion tons (T.C. Enerji ve Tabii Kaynaklar Bakanlığı, 2018). This increase meant an almost doubling of the total amount over the last ten years.
Yet hard coal production remained insignificant and heavily subsidized (EUROCOAL, 2018). In 2016, hard coal production was 1.3 mt (EURACOAL, 2017). By the end of 2016, the share of coal in total primary energy consumption in Turkey was 28% (T.C. Enerji ve Tabii Kaynaklar Bakanlığı, 2018). However, hard coal production dropped by 7.7% to 1.2 mt in 2017. Despite the decrease in production, hard coal deliveries to power plants increased by 11.2% to 18.8 mt from 16.9 mt in 2016. This increase was procured with increasing coal imports in 2017. Coal imports were 36.6 mt in 2017, which is 4.9% higher compared to imports in 2016 (EURACOAL, 2017). In the first half of 2018, a total of 53.9 TWh of electricity were generated from coal-based power plants, and the share in total electricity generation was 33.0% (T.C. Enerji ve Tabii Kaynaklar Bakanlığı, 2018). As of the first half of 2018, coal-fired power plant installed capacity is 18.666 MW, or 21.4% of the total installed capacity. The installed capacity based on domestic coal is 10,570 MW (12.1%), and the installed capacity based on imported coal is 8,794 MW (10.1%) (T.C. Enerji ve Tabii Kaynaklar Bakanlığı, 2018).
As can be seen, the installed power from domestic fired power and imported coal-fired power are quite close to each other. In the following chapter, Turkey’s coal-coal-fired power plants will be examined more deeply.
20 2.3.1. Coal-Fired Power Plants in Turkey
As announced by the Turkish Ministry of Energy and Natural Resources, the number of electricity power generation plants in the country, including unlicensed plants, is 6.886 in the first half of 2018. Of these existing plants, 636 are hydroelectric, 63 coal, 232 wind, 40 geothermal, 303 natural gas, 5,422 solar, and 190 “other” power plants. As mentioned in the previous chapter, domestic coal sources used to generate electricity in Turkey consist mainly of low-quality lignite coal, as Turkey has a limited amount of hard coal resources. According to data from the Energy Market Regulatory Agency (EMRA), there are 34 domestic coal-fired power plants in operation with production licenses; one of them is asphaltite, another is hard coal, and the rest are lignite-fired. There are also six power plants in the construction stage. Data from TEİAŞ indicates that the installed capacity of domestic lignite and asphaltite-fired thermal power plants is 9,911.60 MW, with 40,694.4 GWh of electricity produced, as of the end of 2017. In addition, there are 10 imported coal-fired power plants in operation with production license and seven more are in under construction, according to EMRA. According to TEİAŞ, the installed capacity of imported coal-fired thermal power plants is 8,793.9 MW, with 51,118.1 GWh of electricity produced in lignite-fired thermal plants as of the end of 2017.
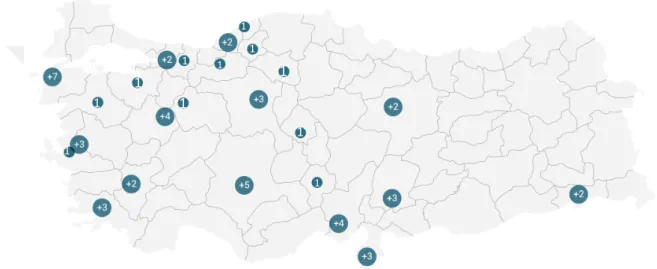
The number of coal-fired power plant units in Turkey can be classified in the following way: six announced, 29 pre-permitted, 12 permitted, four under construction, and 71 in operation, making a total of 122 as of January 2019. The 71 units in operation have a total installed capacity of 18,826 MW (Table 2.3.) (End Coal, 2018). These thermic power plants are generally located in the Aegean and the Central Anatolian part of the country; closer to the high electricity demand centers (Figure 2.7.). Until 2013, the state operated the large-scale coal-fired power plants that used domestic coal. However, with the privatizations since 2013, the operating rights of these coal fields were transferred to private companies (TMMOB, 2017).
21
* Includes units 30 MW and larger
Figure 2.7 Number of existing and under construction coal power plants in Turkey Source: TMMOB, 2017
The total capacity of the announced, pre-permitted and permitted will be 36,666 MW (End Coal, 2018). These thermic power plants are also located in similar locations. These projects also include the expansion of the existing power plants.
As mentioned in the previous section, new coal reserves obtained through exploration accelerated after 2005. These reserves provided the impetus for building power plants. The majority of the resources mentioned are licensed to public institutions. The total installed power potential of these resources is uncertain but believed to be around 20,000 MW. Although an additional 20,000 MW in capacity is a difficult target to achieve, once economic, technical, financial or environmental obstacles are reached, Turkey's coal production will increase fourfold, and consumption will increase threefold. This production situation is equal to 180 times the production of the whole Zonguldak basin and approximately 20 times that of the Soma basin. This increase will lead at least 150
Turkey Announced
Pre-permit Permitted
Under
Construction Shelved Operating
Cancelled 2010-2018
Units 6 29 12 4 31 71 62
MW 12,800 17,311 6,555 800 24,554 18,826 41,031
Table 2.3 Turkey’s coal-fired power plants* Source: End Coal, 2018
1 1 1 1 1 1 1 1 1 1 1
22
million mt of additional CO2 emissions, which is nearly equal to Turkey's current carbon
23
CHAPTER 3
EXTERNAL EFFECTS OF COAL
The cost of electricity generation can be calculated as the total of project development costs, technology costs, engineering works, utility systems costs, operating costs, and purchase of fuel and other inputs (Acar et al., 2015). In the context of the cost-benefit calculations used in EIAs, the cost of coal used as a fuel in thermal power plants is calculated based on the market price of coal. Although this method is widely accepted, the market price does not take into account the economic costs of the negative effects of coal during the mining, transport and combustion phases. Therefore, the price of coal does not include all the costs it creates; in other words, a shareholder who wants to generate energy by buying coal does not pay all the costs of the coal that he uses. These unpaid costs are charged to various segments of society: the negative health effects of coal mining to miners, the negative health effects caused by coal-fired power plants to people living in their vicinity, and the damage to agricultural production suffered by farmers (Akbulut, 2017). Hence, the market value of coal is cheaper than it should actually be, as all the effects of coal in the production, transportation and consumption stages carry additional economic costs (Akbulut, 2017).
As it has been said in previous chapters, coal-fired electric power plants have an important place in Turkey's energy policies and are a cheap source of energy. However, a large-scale coal-fired power plant works for approximately 40 years and will have many impacts throughout its lifecycle. Moreover, the new coal-fired power plants will cause a significant increase in carbon emissions and thus contribute to global climate change. Thus, the current policies of Turkey portend that Turkey’s climate commitment are consistent with a warming of over 4°C (EUROCOAL, 2018).
During the lifecycle of a coal power plant, thousands of tons of harmful pollutants are released into the atmosphere every year. Pollutants are released from the chimneys of coal-fired thermal power plants, and these wastes pollute water and soil and therefore pose a great threat to public health (Figure 3.1). Building new coal-fired power plants
24
means that harmful substances remain in the atmosphere for years, and future generations will live with their negative health effects (Gümüşel and Stauffer, 2015).
A report published by the Health and Environment Alliance (HEAL) in 2015 showed that the health costs of coal use for electricity generation in Turkey cause at least 2,876 premature deaths per year, 3,823 new cases of chronic bronchitis in adults, 4,311 hospital admissions, and 637,643 lost working days (Gümüşel and Stauffer, 2015). The economic cost of coal on health is estimated to be between 2.9 and 3.6 billion euros annually. These figures issue reflect the cost of exposure in Turkey to particulate matter (PM) impacts
Figure 3.1 Health Effects of Coal-fired Power Plants Source: Gümüşel and Stauffer, 2015
25
associated with the two major groups of chronic diseases – respiratory and heart disease. Another is the release of mercury and lead into the air during the operation of a powered thermic plant. In addition, other metals and semi-metals are emitted from coal-fired thermal power plants that are frequently covered by the term heavy metals in the medical context. These include arsenic, beryllium and chromium, which are known to cause cancer (Gümüşel and Stauffer, 2015).
A material flow analysis for Turkey estimated that coal-fired power plants produce 10,551 kg of mercury into the atmosphere and that 88% of this amount is released into the air annually (Civancik-Uslu and Yetis, 2015). Cognitive development may be adversely affected by intensive exposure to mercury, and irreversible damage to vital organs of a fetus may occur. Therefore, large amounts of mercury emissions from thermal power plants are serious concerns for human health (Gümüşel and Stauffer, 2015). The mercury released into the air enters the water cycle through rainfall and accumulates as it rises in the food chain. It is stored in large quantities especially in some species of fish. People can also be exposed to mercury through consuming fish contaminated with mercury (Sackett et al., 2010). Nutrient ingestion of organic mercury causes toxic effects and congenital disorders. It significantly affects children's brain development. This damage is neurologically irreversible and is usually due to exposure to mercury in the early-fetal period. Nowadays, brain damage occurs by exposure to lower doses than in the past (Grandjean et al., 1997).
Lead is also released from some coal-fired power plants. Like mercury, lead damages children's developing nervous systems. In adults, it can degrade the functions of the cardiovascular system, which can lead to death and cause high blood pressure or anemia (World Health Organization, 2010, 2001). It affects almost every system in the body and is directly toxic in high doses (Gümüşel and Stauffer, 2015). Current research shows that children who are exposed to mercury or lead are three to five times more likely to have problems related to attention deficit and hyperactivity disorder (ADHD), and this exposure usually occurs before birth (Olivier et al., 2012).
Pollutants released into the air from the chimneys of coal-fired thermal power plants pose an even greater threat to public health compared to the wastes that enter the water and soil. Coal thermal power plants are found to emit a large amount of particulate matter (PM), sulfur dioxide, and indirectly they release nitrogen oxides, which causes ozone
26
formation (Myllyvirta, 2014). The health-related concerns of these pollutants are about particulate matter (PM 2.5) and ozone gas, which have a diameter of less than 2.5 microns (Gümüşel and Stauffer, 2015). Particulate matter in the air affects people more than other pollutants. The main components of PM are sulphate, nitrates, ammonia, sodium chloride, carbon, mineral powder and water. PM 2.5 is more dangerous because it can even interfere with the gas exchange in the lungs by reaching the peripheral areas of the bronchi (Myllyvirta, 2014). According to HEAL, 20% of health problems attributable to PM exposure in Turkey stems from coal burned in power plants. Also, the cloud of exhaust gas from the chimneys can be transported across borders by traversing hundreds of kilometers; pollutants can accumulate in ecosystems and in the lungs of people. For this reason, the health damage caused by the use of coal is not limited to areas in the vicinity of the plants themselves. The height of the chimneys and wind conditions determine where the pollution is carried (Gümüşel and Stauffer, 2015).
In addition to all these deleterious effects, two more terms are important: “loss life year” and “lost working day”. A report from Stuttgart University converted the number of deaths attributed to air pollution to the number of years lost due to premature deaths. Accordingly, in the case of life loss caused by particulate pollution, the life span of the individual is reduced by approximately 11 years, while life loss due to exposure to ozone gas is shortened by nine months. The study revealed that pollution from coal-fired power plants caused approximately 7,900 deaths in 2010 (Myllyvirta, 2013). Researchers estimated that the lives of these people have decreased by 86,000 years in total. An investigation of over 500,000 adults from fifty U.S. states with different levels of air pollution between 1982 and 1999 revealed that air pollution increased the risk of death (Myllyvirta, 2013). Moreover, air pollution, as well as increasing the risk of developing a variety of diseases, including employees whose health problems cause additional sick leave. This refers to term “lost working day.” These permits are spread over a wide range, ranging from small-scale respiratory tract infections and cough disorders to convalescence after a heart attack (Myllyvirta, 2013).
A further key issue is that emissions from coal-fired power plants cause acid rainfall and heavy metal-containing fly ash accumulation. These emissions damage plants, agricultural areas, ecosystems, and properties (TEMA, 2017). In 2015, HEAL made an
27
assessment of the health impacts and costs of thermal power plants based on updated emissions data on health effects and costs of thermal power plants and new scientific evidence on the health effects of air pollution in Turkey. According to this assessment, the primary health effects resulting from coal-fired power plants are the following (Gümüşel and Stauffer, 2015). Cost calculations for this data are given in euro in the Table 3.1 below.
Table 3.1 Health effects and economic costs of coal-fired power plants Source: Gümüşel and Stauffer, 2015
Health Effect Level of Effect (Number of
Case or Day)
Economic Cost (€)
Death (Adults) 2876 3110
Life year loss (Adults) 86393 2428
Premature deaths 13 22
Chronic bronchitis (adults) 3823 100
Bronchitis (Children) 25576 8
Hospital admissions due to respiratory disorders (All age
groups) 2864 3
Hospital admissions due to cardiovascular disorders (All age
groups) 1447 2
Activity Loss (All age groups) 7976070 357
Asthma Symptoms (Children) 225384 5
Lost work day 637643 40
Total Value (lower limit) - 2964
Total Value (upper limit) - 3646
3.1. HARMFUL EFFECTS OF LIGNITE
As a result of burning one ton of lignite, less air pollution generally occurs compared to burning the same amount of hard coal. However, since lignite has a lower energy content than hard coal, about three times more lignite coal will have to be burned to produce the same amount of electricity. Therefore, a lignite power plant will generate a higher amount of harmful pollutant emissions than a hard coal-fired thermal power plant with the same electrical power output. Turkey's indigenous lignite has low calorific value and relatively
28
high amounts of ash, moisture, and sulfur content. Therefore, the air pollution arising from the burning of this lignite is also high (Say, 2006).
Coal-fired thermal plants as a whole are the source of three times more than the World Health Organization’s satisfactory level of particulate matter (PM), sulfur dioxide (SO2), mercury, arsenic, and cadmium in the air of Turkey’s cities (Cagla Uyanusta Kucuk and Ilgaz, 2015). The coal plants causing the most harmful effects on health in Turkey are the state-owned Electricity Generation Company’s (EGC) Afşin-Elbistan, Soma, and Tunçbilek plants. Afşin-Elbistan and Soma also have the highest possible pollution-related mortality rate in Europe (Myllyvirta, 2013). If the expansion project of the Afşin-Elbistan power plant is realized, it is estimated that this plant will cause "loss life years" of 8,000 each year. In Europe, it is accepted that the most negative impacts on human health will be caused by this project (Myllyvirta, 2014).
Another issue with thermal power plants is that they need large amounts of water for processing and cooling. A large amount of water is drawn, used and consumed from the source to convert the heat into mechanical energy and then to electrical energy (Gündoğan et al., 2018). Therefore, thermal power plants are generally installed on the shores of water. If thermal power plants do not return water to their source, this is called water use. The amount of water consumption varies according to the systems used. The majority (90%) of systems used in Turkish thermal power plants have lower system costs because they consume more water. In this case, coal-fired power plants make a major contribution to climate change while increasing the stress on water resources (El-Khozondar and Koksal, 2017). Thus, they are continually harming their assets in a vicious cycle by causing water scarcity (IEA, 2016; van Vliet et al., 2012).
In addition, thermal power plants pose a threat in the form of wastewater, including slag troughs, washing and cleaning water, oily water, coal-stock area drainage, etc., which poses various environmental and social risks (Gündoğan et al., 2018). According to TÜİK data, in 2016 a total of 8.5 billion m3 of wastewater was discharged by all kind of thermal
power plants in Turkey. There is no classification by type of the plants. When the cooling water was removed from this amount, only 10.5% of the remaining part was treated (TÜİK, 2016). In terms of solid wastes, a total of 19.5 million tons of waste, including 12 thousand tons of “dangerous” waste was reported in the year 2016 (Gündoğan et al., 2018).
29
3.2. ACCIDENTS IN COAL MINING SECTOR IN TURKEY
The mining sector is rife with occupational accidents and diseases. This is especially true in Turkey, where complex geological structures in the coal regions make it even more difficult to manufacture with fully mechanized systems; hence coal production is mainly carried out using labor-intensive manpower (TTK, 2018). The shortcomings in the legal regulations, implementation, and lack of effective supervision over occupational safety result in serious injuries, disabilities, and death rates from mining-related occupational accidents (Acar et al., 2015). Due to the often-repeated fatal mining accidents in recent years, questions have been raised relating to the structure of the mines, as well as about the health and safety of workers. In the coal sector alone, a total of 649 people lost their lives due to occupational accidents and occupational diseases in the period from 2007-2016, while the number of those who became permanently incapable of working reached 83,427 (Table 3.2). Among the causes of the explosions and fires in the mines in Turkey, not exactly fulfilling the requirements of the production process, deficiencies and defects in production plans and projects, and lack of air conditioning are among the primary culprits (Güyagüler, 2002). From this point of view, it can be said that employment in the coal sector is not attractive. Poor and dangerous working conditions, low wages, lack of unionization, and security risks increase the social costs of coal mining for the public (Acar et al., 2015).
Source: Acar et al., 2015; TMMOB Makina Mühendisleri Odası, 2018
Year Occupational Injuries Occupational Deaths
2007 6293 38 2008 5728 30 2009 8193 3 2010 8150 92 2011 9217 58 2012 8828 20 2013 11289 36 2014 10026 335 2015 7429 26 2016 8274 11 Total 83427 649
30
At the same time, mining activities and electricity production affect the availability and quality of water resources, and lead to the pollution of the land and loss of biodiversity.
31
CHAPTER 4
RENEWABLE ENERGY SOURCES IN TURKEY
Turkey has significant potential for renewable energy sources (RES) (Ediger and Kentel, 1999). Geological structure of the country, various geographical formations as well as the climatic belt that Turkey located are factors that supports this potential (Arslan, 2017). Turkey tries to follow up the recent global developments; therefore, its renewable energy installed capacity and energy generation from renewable sources keeps increasing (Figure 4.1).
Figure 4.1 Renewable energy generation by source in Turkey Source: TEİAŞ
4.1. HYDROPOWER
Although hydropower is described as renewable, there are many questions about its sustainability. Hydropower dams are built on vast lands, and main concern is that dams can harm local ecosystems (Matejicek, 2017). In order to clear the areas where hydropower plants will be built, hundreds if not thousands of trees need to be cut down, which invariably changes the climate of the area and the variety of animals decreases. As animals living nearby try to adapt to their new environmental conditions, many do not survive. In addition, dams cause the temperature of the river water to change, which
0 10 20 30 40 50 60 70 80 2004 2006 2008 2010 2012 2014 2016 2018 Gen er at io n, T w h