© TÜBİTAK
doi:10.3906/kim-1903-28 h t t p : / / j o u r n a l s . t u b i t a k . g o v . t r / c h e m /
Research Article
Highly sensitive fluorometric method based on nitrogen-doped carbon dot
clusters for tartrazine determination in cookies samples
Abidin GÜMRÜKÇÜOĞLU1, Aysel BAŞOĞLU2, Sevgi KOLAYLI1, Saliha DİNÇ3,
Meryem KARA4, Miraç OCAK1, Ümmühan OCAK1,∗
1Department of Chemistry, Faculty of Arts and Sciences, Karadeniz Technical University, Trabzon, Turkey 2Department of Occupational Health and Safety, Faculty of Health Sciences, Gümüşhane University,
Gümüşhane, Turkey
3Organic Farming Management, Çumra School of Applied Sciences, Selçuk University, Konya, Turkey 4Advanced Technology Research & Application Center, Çumra Vocational School, Selçuk University, Konya, Turkey
Received: 06.03.2019 • Accepted/Published Online: 21.10.2019 • Final Version: 11.02.2020
Abstract: Nitrogen-doped carbon nanodots (CDs) were prepared via the solvothermal method, using urea and
triethy-lene glycol as the starting materials. The as-prepared CDs had individual diameters of approximately 100 nm and were in clusters of different sizes. The surface composition and optical properties of the as-prepared CDs were characterized. They exhibited multicolor emission properties in the visible range when excited with a wide wavelength range. The aqueous solution of the CDs was used in highly sensitive tartrazine determination. The fluorescence quenching of the CDs was in a linear relationship with the concentrations of tartrazine in the range of 0.5–30.0 µ M. The detection limit of the assay was 0.18 µ M. Acceptable recovery results were obtained via spike-recovery experiments on cookie samples.
Key words: Carbon dot, amorphous, fluorescence, tartrazine, determination method, cookie
1. Introduction
Orange-colored tartrazine is a commonly used synthetic food colorant in drugs, food, cosmetics, and the pharmaceutical industry. Azo-dye tartrazine is known as FD&C Yellow No. 5, C.I. No. 19140, Food Yellow No. 4, and E102 [1]. Its excess utilization in food may cause adverse health effects including allergic reactions, migraines, eczema, anxiety, oxidative stress, and DNA damage [2,3]. Due to their impact on health, the use of food dyes in foodstuffs is also monitored legally [4]. Therefore, efficient, rapid, simple, and suitable analytical techniques are needed for the assurance of health and food safety. To date, various determination techniques have been applied for tartrazine dye, such as chromatography, mass spectrometry, capillary electrophoresis, and electrochemical methods [1,2]. However, these methods require sophisticated equipment and time-consuming sample preparation steps that may not be suitable for routine detection. Therefore, there is a significant need to develop economic, simple, and ecofriendly detection strategies for food colorants, including tartrazine dye.
Nanomaterials have opened new frontiers with a wide range of applications, such as the utilization of biosensors for environmental and food safety monitoring, disease detection, drug discovery, and point-of-care monitoring [5]. Carbon nanodots (CDs) are usually nanoparticles that have a size below 10 nm [6]. However, CDs larger than 10 nm have also been reported in the literature [7]. These nanostructures have attracted attention due to their useful optical properties, such as high quantum yield and long wavelength
∗Correspondence: [email protected]
emissions [5,8,9]. Since discovered, CDs have intensively been used in many application areas in the fields of medical diagnosis, catalysis, bioimaging, and sensors [10,11]. Easy and green synthesis, low toxicity, excellent biocompatibility, good photostability, good water solubility, and low cost are some of the unique benefits of CDs [12]. The emission characteristics of CDs with distinct optical properties change according to their size due to quantum confinement effects [8]. Any simple compounds, such as citric acid, urea, and ascorbic acid, can be used as starting materials to prepare CDs [13]. Furthermore, materials including foods, plants, candle soot, and waste have also been used as carbon sources for the synthesis of CDs [14]. The extraction of CDs from some food sources and food wastes are also applicable [15].
Synthesis methods for carbon dots are basically classified into top-down and bottom-up methods. In the top-down method, CDs are prepared from a large carbon structure such as a carbon nanotube and graphite using laser ablation, arc-discharge, and electrochemical methods, while in the bottom-up approach, CDs are synthesized from molecular precursors, such as citric acid and urea, using hydrothermal, microwave-assisted methods, combustion, or thermal routes [8]. The optical properties of CDs may be improved via heteroatom doping or surface passivation techniques [16]. With its atomic size comparable to that of carbon atoms, the nitrogen atom is considered as an important element for the doping of carbon dots [17]. Wang et al. synthesized high photoluminescence quantum yield nitrogen (N)-doped carbon dots using precursors of urea and diethylene glycol by microwave pyrolysis to determine iron(III) [18].
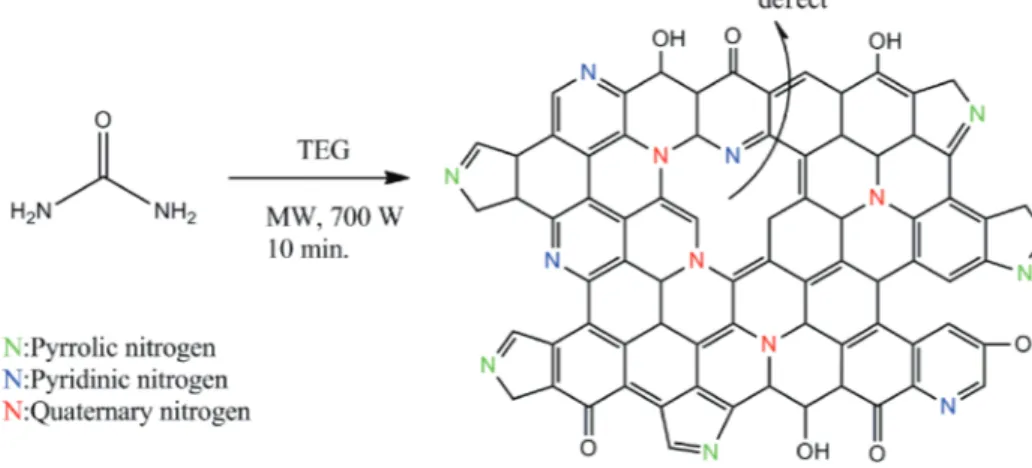
Recently, fluorescent carbon dots obtained from aloe were developed for the selective detection of tar-trazine in food samples of candy, steamed buns, and honey by a few researchers [19]. In a similar way, luminescent CDs from citrus peels were used for tartrazine sensing in different food matrices, such as ice cream, juice, and energy drinks [20]. There was no application in cookie matrices among these studies. Cookie matrix is different from the matrices in these previous studies. Despite the existence of these few studies on the utilization of CDs in the determination of synthetic food dyes, to the best of our knowledge, there have been no studies on the utilization of doped CDs for the determination of tartrazine in cookies. Herein, we developed a fluorescence probe for the determination of tartrazine in cookie matrix, for the first time, using N-doped CDs synthesized from molecular precursors of urea and triethylene glycol (TEG) via the solvothermal method using a domestic microwave oven.
2. Materials and methods 2.1. Instrumentation
All fluorescent measurements were performed on a PTI QM-4 spectrofluorometer with a slit width of 1.0 nm in a 1-cm quartz cell. UV-Vis absorption spectra of CDs were recorded on an Analytik Jena Specord 210 spectrophotometer (Analytik Jena AG, Jena, Germany). Transmission electron microscopy (TEM) studies for the morphological characterization of CDs were carried out using an FEI TALOS F200S TEM 200 kV (Thermo Fisher Scientific, Waltham, MA, USA). Next, 1 mL of the aqueous CD solution was diluted with ethanol and ultrasonicated before being placed on a carbon-coated copper grid and dried at room temperature. The FTIR spectra were recorded on a PerkinElmer 1600 spectrophotometer (PerkinElmer, Inc., Waltham, MA, USA) in the range of 550–4000 cm−1 after the CDs had been freeze-dried. X-ray photoelectron spectroscopy (XPS) was conducted using an ESCALAB MK II X-ray photoelectron spectrometer (Thermo Fisher Scientific). For the analysis, several drops of the CD solution were applied to a thoroughly cleaned silicon wafer and dried in a vacuum oven. X-ray diffraction (XRD) patterns were obtained with a Bruker D2-phaser diffractometer using
CuK α radiation ( λ = 1.5418 Å). For the XRD analysis, the sample was prepared by dropping the CD solution onto a cleaned glass wafer. Deionized water in the analytical measurements was obtained using the Sartorius Milli-Q system (arium 611UV; Sartorius AG, Göttingen, Germany).
2.2. Reagents
Urea and TEG, purchased from Merck (Darmstadt, Germany), were used to prepare the CDs. Quinine sulfate (Sigma-Aldrich, St. Louis, MO, USA) was used as the fluorescence standard compound. Sunset yellow, allura red, quinoline yellow, and tartrazine were all purchased from Sigma-Aldrich. The stock solutions of tartrazine and allura red were prepared in water. Ethanol was used to prepare the stock solutions of sunset yellow and quinoline yellow. The working solutions were prepared by an appropriate dilution of the stock solution (1000
µ M).
2.3. Samples
Cookie samples were purchased from local markets in Trabzon, Turkey. Extraction of tartrazine in the samples was carried out with water. Next, 2.0 g of the spiked cookie sample and the original cookie sample, in 100 mL of water, was held in an ultrasonic bath for 15 min. After the treatment, the mixture was shaken at 140 rpm for 30 min, and then filtered through a 0.20- µ m membrane. The filtrate of the spiked sample was used as the sample solution. The filtrate of the original sample was used as the matrix solution.
2.4. Preparation of the carbon dots
Fluorescent CDs were synthesized using the solvothermal method. Therefore, 1 g of urea was added to 10 mL of TEG, and then ultrasonicated for 5 min to form a transparent solution. The solution was kept in a domestic microwave oven (700 W, Sinbo, Turkey) for 10 min. The color of the solution changing from colorless to yellow was an indicator of the formation of CDs. The yellow solution was used by 1/1250 (V/V) dilution with deionized water in the fluorescence measurements.
2.5. Determination of the quantum yield
To determine the relative fluorescence quantum yield of the CDs ( Φx) , quinine sulfate dissolved in 0.1 M H2SO4
was used as the reference (quantum yield is 0.546) [21]. The emission (excited at 320 nm) and absorption spectra of the CDs and quinine sulfate at different concentrations were recorded. The absorbance values at 320 nm were then plotted on the X-axis and the areas of the emission spectra were plotted on the Y-axis to determine the slope of the curve. The quantum yield was then determined using Eq. (1):
Φx= ΦR(mx/mR)(ηx2/η
2
R). (1)
Here, Φx and ΦR represent the quantum yield of the CDs and quinine sulfate, respectively. mx and mR represent the slope of the curve related to the CDs and the reference, respectively. η is the refractive index of the solvent. The refractive index of quinine sulfate (1.33) equals those of the CDs dissolved in deionized water. The experimental details are given in the Supplemental information.
2.6. Tartrazine determination
The method was based on fluorescence quenching of the CDs with tartrazine. A kind of standard addition method was used to determine the tartrazine amount in food samples. A similar standard addition method
was previously used in the fluorometric determination of a banned synthetic food dye, Sudan I [22]. The experimental details are given in the Supplemental information.
3. Results and discussion
3.1. Synthesis and characterization of the CDs
A 1-step synthesis procedure involving the solvothermal method was performed to prepare the CDs using a domestic microwave oven (Figure 1).
Figure 1. Synthesis and structural representation of the nitrogen-doped CDs in this study.
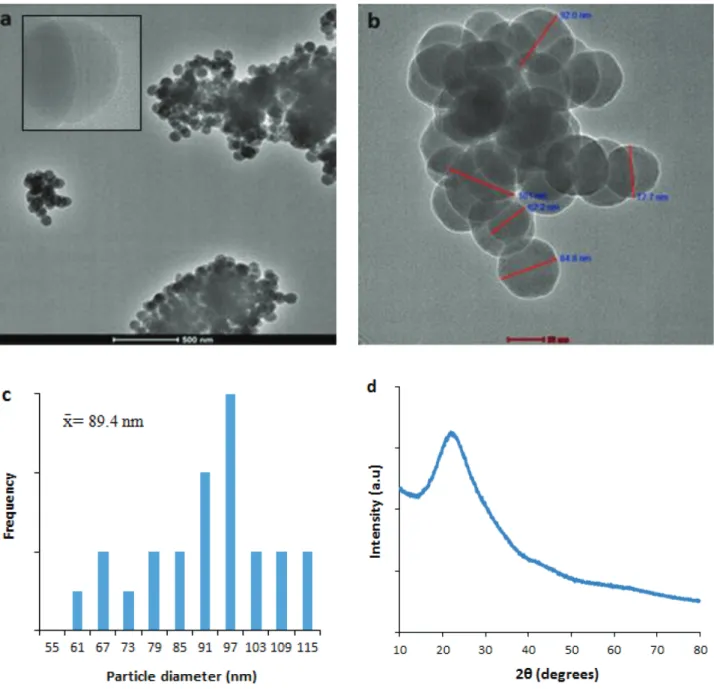
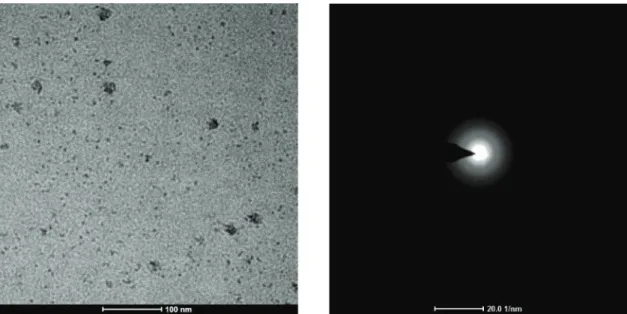
The CDs were obtained as a viscous liquid. Their morphology and microstructure were investigated via high-resolution transmission electron microscopy. The TEM image of the CDs in the microscale showed clusters in different shapes, just like carbon black (Figure 2a). A few CDs with similar aggregation have been reported in the literature [23–26]. When the image of a cluster was magnified, it was seen that CDs with different diameters had almost spherical structures (Figure 2b). The average diameter of the particles in Figure 2b was determined as 89.4 ± 14.2 nm. There was no signature of fringes in the high-magnification image of the CDs, which showed the amorphous structures of the CDs (Figure 2a, inset). Diameters of the amorphous CDs varied between ∼61 and ∼113 nm, as shown in the histogram (Figure 2c). The broad hump centered at ∼2θ = 22◦ in the XRD profile shown in Figure 2d reflects that the material had a defective structural order, namely weak graphitic crystallinity. This kind of hump has been widely reported for XRD patterns of amorphous carbon [27–30]. The interlayer spacing of ∼0.4 nm calculated from Bragg’s law was larger than that of the graphite
with an interlayer spacing of 0.3 nm. This result can be explained by the presence of functional groups, such as O-H and C=O, on the surface of the weakly graphitic sheets within the CDs [30,31]. After purification of the CDs with dialysis, the TEM images were obtained (Figure S1, left). There were no CD clusters in the images and good dispersion of the CDs was observed. The amorphous structure of the CDs is supported by the selected-area electron diffraction (SAED) image of an individual CD as shown in Figure S1 (right).
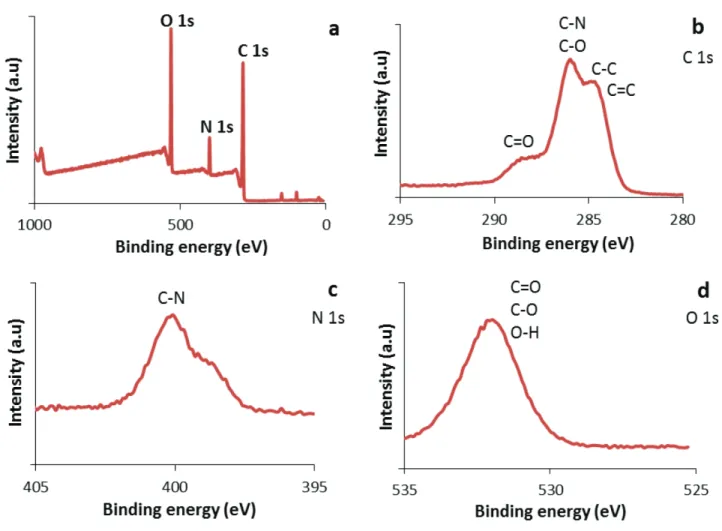
The XPS and FTIR spectra provided detailed information about the functional groups on the surface of the CDs. XPS was used to characterize the elemental surface composition of the CDs. Figure 3a shows XPS spectra with 3 peaks centered at 285.1 eV (C 1s), 400.1 eV (N 1s), and 532.4 eV (O 1s), indicating the presence of carbon, nitrogen, and oxygen in the structure. These 3 main peaks were examined in detail. Three peak groups at 284.5–285.4, 286.0, and 288.4–289.1 eV in the C 1s spectra were assigned to the C=C/C–C,
Figure 2. TEM images, particle distributions, and XRD profile of the CDs. a) CD nanoclusters in micro size, inset:
high magnification image showing 2 overlapped CDs without the signature of any fringe; b) CD nanocluster with different particle sizes; c) particle size distribution; d) XRD profile of the CDs.
C–O/C–N, and C=O groups, respectively (Figure 3b) [18,19]. The N 1s band consisted of 3 types of peaks: pyridinic, pyrrolic, and quaternary nitrogen, with bond energies between 397.8 and 401.9 eV (Figure 3c) [32,33]. The main peak was at 400.1 eV, which was attributed to a pyrrolic C-N bond [33]. These peaks indicated that nitrogen was doped on the surface of the CDs [33]. Namely, the dopant nitrogen atoms were inserted in the defect area or the surface of the slightly graphitic structure. Figure 3d shows the O 1s spectra with a broad peak between 534.2 and 530.3 eV, which can be attributed to C=O/O-H and C-O [27]. Specifically, the peak centered at 532.3 eV resulted from the OH bond [23].
Figure 3. XPS full spectrum for the CDs. a) C 1s, b) N 1s, c) O 1s, d): spectra.
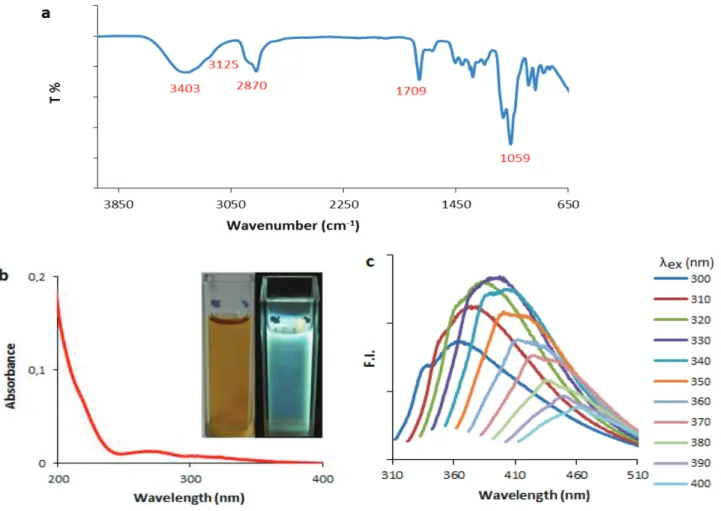
To further detect the functional groups of the CDs, FTIR spectroscopy was used, as shown in Figure 4a. The peak at 3403 cm−1 was attributed to the O-H stretching vibration. The band at 2870 cm−1 was attributed to aliphatic C-H bonds. Aromatic C-H stretching vibration was observed 3125 cm−1 in the FTIR spectra, suggesting that a graphitic structure was contained in the CDs. This result was compatible with the XPS analysis. In the XPS spectra, C=C binding energy was observed at about 284.5 eV [23]. In the FTIR spectra, the absorption peak at 1709 cm−1 was assigned to the stretching vibration of C=O coming from urea under solvothermal treatment in TEG. The sharp peak at around 1059 cm−1 contributed to the stretching vibration bands of C-O and C-N. These vibration bands suggested that the surface of the CDs was passivated by surface groups during the carbonization process of urea. Based on all of the characterization data, the proposed structure for the CDs is given in Figure 1.
The photoluminescence (PL) of CDs is one of the most important features that enables their use for analytical purposes [13,16]. Both crystalline and amorphous CDs exhibit PL properties [30]. CDs synthesized by the bottom-up method would generally have an amorphous structure [30]. Although the mechanism of PL of both CD species is not well understood, it is thought that the surface defects and emissive energy traps are primarily responsible for the fluorescence characteristics [34]. The band at 265 nm in the absorption spectra of CDs is related to π –π * transitions of the C=O bond. The aspect of the spectra in Figure 4b
was very characteristic for CDs [35]. The aqueous solution of the as-prepared CDs was clear yellow in color under ambient light, while it showed strong blue fluorescence when excited at 365 nm (Figure 4b, inset). Specifically, the multicolor properties of amorphous CDs could be explained by abundant surface defects and high entropy states in amorphous nanostructures [27]. Figure 4c shows the excitation wavelength-dependent emission properties of the CDs. As can be seen from Figure 4, different emission maxima were obtained in the blue region with increasing excitation wavelength. This type of excitation wavelength-dependent emission has been generally observed with CDs in the literature [5,6].
Figure 4. Optical properties of the CDs. a) FTIR spectra, b) UV-Vis absorption spectra (inset: under ambient and
UV light), c) emission spectra at different excitation wavelengths.
The fluorescence quantum yield of the CDs was calculated according to a known method [36]. The quantum yield was determined as 11% at an excitation wavelength of 320 nm using quinine as a reference (Figure S2). Absorbance in the 1-cm fluorescence cuvette should never exceed 0.01 at the excitation wavelength to minimize the effects of reabsorption. The high quantum yield results from nitrogen doping into the nanostructure [32,37].
3.2. Interaction with food dyes
The interaction of tartrazine, sunset yellow, allura red, and quinoline yellow with the as-prepared CDs based on urea was investigated via the fluorometric measurements.
Figure 5 shows the changes in the fluorescence spectra of the CDs with the food dyes, all of which caused fluorescence quenching in the spectra. However, the prepared calibration graphs did not work to determine these food dyes in real samples, except for tartrazine. Consequently, it was determined that the CDs were suitable for the determination of only tartrazine among the tested food dyes. The quenching mechanism of the CDs with tartrazine was investigated using Stern–Volmer analysis (Figure S5). The results are given in the Supplemental information.
Figure 5. Effect of the food dyes on the fluorescence spectra of the CDs. Excitation wavelength: 360 nm. AR: alurra
red, SY: sunset yellow, T: tartrazine, QY: quinoline yellow.
3.3. Tartrazine determination
Figure 6 shows the change in the fluorescence spectra of the CDs with increasing tartrazine concentration.
Figure 6. Fluorescence quenching in the spectra of the CDs with increasing tartrazine concentrations. Inset: Calibration
As seen in Figure 6, there was regular fluorescence quenching in all of the spectra while the tartrazine concentration increased. From the fluorescence intensity at 425 nm, an external calibration graph was prepared to determine tartrazine (Figure 6, inset). As seen in Figure 6 (inset), there was a deviation from Beer’s law after 30 µ M of tartrazine. The linear range was between 0.5 µ M and 30 µ M. The external calibration line was tested to determine tartrazine in the cookie samples. However, satisfactory accuracy values could not be achieved using the external calibration graph. Therefore, a kind of standard addition method was used in the tartrazine determination. The experimental details are given in the Supplemental information (Figures S3 and S4). This kind of calibration procedure in fluorometric methods was previously used [22].
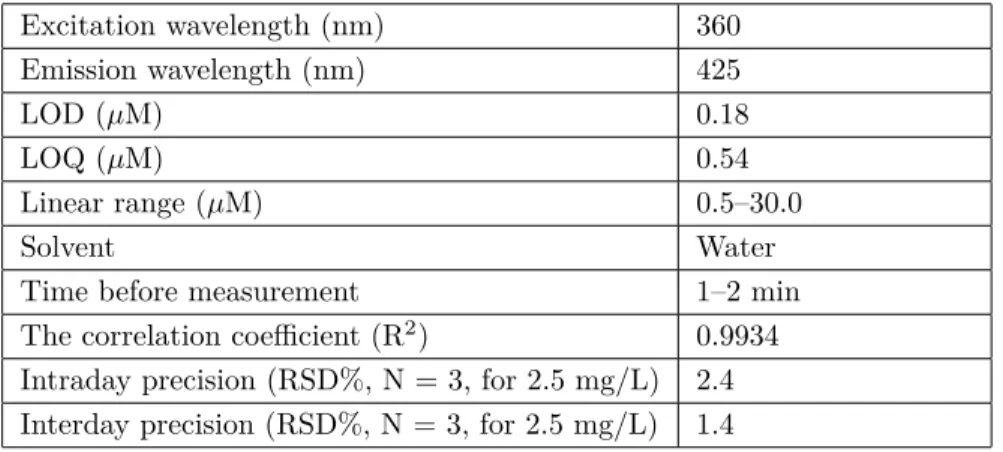
The analytical performance data for the developed method are presented in Table 1.
Table 1. Analytical performance data of the proposed method for tartrazine determination.
Excitation wavelength (nm) 360 Emission wavelength (nm) 425 LOD (µM) 0.18 LOQ (µM) 0.54 Linear range (µM) 0.5–30.0 Solvent Water
Time before measurement 1–2 min
The correlation coefficient (R2) 0.9934
Intraday precision (RSD%, N = 3, for 2.5 mg/L) 2.4 Interday precision (RSD%, N = 3, for 2.5 mg/L) 1.4
RSD%: Relative standard deviation, LOD: limit of detection, LOQ: limit of quantification.
As seen from Table 1, the correlation coefficient was 0.9934, indicating good linearity. To calculate the limit of detection (LOD), 3 times the standard deviation was divided by the slope of the calibration line. To determine the standard deviation in these experiments, 11 measurements of the blank response were carried out. The limit of quantification (LOQ) was determined as 3 times the LOD.
The accuracy of the method was verified by the analysis of the spiked cookie samples at different concentration levels. The standard addition method was applied to 4 different concentration levels in the linear range, and recovery was between 99.8% and 96.9% for these concentration levels (Table 2). The results showed that the proposed method can be applied for the determination of tartrazine in cookies samples.
Table 2. Recovery studies of tartrazine in the cookie samples.
Added (mg/L) Found (mg/L) Amount in the sample (mg/L)± RSD% R%
2.5 5.0 2.5± 4.0 96.9
5 7.5 2.5± 0.6 99.4
6 8.5 2.5± 0.2 95.0
R%: Recovery%.
The cookie samples were also analyzed using the standard high-performance liquid chromatography (HPLC) method [38]. The results are compared in Table 3. Student’s t-test was used to statistically analyze the results. The calculated Student’s t-value (0.68) was less than the theoretical value (4.30) at a confidence
level of 95%. Therefore, the statistical calculation showed no significant difference between the results of the proposed method and the standard method [38].
Table 3. Comparison of the tartrazine results in the cookie samples (N = 3).
Proposed method (mg/kg) RSD% R% Standard method (mg/kg) [38] MUa R%
255.7 4.0 97.1 262.0 13.1 98.8
aMeasurement uncertainty.
3.4. Comparison with other methods
A comparison of the proposed method and some other methods for the determination of tartrazine is given in Table 4.
Table 4. Comparison of some tartrazine determination methods in the literature.
Method Reagent Sample LR (µM) LOD (µM) Ref.
FL CDs (citrus peels) Ice cream, juice, energy drink 0.6–23.5 0.2 [20] FL CDs (aloe) Candy, honey, steamed buns 0.25–32.5 0.07 [19]
HPLC PA Juice, saffron, rice, cookie 0.93–4.68 0.07 [43]
FL CDs (urea) Cookie 0.5–30.0 0.18 TS
FL: Fluorescence, LR: linear range, TS: this study, PA: polyamide adsorbent.
Tartrazine in food is usually determined using spectrophotometric, electrochemical, and chromatographic methods [39–42]. However, there are few chromatographic methods used for the determination of tartrazine in cookies [43]. As seen in Table 3, the linear range of the method proposed in the literature was quite narrow (0.93–4.68 µ M) [43]. Moreover, the recovery was low (59%) [43]. There are 2 studies regarding the determination of tartrazine by CDs. Citrus peels and aloe, as a carbon source, were used to prepare CDs in these studies, respectively [19,20]. Xu et al. used CDs from aloe to determine tartrazine in steamed buns, as well as honey and candy samples [19]. However, they used a Teflon-lined autoclave and it was necessary to heat the carbon source at 180 ◦C for 11 h to obtain the CDs. Similarly, in the other study, citrus peels were heated in a furnace at 180 ◦C for 2 h to prepare the CDs [20]. Moreover, no application was made in a matrix similar to a cookie sample in these studies [19,20]. The present study was the first to use CDs for tartrazine determination in a cookie matrix. The preparation of the CDs was simple and fast (10 min) and needed only a domestic microwave oven. Therefore, this simple and fast method will fill the gap in the literature for the determination of tartrazine in cookie matrices. Moreover, the proposed method to determine tartrazine was inexpensive and fast when compared to other expensive and time-consuming HPLC methods in the literature.
References
1. Rovina K, Siddiquee S, Shaarani SM. A review of extraction and analytical methods for the determination of tartrazine (E 102) in foodstuffs. Critical Reviews in Analytical Chemistry 2017; 47 (4): 309-324.
doi: 10.1080/10408347.2017.1287558
2. Mazlan SZ, Lee YH, Hanifah SA. A new laccase based biosensor for tartrazine. Sensors (Switzerland) 2017; 17 (12): 1-12. doi: 10.3390/s17122859
3. Visweswaran B, Krishnamoorthy G. Oxidative stress by tartrazine in the testis of Wistar rats. Journal of Phar-maceutical and Biological Sciences 2012; 2 (3): 44-49.
4. Karim-Nezhad G, Khorablou Z, Zamani M, Seyed Dorraji P, Alamgholiloo M. Voltammetric sensor for tartrazine determination in soft drinks using poly (p-aminobenzenesulfonic acid)/zinc oxide nanoparticles in carbon paste electrode. Journal of Food and Drug Analysis 2017; 25 (2): 293-301. doi: 10.1016/j.jfda.2016.10.002
5. Zuo P, Lu X, Sun Z, Guo Y, He H. A review on syntheses, properties, characterization and bioanalytical applications of fluorescent carbon dots. Microchimica Acta 2016; 183 (2): 519-542. doi: 10.1007/s00604-015-1705-3
6. Tuerhong M, Xu Y, Yin XB. Review on carbon dots and their applications. Chinese Journal of Analytical Chemistry 2017; 45 (1): 139-150. doi: 10.1016/S1872-2040(16)60990-8
7. Yang Z, Li Z, Xu M, Zhang L, Zhang J et al. Controllable synthesis of fluorescent carbon. Micro and Nano Letters 2013; 5 (4): 247-259.
8. Choi Y, Choi Y, Kwon OH, Kim BS. Carbon dots: bottom-up syntheses, properties, and light-harvesting applica-tions. Chemistry – An Asian Journal 2018; 13 (6): 586-598. doi: 10.1002/asia.201701736
9. Namdari P, Negahdari B, Eatemadi A. Synthesis, properties and biomedical applications of carbon-based quantum dots: an updated review. Biomedicine & Pharmacotherapy 2017; 87 (88): 209-222. doi: 10.1016/j.biopha.2016.12.108 10. Li H, He X, Kang Z, Huang H, Liu Y et al. Water-soluble fluorescent carbon quantum dots and photocatalyst
design. Angewandte Chemie International Edition 2010; 49 (26): 4430-4434. doi: 10.1002/anie.200906154
11. Lim SY, Shen W, Gao Z. Carbon quantum dots and their applications. Chemical Society Reviews 2015; 44 (1): 362-381. doi: 10.1039/c4cs00269e
12. Dinc S, Kara M. Synthesis and applications of carbon dots from food and natural products: a mini-review. Journal of Apitherapy and Nature 2018; 1 (1): 33-37.
13. Zhang J, Yu SH. Carbon dots: large-scale synthesis, sensing and bioimaging. Materials Today 2016; 19 (7): 382-393. doi: 10.1016/j.mattod.2015.11.008
14. Das R, Bandyopadhyay R, Pramanik P. Carbon quantum dots from natural resource: a review. Materials Today Chemistry 2018; 8: 96-109. doi: 10.1016/j.mtchem.2018.03.003
15. Dinç S. A simple and green extraction of carbon dots from sugar beet molasses: biosensor applications. Sugar Industry 2016; 9: 560-564.
16. Cao L, Wang X, Meziani MJ, Lu F, Wang H et al. Carbon dots for multiphoton bioimaging. Journal of the American Chemical Society 2007; 129 (37): 11318-11319. doi: 10.1021/ja073527l
17. Tan HC, Zhao WH, Qiu Q, Zhang R, Zuo Y et al. Green synthesis of nitrogen-doped fluorescent carbon quantum dots for selective detection of iron. Fullerenes Nanotubes and Carbon Nanostructures 2017; 25 (7): 417-422. doi: 10.1080/1536383X.2017.1326102
18. Wang Y, Wang C, Guo H, Wang Y, Huang Z. A nitrogen-doped three-dimensional carbon framework for high performance sodium ion batteries. RSC Advances 2017; 7 (3): 1588-1592. doi: 10.1039/c6ra27088c
19. Xu H, Yang X, Li G, Zhao C, Liao X. Green synthesis of fluorescent carbon dots for selective detection of tartrazine in food samples. Journal of Agricultural and Food Chemistry 2015; 63 (30): 6707-6714. doi: 10.1021/acs.jafc.5b02319 20. Chatzimitakos T, Kasouni A, Sygellou L, Avgeropoulos A, Troganis A et al. Two of a kind but different: luminescent carbon quantum dots from citrus peels for iron and tartrazine sensing and cell imaging. Talanta 2017; 175: 305-312. doi: 10.1016/j.talanta.2017.07.053
21. Taniguchi M, Lindsey JS. Database of absorption and fluorescence spectra of > 300 common compounds for use in photochem CAD. Photochemistry and Photobiology 2018; 94: 290-327.
22. Çağılcı OC, Gümrükçüoğlu A, Alp H, Vanlı E, Ocak Ü et al. A simple fluorimetric method to determine Sudan I dye in spices. Karadeniz Chemical Science and Technology 2017; 01: EA.1-EA.4.
23. Lyth SM, Ma W, Liu J, Daio T, Sasaki K et al. Solvothermal synthesis of superhydrophobic hollow carbon nanoparticles from a fluorinated alcohol. Nanoscale 2015; 7: 16087-16093. doi: 10.1039/c5nr03484a
24. Sun L, Teng TH, Rashid MH, Krysmann M, Dallas P et al. Electrogenerated chemiluminescence from carbon dots. Materials Research Society Symposium Proceedings 2011; 1284: 131-136. doi: 10.1557/opl.2011.650
25. Guo B, Zebda R, Drake SJ, Sayes CM. Synergistic effect of co-exposure to carbon black and Fe2O3 nanoparticles
on oxidative stress in cultured lung epithelial cells. Particle and Fibre Toxicology 2009; 6: 1-13. doi: 10.1186/1743-8977-6-4
26. Tripathi KM, Tran TS, Tung TT, Losic D, Kim T. Water soluble fluorescent carbon nanodots from biosource for cells imaging. Journal of Nanomaterials 2017; 2017: 7029731. doi: 10.1155/2017/7029731
27. Siddique AB, Pramanick AK, Chatterjee S, Ray M. Amorphous carbon dots and their remarkable ability to detect 2,4,6-trinitrophenol. Scientific Reports 2018; 8 (1): 1-10. doi: 10.1038/s41598-018-28021-9
28. Kelarakis, A. From highly graphitic to amorphous carbon dots: A critical review. MRS Energy and Sustainability 2014; 1: E2. doi: 10.1557/mre.2014.7
29. Bhaisare ML, Talib A, Khan MS, Pandey S, Wu HF. Synthesis of fluorescent carbon dots via microwave car-bonization of citric acid in presence of tetraoctylammonium ion, and their application to cellular bioimaging. Microchimica Acta 2015; 182 (13-14): 2173-2181. doi: 10.1007/s00604-015-1541-5
30. Essner JB, Laber CH, Ravula S, Polo-Parada L, Baker GA. Pee-dots: biocompatible fluorescent carbon dots derived from the upcycling of urine. Green Chemistry 2016; 18 (1): 243-250. doi: 10.1039/c5gc02032h
31. De B, Karak NA. Green and facile approach for the synthesis of water soluble fluorescent carbon dots from banana juice. RSC Advances 2013; 3 (22): 8286-8290. doi: 10.1039/c3ra00088e
32. Pillar-Little T, Kim DY. Differentiating the impact of nitrogen chemical states on optical properties of nitrogen-doped graphene quantum dots. RSC Advances 2017; 7 (76): 48263-48267. doi: 10.1039/c7ra09252k
33. Ding W, Wei Z, Chen S, Qi X, Yang T et al. Space-confinement-induced synthesis of pyridinic- and pyrrolic-nitrogen-doped graphene for the catalysis of oxygen reduction. Angewandte Chemie International Edition 2013; 52 (45): 11755-11759. doi: 10.1002/anie.201303924
34. Sun YP, Zhou B, Lin Y, Wang W, Fernando KAS et al. Quantum-sized carbon dots for bright and colorful photoluminescence. Journal of the American Chemical Society 2006; 128 (24): 7756-7757. doi: 10.1021/ja062677d 35. Sun C, Zhang Y, Wang P, Yang Y, Wang Y et al. Synthesis of nitrogen and sulfur co-doped carbon dots from garlic for selective detection of Fe3+. Nanoscale Research Letters 2016; 11 (1): 1-9. doi: 10.1186/s11671-016-1326-8
36. Gong J, An X, Yan X. A novel rapid and green synthesis of highly luminescence carbon dots with good biocom-patibility for cell imaging. New Journal of Chemistry 2014; 38: 1376-1379. doi: 10.1039/C3NJ01320K
37. Xu Q, Li B, Ye Y, Cai W, Li W et al. Synthesis, mechanical investigation, and application of nitrogen and phosphorus co-doped carbon dots with a high photoluminescent quantum yield. Nano Research 2018; 11 (7): 3691-3701. doi: 10.1007/s12274-017-1937-0
38. Yoshioka N, Ichihashi K. Determination of 40 synthetic food colors in drinks and candies by high-performance liquid chromatography using a short column with photodiode array detection. Talanta 2008; 74 (5): 1408-1413. doi: 10.1016/j.talanta.2007.09.015
39. Abu Shawish HM, Ghalwa NA, Saadeh SM, Harazeen HE. Development of novel potentiometric sensors for determination of tartrazine dye concentration in foodstuff products. Food Chemistry 2013; 138 (1): 126-132. doi: 10.1016/j.foodchem.2012.10.048
40. Alves SP, Brum DM, Branco de Andrade ÉC, Pereira Netto AD. Determination of synthetic dyes in selected foodstuffs by high performance liquid chromatography with UV-DAD detection. Food Chemistry 2008; 107 (1): 489-496. doi: 10.1016/j.foodchem.2007.07.054
41. Zhao L, Zeng B, Zhao F. Electrochemical determination of tartrazine using a molecularly imprinted polymer – multiwalled carbon nanotubes - ionic liquid supported Pt nanoparticles composite film coated electrode. Elec-trochimica Acta 2014; 146: 611-617. doi: 10.1016/j.electacta.2014.08.108
42. Sahraei R, Farmany A, Mortazavi SS. A nanosilver-based spectrophotometry method for sensitive determination of tartrazine in food samples. Food Chemistry 2013; 138 (2-3): 1239-1242. doi: 10.1016/j.foodchem.2012.11.029 43. Hajimahmoodi M, Afsharimanesh M, Moghaddam G, Sadeghi N, Oveisi MR et al. Determination of eight synthetic
dyes in foodstuffs by green liquid chromatography. Food Additives & Contaminants: Part A: Chemistry, Analysis, Control, Exposure & Risk Assessment. 2013; 30 (5): 780-785. doi: 10.1080/19440049.2013.774465
Supplementary information 1. Characterization of the CDs
The CDs were purified with a 6000-Da molecular weight cut-off dialysis bag. After 24 h of dialysis against ultrapure water, the solution outside of the dialysis bag was collected and the ultrasonic process was applied to the aqueous solution for 20 min. The TEM images of the final solution were obtained (Figure S1, left). As seen in Figure S1 (left), a good particle size distribution was observed below ∼10 nm. Moreover, the SAED images of the individual dots were obtained to see the crystallinity of the CDs (Figure S1, right). As seen in Figure S1 (right), the diffraction rings were observed in the SAED image, resulting from the amorphous structure of the CDs.
Figure S 1. TEM image of the CDs after the dialysis and ultrasonication process (left) and the SAED image of an
individual CD (right).
2. The proposed method
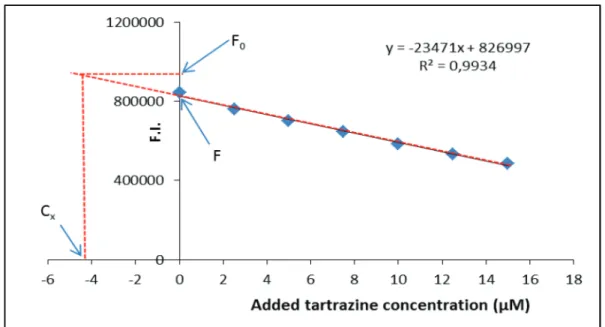
CDs (2 mL) and an aliquot of the matrix solution (100 µ L) were added to all of the tubes. A certain volume of the sample solution was added to all of the tubes, except for the first tube, to complete the final volume to 4 mL. The difference between the fluorescence intensities of the first and the second tubes was related to the tartrazine concentration in the sample solution. Fluorescence intensity of all solutions was measured at 425 nm. Using Eq. (1), the tartrazine concentration was calculated.
Cx= (F0− F1)/m (1)
In Eq. (1), Cx is the tartrazine concentration of the spiked sample in the tubes. Fluorescence intensities of the first and second tubes are represented by F0 and F1, respectively. m is the slope of the standard
addition graph. Figures S3 and S4 show the fluorescence quenching of the solution in the tubes with increasing tartrazine amount and the standard addition graph for the determination of tartrazine (2.8 µ M) in the spiked cookie sample, respectively.
Figure S2. Integrated PL intensity and absorbance of the CDs and QS to determine the quantum yield (excited at 320
nm).
Figure S3. Quenching in the fluorescence spectra of the CDs with increasing tartrazine concentrations. 3. Quenching mechanism
The Stern–Volmer relationship can explain the quenching mechanism of the fluorescent CDs by tartrazine as a quencher, as seen in Eq. (2).
I0/I = 1 + Ksv[Q] (2)
In Eq. (2), Ksv is the Stern–Volmer quenching constant and I0 and I are the fluorescence intensities
in the absence and presence of the quencher, respectively. [Q] represents the concentration of the quencher. When the quenching mechanism fits the Stern–Volmer equation, the plot of I0/I versus the quencher molar
Figure S4. Standard addition graph for tartrazine determination (4.2 µ M) in the cookie sample with CDs.
the static quenching process based on the complexation in the ground state should yield a linear Stern–Volmer plot.
Figure S5 shows the Stern–Volmer plot for the tartrazine-based quenching of the CDs. The I0/I term
linearly increased with the increasing tartrazine molar concentration until reaching 1.5 × 10⁻⁵ M. However, there was a positive deviation from the typically linear Stern–Volmer relationship after this concentration. This result showed that both static and dynamic quenching was observed in the system.