Proc.Nati.Acad. Sci. USA
Vol.76, No. 7,pp.3325-3829,July1979 Biophysics
Acoustic
microscopy:
Resolution of
subcellular
detail
(ultrasound/mechanicalproperties/cytoplasmicthickness/nuclei,actincables,andmitochondria)
R. N. JOHNSTON*, A. ATALARt,J. HEISERMANt, V.JIPSONt, ANDC. F. QUATEtt
*DepartmentofBiologicalSciences, andtEdwardL.GinztonLaboratory,StanfordUniversity,Stanford,California94305
Contributed byC. F. Quate,April 24,1979
ABSTRACT Recentadvances now permit the use of scan-ning acousticmicroscopy fortheanalysisofsubcellular com-ponents. Bysequentialviewingofidentifiedfixed cellswith acoustic,light,andelectronmicroscopy,wehaveestablished thattheacoustic microscope canreadilydetect suchfeatures asnuclei andnucleoli,mitochondria,and actincables.Under optimal conditions,images can evenbe obtained offilopodia, slenderprojectionsof the cell surface thatareapproximately 0.1-0.2Jimindiameter.Smallobjects separated byaslittle as 0.5-0.7jumcansuccessfully beresolved.Threeaspectsofthe acousticmicrographs preparedinthispreliminarysurveyseem
especiallyprominent.Theseare,first, the extraordinarylevel of acoustic contrast that can differentiate the various cyto-plasmic organelles, even in regions of very thin cytoplasm; second,thereversalsinacousticcontrastthatoccurwhen al-teringtheplane offocus; and third, the sensitivity of the acoustic response tooverall cytoplasmicthickness. The acoustic micro-scope uses anovelsourceofcontrastthat isbasedonlocal me-chanicalproperties.Inaddition,it canprovideadegreeof res-olution thatiscomparabletothat of thelightmicroscope.
Much ofour currentunderstandingofcellular structure and function hasbeengainedthrough the applicationof a variety of microscopictechniques. Withlight microscopy, advances inthemethods of fixation and staining [for example, the recent development of immunofluorescence microscopy (see ref. 1)] and inopticalsystems[for example,phase contrast (2), Nom-arski (3), Hoffman modulation (4), and polarized light mi-croscopy (5)] have permitted major increases in knowledge about bothlivingand fixedbiologicalmaterial. The electron microscope, inboth the transmission and scanning modes, has of course greatly extended our understanding of the fine structureofnonlivingpreparations.
Wenow reporttheapplicationof anovel type of microscopy, acousticmicroscopy, to the analysis of subcellular components. Wecompare imagesobtainedinthe acoustic microscope with imagesof the same cellsobtained by light and electron mi-croscopy. This report is anupdateof anearlier paper (6), in which the visualization of single cells with the scanning acoustic microscope wasfirstdescribed. Sincethen,advances in acoustic technologyhave permitted major increases in resolution to a level nowcomparable to that of lightmicroscopy (7). The im-petus towarddevelopmentoftheacoustic microscope rests on the unique method ofanalysis, the use of high-frequency sound waves. Theproperties detected by acoustic radiation are dif-ferent fromthose detectedbyeitherlight or electron radiation, and present exciting possibilities for the examination, in a fundamentallynewway, ofbiological material.
THE ACOUSTIC MICROSCOPE
The scanning acoustic microscope used in thisstudy was in-troduced in 1974 by Lemons and Quate (8). The basic func-tioningof thedevice as used in the reflection mode can be un-derstood with the aid of Fig. 1. An acoustic transducer mounted onthe back of a sapphire rod is excited byapplying an electric pulseatradiofrequencies.This generatesacollimated acoustic beam whichpropagates down thesapphire rod. At the front faceof the rod a spherical depression in contact with acoupling fluid-in this case, water-forms an acoustic lens, and the acousticbeam is focused in the wateraccordingtoSnell's law. Infact, due to the large difference in thevelocityof sound be-tweensapphire and water (a factor of 7.4), the focused beam suffersnegligible spherical aberration and converges to a dif-fraction-limited spot (9). The object to be examined is placed at or nearthe focus. It ismechanicallyscanned linebyline in araster pattern. Acoustic power reflectedby the object is col-lected andrecollimated by the lens and detected (in a phase-sensitiveway)by the transducer. The mechanical motion of the object is synchronized with a cathode ray display monitor and the variations in reflected acoustic power are used to modulate the intensity of the display. The image thus formed on the monitorscreencanthen be recorded photographically.
Resolution isdetermined by the diameter of the focal spot, which is, inturn,determinedbythewavelengthof the acoustic radiationinthe water. Increasing the operating frequency of the instrumentimproves resolutionbydecreasingthe acoustic wavelength. The maximumoperating frequency islimited, however,because attenuation of the acoustic beam by the water increases as the square of the frequency. Using water at a temperatureof 40-500Cand a lens focallengthof 40
Am,
the acoustic microscope is presently limited to operating frequenciesof 2.6 GHzand hence to a wavelength in water of 0.6gim.Greaterresolutioncanbe obtainedby heatingthe water to ahigher temperature(becausethe acoustic attenuation in waterdecreases with increasing temperature), by using a lens of smallerfocallength,orbyusing aliquidoflower acoustic attenuation than water (D. Rugar, J. Heiserman, and C. F. Quate,unpublished data).The variationsinintensity of the reflected sound that lead tocontrastinthe acousticimagecanariseinanumber ofways. Whenthe object isirregular on a scale that is eitherconsiderably greater than orcomparable to the acoustic wavelength in water, thenspecularordiffusescattering of sound occurs,respectively. When theobject to be studied has acoustic properties similar towater(asisusuallythecasewithbiologicalmaterials),then soundenterstheobjectand will bepartiallyabsorbed andphase shifted because of theviscosityorstiffness of theobject.Forsolid objects (suchastheglassslidesonwhichbiologicalsamplesare
tTowhomrequestsforreprintsshould beaddressed. 3325
Thepublicationcostsofthis article weredefrayedinpartby page chargepayment.This article must therefore be hereby marked "ad-vertisement"inaccordance with 18 U. S. C. §1734 solely to indicate this fact.
Proc.Nati.Acad.Sci. USA 76 (1979) \ 'I R EEFLECTING OBJECT 'I ANDDISPLAYI' j~~ scope.tj 2
11H20
OUTPUT iii TO AMPLIFIERI i AND DISPLAY x-y SCANNINGFIG. 1. Schematicillustration ofthescanningacoustic micro-scope.Seetextfordetails ofoperation.
frequently mounted for observation), most of the sound is re-flectedbut, dependingontheposition offocus, phase shiftsmay be introduced in theprocess of reflection. These events can all
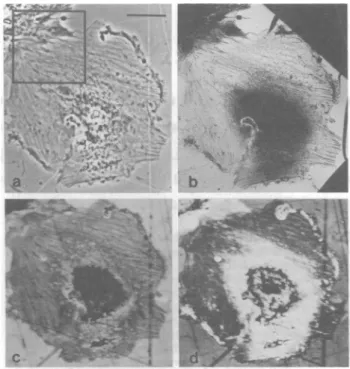
FIG. 2. Abinucleate fibroblastic cell. This fixed, unstained cell
wasphotographedwithphase-contrast light microscopy before (b)
andafter(c)useof the acousticmicroscope;grossdamagetothe cell
doesnotoccur as aresultofacousticmicroscopy. Inthe acoustic image
(a), the nuclei and nucleoli exhibitgreat contrastwithrespect tothe surrounding cytoplasm. Alsonotethe ruffles of the cellperiphery, the apparentgranularityofthe cellcytoplasm, and the alternating
con-centricbandsofacousticdensity. Bar indicates10,m.
b
FIG. 3. Comparison of light, electron, and acoustic micrographs. This cluster of cells was photographed with phase-contrast(a) and transmissionelectron(b)microscopyafter preparation of theacoustic micrographs (c and d). (These cells were also photographed by Nomarski andpolarized light microscopybut,forthe sake ofbrevity, these images are notincluded.) The two acoustic imageswere pre-paredatslightlydifferent planes of focus. The large darkareasofb representbars of the copper grid. The regionoutlined in a is shown
athighermagnification inFig.4.Bar indicates30,m.
lead to variationsincontrastofimagesofbiological samples (10).
MATERIALS AND METHODS
CellCulture. Ciliary gangliaofembryonic chickens(8-9 daysofincubation)weredissociatedintosuspensionsofsingle cells with 0.1%trypsin.(Microbiological Associates, Bethesda, MD) (11).These cellswerethen incubatedinahumidified5% CO2atmosphereat370C,in medium F-12(GIBCO) supple-mented with 10% fetal bovine serum(Microbiological Asso-ciates),for 2-5days.Thecellsweregrownat adensityof2-5 X10³ cells per cm2 either on collagen-coated glass discs (18 mm diameter)or ondiscs first covered withafilmof Formvar(12), thencoated withcollagen. Thereusable glassdiscs were de-signed both to fit the specimen holder of theacoustic micro-scopeand to permit observation of identified cellsinthelight microscopeand(whenusedwithFormvar)inthetransmission electronmicroscope.
Preparation for Microscopy.Inall cases,sampleswerefixed with 2.5%glutaraldehydeinSorenson's buffer(0.97% salts/0.12
Msucrose,370C,20min), then rinsedthoroughlywith buffer. Whensampleswerecompared byonlyacousticandlight mi-croscopy,cells ofinterest werefirst identifiedbythelight mi-croscope
[Zeiss
Photomicroscope;40X(numericalaperture of 0.75) and lOOX (oil-immersion,numerical aperture of 1.30) objectives].Theywerethen examinedacousticallyindistilled water,and laterreexaminedwith thelightmicroscope, with photographspreparedateach stage.Sampleswereexaminedindistilledwater toavoidthecrystallizationof salts thatwould otherwise occur because of evaporation from the open-air specimen mount.(Newermicroscopicdesignswillsoonpermit the examination of cellsinmedia withsalts.) Samplesviewed -3"'226
Biophysics:
Johnston
etal.Proc.Natl.Acad. Sci. USA 76(1979) 3327
ret~~~~d
p
a.
~.v<-**
4,~~~~~~~~~~~~~~~~~~k~ I_ _ sf . ssi4'& r ig-mu F. , A - A .s, F i 2'.'>'~~~~~~~~i
E tBit 44rOMQW-M_;Sv
2!
~~U
As A natd *AFI.4. Reio of celua ineacin Thi reio is shw at a loe magnfictio in.Fi.3iTeaostcmcorp])rpeeth
a ,.
_
ok
~~~~~~~~~~~~~~~~~~~~~~~~~~~~~-
.sI1,-.e_
,A
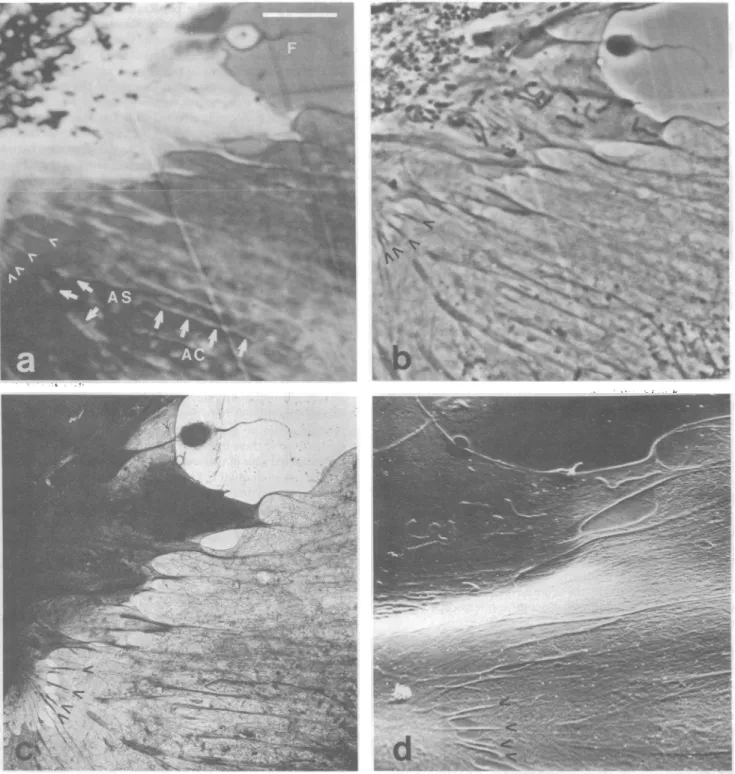
asMFIG. 4. Regionofcellular interaction. ThisregionisshownatalowermagnificationinFig.3a.The acousticmicrograph(a) representsthe greatestpractical magnificationnowavailable with the acousticmicroscope.Theellopodium(F) andthesitesofcell-cellattachment(arrowheads)
areapproximately0.2,m indiametgr;theattachmentsitesareseparated byaslittleas0.5Am.Actincables(AC)andtheovalexpansionsof theirtipsthatmayrepresentsites ofcell-substratum attachment(AS)areclearlyvisible in theacousticmicrograph.Thesestructurescanalso be seenin thephase-contrast(b)and the transmission electron(c)micrograph.Someof(thesestructuresarealsovisible in thescanningelectron micrograph(d)asvariations in surface contour;thebroad undulationsofthecells in d are causedbyfoldingoftheForevar.Barindicates10
withacoustic,
light,
and electronmicroscopywerefixed withdrying,
carewastakentokeep
thesamples continually
wet.glutaraldehyde,
asbefore,
thenrinsed,
post-fixed
with0.2%Nevertheless,
because theacoustic'specimen
holderwasopenOS04
(20°C,
10min),
ninsedagain,lightly
stained withuranyl
totheatmosphere,,
it ispossible
thatsomepreparationsdriedacetateandleadcitrate
(13),
and storedinbuffer untiluse.Aftertransiently
inair. After thecellswerephotographed
with the examinationofselected cells withlight
andacousticmicroscopy, transmissionelectronmicroscope
(Hitachi
HU-11E-1,operated
small
fragments
oftheFormvarplastic
(with
theadherentcells)
at75kVaccelerating voltage), they
weresputter-coated
with werepeeledoff theglass disc,attachedtocoppergrids (12),and gold(DentonVacuumDV-502)and examinedinthe scanning driedatthe critical point ofCO2.
Uptothetimeof critical point electron microscope(CoatesandWelter,
model50).
Proc.Natl.Acad.Sci. USA 76(1979)
FIG. 5. Transmission electron(a)and acoustic(b)micrographs
ofacluster oflargemitochondria (arrow)aligned paralleltoactin
cables.Barindicates10Am.
RESULTS
Even inearlyexperimentsof thisseries,wewereabletoobtain dramaticacousticimagesoffixed,unstainedfibroblastic cells
(Fig.2a). Severalprominentcharacteristics ofacousticimages distinguishthem fromphase-contrastlight micrographsofthe
samecells(Fig. 2 b andc). Thesecharacteristics include the
roughlyconcentricdarkandlightbands thatalternate inward fromtheedgeof the cell.Superimposeduponthesebandsare
thelocal dramaticvariations in acoustic responsethat indicate
thevariouscytoplasmic organelles.Initially,wewereconcerned
that cellularstructuremightbedamagedinsomewaybythe
high frequency sound waves used in acoustic microscopy
(perhapsbecauseoflocalheating bytheacousticbeam)orby
warming of thefluidinwhichthe cellswerebathed.
Never-theless,
light micrographspreparedofcellsbefore(Fig.2b)andafter (Fig. 2c acoustic microscopyreveal
that,
at this level,cellulardamagecausedbytheacousticmicroscopeisnotgreat,
consistent withthefinding that acoustic microscopyis
com-patiblewithlivingcells(6).
Inordertoidentifyunambiguouslythecytoplasmic organ-ellesvisible withacousticmicroscopyandtoevaluatepossible
mechanismsofformationoftheconcentricacousticrings,we
undertookaseriesofexperimentsdesignedtopermit
exami-nation ofidentified cellsby electron, light, andacoustic
mi-croscopy. Althoughitwastechnicallydifficulttoidentifyand viewsinglecellsbythese differentapproaches, wewere
nev-erthelessable, ina fewcases, toexamine cells with allthese
a 3t 4 PAE -: wt .:A zzvAL >
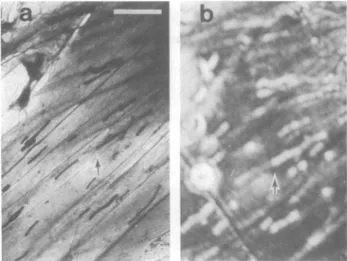
FIG. 6. Thin cellular lamellipodium.This locomotoryorganelle
wasapparently fixedduring its extension.Thinfilopodia (0.1-0.15
pmindiameter)protrudefrom thelamellipodium,andsomeofthese
(arrows)arefaintlyvisibleinthe acousticmicrograph(a).Alsonote
theirregular cytoplasmic lattice ina thatisvisiblein theelectron
micrograph(b)aslocalized aggregationsofmicrofilaments.Bar
in-dicates10gm.
methods. Tofacilitate the penetration of electronsthrough whole-mounted cellsinthetransmissionelectron microscope, weselectedfor viewing those cells that appeared thin inthe lightmicroscope.Anexampleofsuchacell is illustrated in Fig. 3. The marked changes in patterns of acousticcontrast that result from aslight shift inpositioning of the cell alongthe acousticaxisof the lensaredemonstratedin Fig. 3 c andd. Although theconcentric natureof the bands is essentially re-tained, their radialposition,andthe acoustic signal fromthe surrounding substratum, bothvarywiththeseparationbetween sample and lens and, thus, with the phaseangleof thereflected
acoustic
signal.
At this low magnification, relatively littlecytoplasmic
detail is revealed in the acoustic micrographs. Althoughmoredetailisvisibleinthe light micrograph, contrast isreducedrelativetotheacoustic image. The corresponding electron micrograph shows great contrast and resolution, especiallyatthe cellperiphery, butpenetrationoftheelectron beamthrough the thickercentral cytoplasm is too poor to reveal cellular detail.InFig. 4,theareaoutlined in Fig. Sa is shown at thehighest magnification now practical with the acoustic microscope. Here, the detail revealed in the acoustic imageclosely ap-proaches that obtained withalightmicroscopefitted with a 10OXoil-immersionobjective. Usingthetransmissionelectron micrographasareference,we areable to identify many of the acousticallyvisible structures,includinganelongatefilopodium,
sites ofattachment between adjacent cells, actin cables, and probable sites of cell-substratum attachment. Independent calibrationsof these light and electronmicrographsreveal that the indicated sites of cell-cell attachment, and thefilopodium,
are 0.2pimindiameter.The scanning electronmicrographof the same regiondemonstrates that at least some ofthesefeatures arevisible as variations in surface contour,especiallyinregions where the cytoplasm is particularly thin. This variation in surface contour wasunexpected, andmaybeartifactual.Note also that the cell thickness increasescentrally.
Fig. 5illustrates aportion of a cell that hadanunusually prominentaccumulationof mitochondria aligned parallelto a seriesof actin cables. Themitochondria present an acoustic imagethat contrastsdramaticallywith that of thesurrounding cytoplasm. Whereas large mitochondria appeardistinct,smaller mitochondrianearby are onlypoorly resolvedacoustically,and theirimages arereduced in contrast.
The smallest biological objects we have yet been able to identify in theacoustic microscope are showninFig. 6. Here, anexceedingly thin portion of cellcytoplasmwasapparently fixedduringits extension as arufflingmembrane.Several fil-opodia, 0. 1-0. 15 ptm inwidth, project from this membrane(Fig. 6b), and someofthese arefaintly visibleintheacousticimage (Fig. 6a). Also visible acoustically is a diffuse and irregular cytoplasmiclattice, which correspondsinthe electron micro-graph to local aggregations ofmicrofilaments.
DISCUSSION
This studyrepresents a successfulattempttospecificallyobserve intracellularstructure with the acoustic microscope. For this work, weselected fibroblastic cells of theperipheralnervous system, both because these cells werereadily accessible tous and because their structure haspreviously been well charac-terized (14). Bymaking comparisons amongsequentialacoustic, electron, andlightmicrographs ofsinglecells, wehave been able toidentify acoustically prominentorganelles that corre-spond to nuclei and nucleoli, mitochondria, actincables and presumptive cell attachment sites,andfilopodia, ruffles, and othercell surface projections.
The smallestbiological objects that wearepresentlyableto %0-"'O2
8Biophysics: Johnston
etal.Proc.Nati. Acad.Sci. USA 76(1979) 3829 detect acoustically, suchasfilopodia and otherthinorganelles,
have diameters of 0.1-0.2 ,um,though these areidentifiable only when other organellesare notnearby. The ability of the acousticmicroscope toresolveadjacent small objectsis some-what less. We estimate that the minimal separation of biological objectsthat can beacousticallyresolved is about 0.5-0.7
Am,
orapproximatelyonewavelength. Although a light microscope equipped withanoil-immersion lenscansurpassthis perfor-mance, the difference is not great. We anticipate that im-provements in acoustic microscopy overthe next few years will narrowthis gap further, and the acoustic instrument may in time evenexceedtheresolvingpowerof thelightmicroscope. Electronmicroscopists,ofcourse,neednotfearcompetition on this front.
Nevertheless, theacoustic microscopealready offers poten-tially useful featuresthat are characteristic of neitherlightnor electronmicroscopy. First,the degreeof acoustic contrastthat differentiates cytoplasmic organellescanbe impressive, even when theseorganellesareunstained.Second,the acoustic mi-croscope is apparently sensitive to slight variations in cyto-plasmic thicknessand provides a degree of information that is otherwisereadily obtainable onlyintheinterference micro-scope or in the scanning electron
microseope.
Finally, the acousticmicroscope, unlike the electronmicroscope, is com-patible with living cells(6).Theprecisemechanisms by whichbiological objectsgenerate acoustic contrast are notyetwellunderstood. Localizedchanges in cytoplasmic mechanicalproperties, which could resultin variationsbothinacousticabsorbanceand in phaseangleof the reflected signal, shouldcontribute to acoustic contrast (15, 16). Thephase angleof the acoustic response can vary as a function of at least two cytoplasmic parameters. An acoustic pulse propagatingthrougha regionof reduced density or increased mechanicalstiffness wouldincrease invelocityof propagation andthereby undergoaphaseadvance with respect toadjacent signals. Dependingontheplaneof acousticfocus,this would beinterpreted bythe microscope as either a relative lightening or arelativedarkeningofthe visualimage. Ontheotherhand, anr acousticpulsepropagatingthroughahomogeneous object that is of variable thickness wouldundergoa greater phase advance, perhaps throughmultiples of x, in the thicker regions.
We suspectthat the latter mechanism may account, in large part, for the existence of the acoustic rings that appear tofollow the contours of cells as they thicken toward their centers. We donot yetknow,however,towhat extent the local variations in acoustic contrast that areassociated with cytoplasmic or-ganelles correlatewith mechanical or viscoelasticproperties that might result in acoustic absorbance or phase shift. To an-swer these and other questions, further comparisons among acoustic and electron microscopic images of cells must be made.
WethankKateBarald, PaulGreen,andNormanWessells for crit-icismsof this manuscript. Wealso thank Belen Palmer and Fran Thomas for technicalassistance.The culturing of cells and lightand electronmicroscopy wereperformedinWessells'laboratory. This work was supported by Research Grants 1 R01 GM-25826-01 and RG HD-04708fromthe NationalInstitutesof Health.R.N.J. waspartially supported byaNaturalSciencesandEngineeringResearch Council of Canadascholarship.
1. Osborn, M. & Weber, K. (1977) Cell 12,561-571. 2. Zernike,F.(1942)Physica9,686-974.
3. Allen,R.D.,David,G. B. &Nomarski,G.(1969)Z.Wissenschaft. Mikrosk. und Mikrosk. Tech.69, 193-221.
4. Hoffman,R.(1977)J. Microsc. 110, 205-222. 5. Inoue, S.(1952)Exp.CellRes.Suppl.2,305-318.
6. Lemons, R.A. &Quate,C. F.(1975)Science 188, 905-911. 7. Jipson, V. & Quate, C. F. (1978) Appl. Phys. Lett. 32,
789-791.
8. Lemons, R. A. & Quate, C. F. (1974) Appl. Phys. Lett. 24, 163-165.
9. Lemons, R. A. & Quate, C. F.(1973)inProceedings of the Ul-trasonicsSymposium, ed.deKlerk,J. (IEEE,NewYork),pp. 18-20.
10. Atalar,A.(1978)J.Appl.Phys.49,5130-5139.
11. Helfand,S. L.,Smith,G. A. &Wessells,N. K.(1976)Dev.Biol. 50,541-547.
12. Buckley,I. K. &Porter, K. R.(1975)J. Microsc. 104,107-120. 13. Luduefia,M. A. & Wessells,N. K.(1973) Dev.Biol. 30,
427-440.
14. Wessells,N.K.,Luduefia,M.A.,Letourneau, P.C., Wrenn, J. T.&Spooner, B. S.(1974)TissueCell4,757-776.
15. Atalar,A.,Jipson,V.,Koch,R. & Quate, C. F.(1979)Annu. Rev. Mater.Sci. 9, 255-281.
16. Marmor,M.F.,Wickramasinghe,H. K. & Lemons, R. A.(1977) Invest.Ophthalmol.Vis. Sci. 16,660-666.