EFFECTS OF CHOLINERGIC RECEPTOR NICOTINIC ALPHA
5 (CHRNA5) RNAi ON
APOPTOSIS, DNA DAMAGE RESPONSE, DRUG
SENSITIVITY, AND HSA-MIR-495-3P
OVEREXPRESSION IN BREAST CANCER
A DISSERTATION SUBMITTED TO
THE GRADUATE SCHOOL OF ENGINEERING AND SCIENCE
OF BILKENT UNIVERSITY
IN PARTIAL FULFILLMENT OF THE REQUIREMENTS
FOR THE DEGREE OF
DOCTOR OF PHILOSOPHY
IN MOLECULAR BIOLOGY AND GENETICS
By
ŞAHİKA CINGIR KÖKER
December, 2018
ii
EFFECTS OF CHOLINERGIC RECEPTOR NICOTINIC ALPHA 5 (CHRNA5) RNAi ON APOPTOSIS, DNA DAMAGE RESPONSE, DRUG SENSITIVITY, AND HSA-MIR-495-3P OVEREXPRESSION IN BREAST CANCER
By Şahika Cıngır Köker December, 2018
We certify that we have read this dissertation and that in our opinion it is fully adequate, in scope and in quality, as a thesis for the degree of Doctor of Philosophy.
_____________________ Özlen Konu Karakayalı (Advisor)
_____________________
Ayşe Elif Erson Bensan
______________________ Özgür Şahin ___________________ Işık Yuluğ ____________________ Sreeparna Banerjee
Approved for the Graduate School of Engineering and Science:
__________________ Ezhan Karaşan
iv
ABSTRACT
EFFECTS OF CHOLINERGIC RECEPTOR NICOTINIC ALPHA 5
(CHRNA5) RNAi ON APOPTOSIS, DNA DAMAGE RESPONSE, DRUG
SENSITIVITY, AND HSA-MIR-495-3P OVEREXPRESSION IN BREAST
CANCER
TRACT
Şahika Cıngır Köker
Ph.D. in Molecular Biology and Genetics Supervisor: Özlen Konu Karakayalı
December 2018
Cholinergic Receptor Nicotinic Alpha 5 (CHRNA5) is associated with nicotine addiction and it has an important role in the prognosis of lung cancer. Despite its important cellular functions, its role in breast cancer remains to be elucidated. In this thesis, I aimed to identify the alterations in the important cancer signaling pathways occurring upon CHRNA5 depletion.
Drug resistance is one of the major obstacles in breast cancer therapy. Heterogeneous nature of breast cancer necessitates identification of more biomarkers which aid in precise diagnosis and hence development of proper treatment options. In this study, by using more than one cell line which is representative of different subtypes of breast cancer, I showed the alterations occurred in cancer signaling pathways such as cell cycle and apoptosis upon CHRNA5 depletion, which could serve as a novel biomarker in breast cancer subtyping. Depending on mutation status of TP53, which is the gatekeeper protein during G1/S checkpoint, CHRNA5 depletion mostly exerted its effects over decreasing the levels of total CHEK1 and pCHEK1 (S345) which significantly altered the response of MCF7 cells to topoisomerase inhibitors in terms of enhanced drug sensitivity. Increases in apoptotic markers, such as BAX/BCL2 ratio along with increased FAS levels, further confirmed that this sensitization of MCF7 cells upon CHRNA5 depletion might have ended with apoptosis.
v So far in the literature, there is no study examining the regulation of CHRNA5 by small endogenous molecules such as miRNAs. Due to the predictive binding sites in 3’UTR of CHRNA5 and the importance of participating in tamoxifen resistance in breast cancer; I also examined the interplay between miR-15a family and CHRNA5 in MCF7 cells. I showed significant decrease in CHRNA5 levels upon using miR-15a mimic while demonstrating similar activity of miR-15a family mimics with CHRNA5 depletion using RT-qPCR.
Another important implication of CHRNA5 depletion in MCF7 cells was the global change in miRNA expression prolife which was verified with independent microRNA arrays. Based on these in silico results, hsa-miR-495-3p appeared as the most downregulated miRNA which is known as a tumor suppressor miRNA. As stated in the literature, the role of miR-495 differs depending on the tumor type. Therefore, I tried to restore its expression by mimicking along with CHRNA5 depletion. The transcriptomic changes observed with CHRNA5 depletion was boosted with the restoration of miR-495 levels.
Keywords: Breast cancer, cholinergic signaling, CHRNA5, RNAi, DNA damage, drug
vi
ÖZET
KOLİNERJİK RESEPTÖR NİKOTİNİK ALFA 5 (CHRNA5) RNAi
UYGULAMASININ, MEME KANSERİNDE APOPTOZ, DNA HASARI
YANITI, İLAÇ DUYARLILIĞI VE HSA-MIR-495-3P’NİN YÜKSEK
İFADESİNE ETKİSİ
TRACT
Şahika Cıngır Köker
Moleküler Biyoloji ve Genetik Doktora Programı Tez Danışmanı: Özlen Konu Karakayalı
Aralık 2018
Kolinerjik Reseptör Nikotinik Alfa 5 (CHRNA5), nikotin bağımlılığıyla ilişkilidir ve akciğer kanseri prognozunda önemli bir role sahiptir. Önemli hücresel işlevlerine rağmen, bu molekülün meme kanserindeki rolü henüz bilinmemektedir. Bu tezde, CHRNA5 deplesyonu yapıldığında önemli kanser sinyal yolaklarında meydana gelen değişikliklerin belirlenmesini amaçladım.
İlaca karşı direnç, meme kanseri tedavisi önündeki en büyük engellerden biridir. Meme kanserinin heterojen doğası, kesin tanı konulmasına ve dolayısıyla doğru tedavi seçeneklerinin belirlenmesine yardımcı olabilecek daha çok biyobelirtecin bulunmasını gerektirmektedir. Bu çalışmada, meme kanserinin farklı alt tiplerini temsilen birden fazla hücre hattı kullanarak, meme kanseri alt tiplerinin ortaya çıkarılmasında yeni bir biyobelirteç görevi görebilecek olan CHRNA5’in deplesyonu yapıldığında hücre döngüsü ve apoptoz gibi yaygın sinyal yolaklarında meydana gelen değişiklikleri gösterdim. Hücre döngüsünde G1/S noktasında denetleyici görevi gören TP53 proteinin mutasyon durumuna bağlı olarak, CHRNA5 deplesyonu, etkilerini ağırlıklı olarak hem total CHEK1 hem de pCHEK1 (S345) seviyelerinde azalmaya neden olarak göstermiş ve bu da, MCF7 hücrelerinin Topoizomeraz inhibitörlerine yanıtlarını önemli ölçüde değiştirerek ilaca duyarlılıkta artışa neden olmuştur. Artan FAS seviyelerinin yanında, BAX/BCL2 oranı gibi
vii apoptoz belirteçlerde de artış görülmesi, CHRNA5 deplesyonunu takiben MCF7 hücrelerinde gelişen duyarlılığın apoptozla sonuçlanabileceğini göstermiştir.
Literatürde şimdiye kadar miRNA’lar gibi küçük endojen moleküllerle CHRNA5 regülasyonunu inceleyen bir çalışma yapılmamıştır. CHRNA5’in 3’UTR’sindeki potansiyel miR-15a bağlanma bölgeleri ve miR-15a’nın meme kanserinde tamoksifen direncinde yer alması nedeniyle; bu çalışmada miR-15a ailesi ve CHRNA5 arasındaki etkileşimi MCF7 hücrelerinde araştırdım. RT-qPCR metodu ile, miR-15a mimikleri kullanarak CHRNA5 seviyesinde ciddi bir azalma gözlemledim, aynı şekilde bu aileye ait miRNA mimikleri ile de CHRNA5 RNAi’nin etkilerine de benzerlikler gözlemledim.
MCF7 hücrelerinde CHRNA5 deplesyonunun bir diğer önemli sonucu ise, bağımsız microRNA dizilimleriyle de doğrulanan, miRNA ifade profilindeki global değişikliklerdir. Bu in silico sonuçlara dayanarak, tümör baskılayıcı miRNA olarak bilinen hsa-miR-495-3p, ifadesi en çok azalan miRNA olarak belirlenmiştir. Literatürde de belirtildiği gibi, miR-495’in rolü tümörün türüne göre değişmektedir. Bu nedenle, CHRNA5 deplesyonunun yanında, miR-495’in ifadesini de mimik uygulaması ile eski seviyesine çıkarılmaya çalışılmıştır. CHRNA5 deplesyonu ile gözlemlenen transkriptomik değişiklikler, miR-495’in yüksek ifade edilmesiyle daha da arttırılmıştır.
Anahtar Sözcükler: Meme kanseri, kolinerjik sinyal yolağı, CHRNA5, RNAi, DNA
viii
To my precious family….
ix
ACKNOWLEDGEMENTS
First and foremost, I would like to express my gratitude to my supervisor Assoc. Prof. Özlen Konu, not only for her guidance and scientific contributions throughout my PhD study but also for her patience and sincerity. Thanks to her tolerance, I succeeded to become a scientist and a mom at the same time. She always kept believing in me and never let me give up in any situation.
I would also like to express my deepest thanks to my committee members; Prof. Dr. Ayşe Elif Erson and Assist. Prof. Özgür Şahin for their fruitful discussions and for sharing their academic knowledge with me during my committee meetings. Moreover, I am very thankful to Assoc. Prof. Işık Yuluğ both for accepting to become my jury member and for providing me with her groups’ bench and letting me use reagents/equipment and culture hood. I would like to also express my thanks to Prof. Dr. Sreerparna Baneerje for accepting to become my jury member and sharing the antibodies with us.
I would like to thank Prof. Dr. İhsan Gürsel and his group for helping me with PI staining and letting me use the tools in their lab whenever I needed. I also would like to thank Şahin group for sharing their knowledge and experiences.
Konu lab members have always been supportive especially during tough times. I would like to especially thank Ayşe Gökçe Keşküş, not only for her friendship, but also for her contributions to the manuscript. I am also thankful to her for her contributions to statistics study as well. Without her hard work, this task might last longer. I am also thankful to Ermira Jahja and Huma Shehwana for their great contributions to the manuscript. I also would like to thank Said Tiryaki for his nice friendship and his contributions to miRNA studies. Başak Özgürsoy and Mehtap Yılmaz Tezcan also contributed a lot to miRNA studies so I am also thankful to them. I am also thankful to the present members of Konu lab especially to Seniye and Damla for their support, help and friendships.
My sincere thanks go to past and present members of MBG family. Özge Saatçi has been a great friend and a collaborator; moreover, whenever I needed, she always helped me.
x I was very lucky to have my dear friends Ece Akhan Güzelcan, Damla Gözen, Deniz Cansen Kahraman, Seçil Demirkol Canlı and Derya Cavga. They never stopped supporting me even there existed distances between us. I would like to also thank Eda Süer both for her scientific advices and for being such a cool friend.
I would also like to extend my appreciation to Pelin Makas and Seda Birkan. They made the lab environment as convenient as possible to support our work. They were also among the great friends that I have had in MBG. I would like to also thank Ümmühan Çolak and Abdullah Ünnü for their efforts to make our lives easier in the lab and also for their warm greeting every in the morning. I want to also thank Füsun Elvan and Yıldız Kahyaoğlu for their help whenever I asked them.
My greatest gratitude goes to Hande Mertoğlu. She was always more than a friend to me since METU years. She was always with me during my hard times and joyful moments. I would like extend my special thanks to one of my oldest friends, Esra Çopuroğlu. She was present in my life since my high school years, and she never stopped helping me in every condition.
Last but not the least; I would like to express my special thanks to my precious family. My mother, Ayşe Cıngır and my father Ramazan Cıngır, had never ever stop believing me and supporting me. It is their belief which made me determined to finish this study. I am very grateful and lucky for sharing my life with Yasin Köker. Not only during my PhD study, starting from my master’s study, he kept supporting me and never let me down. I am very thankful for his unconditional love and support. My precious daughter Ayşe İdil Köker also deserved the greatest thanks due to her patience during my PhD study despite her age. Her presence made me stronger and forced me to accomplish my PhD study. My mother in love, Songül Köker and my father in love, Mürsel Köker greatly sacrificed their lives whenever I needed their help. I am also thankful to them. My sisters, Duygu Balkan and Selva Kaya have never stop believing and supporting me. They are always co-mother to me all the time. I owe many things to their presence.
xi I am also thankful to Bilkent University Department of Molecular Biology and Genetics for giving me support for obtaining a PhD degree. This work was supported by TÜBİTAK (The Scientific and Technological Research Council of Turkey) with the research grants (to OK) 111T316 (Results 3.1-3.8) and COST BM1406-114S367 (Results 3.9-3.15 and and Appendix A) from which I received PhD scholarships.
xii
CONTENTS
CHAPTER 1: INTRODUCTION ... 1
1.1 Breast cancer ... 1
1.1.1 General background of the disease and the breast tissue ... 1
1.1.2 Subtypes of breast cancer and current treatment strategies ... 3
1.2 Chemotherapy and drug resistance mechanisms in cancer ... 6
1.2.1 Topoisomerase inhibitors ... 7
1.2.2 Cytotoxic effects of topoisomerase I inhibitors ... 8
1.2.3 Cytotoxic effects of topoisomerase II inhibitors ... 8
1.3 Role of nicotinic cholinergic receptors in cancer ... 9
1.3.1 Nicotine and its connection with cancer ... 9
1.3.2 Nicotinic acetylcholine receptors (nAChRs) ... 10
1.3.3 Role of nicotinic acetylcholine receptors (nAChR) in cancer signaling pathways ... 12
1.3.4 Implication of CHRNA5 in cancer ... 15
1.4 Cell cycle and DNA damage response ... 16
1.4.1 Cell cycle regulation in cancer cells ... 16
1.4.2 DNA damage response in cancer cells ... 19
1.4.3 Role of CHEK1 and CHEK1 inhibitors in cancer cells ... 21
1.5 Apoptosis in cancer cells ... 22
1.5.1 Regulation of apoptosis ... 22
1.5.2 Implication of BAX/BCL-2 ratio ... 24
1.5.3 Importance of cleaved caspase-7 as an apoptotic marker ... 25
1.5.4 Association between nAChRs and apoptosis ... 26
1.6 microRNAs ... 27
xiii 1.6.2 microRNAs that are targeting CHRNA5 through prediction and validation 28
1.6.4. miR15/16 family in cancer and cancer related signaling pathways ... 28
1.7 Hsa-miR-495-3p ... 32
1.7.1 In cancer ... 32
1.7.2 Review of mir-495 mimic or inhibitor studies in cancer or other contexts .. 33
1.8 siRNA and siRNA + miRNA as a treatment modality ... 36
1.9. Aims and rationale ... 37
CHAPTER 2: MATERIALS AND METHODS ... 40
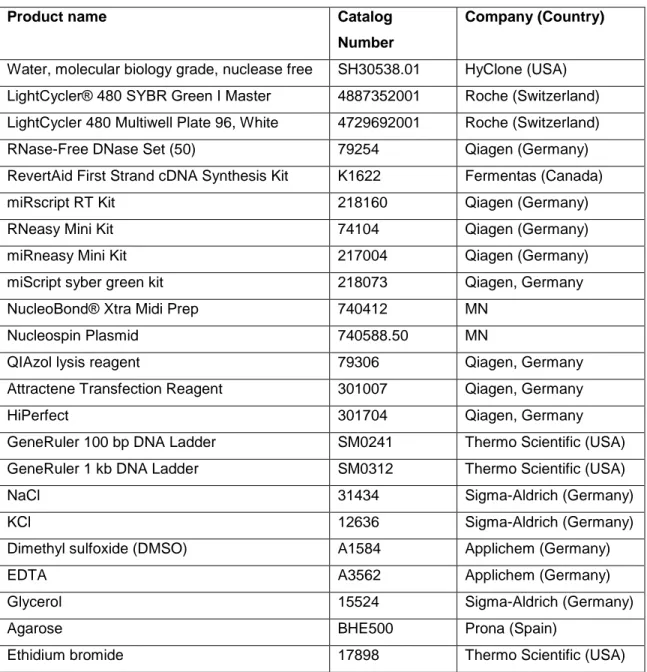
2.1 Materials ... 40
2.1.1 General laboratory chemicals, reagents and kits ... 40
2.1.2 Nucleic Acids used in the Experiments ... 42
2.1.3 PCR primers ... 43
2.1.4 Antibodies used in western blot ... 44
2.1.5 Equipment used in the study ... 45
2.2 Solutions and media ... 46
2.2.1 Common solutions ... 46
2.2.3 Cell culture solutions and media preparations... 46
2.2.4 Solutions used in western-blot ... 47
2.3 Methods ... 48
2.3.1 General maintenance and handling of cell lines ... 48
2.3.2 Transfection and co-transfection with siRNA and miRNA mimics ... 49
2.3.4 RNA and miRNA isolations ... 50
2.3.5 cDNA synthesis of mRNAs and miRNAs ... 51
2.3.6 Primer design and primer efficiency ... 51
xiv 2.3.8 Toxicity detection of siRNA and miRNA mimics (alone or in combination) with
MTT Assay ... 53
2.3.9 Drug sensitivity MTT assays in combination with siRNA molecules ... 54
2.3.10 Analysis of DNA replication with PI staining and 7-AAD/Brdu staining ... 55
2.3.11 Total protein extraction ... 57
2.3.12 BCA assay and protein quantification ... 57
2.3.13 SDS-PAGE preparation and western blot ... 58
2.3.14 Mild stripping Protocol ... 58
2.3.15 Microarray studies ... 59
2.3.19 Statistical analysis: ... 64
CHAPTER 3: RESULTS ... 65
3.1 Downregulation of CHRNA5 using siRNA-1, -2, and -3 and validation of microarray results in siRNA-2 and siRNA-3 treated MCF7 cells. ... 65
3.2 Validation of effects of CHRNA5 depletion on cell viability using multiple siRNA molecules ... 69
3.3 Effects of CHRNA5 RNAi on apoptosis and DNA damage in MCF7 cells ... 70
3.4 Effects of CHRNA5 RNAi on apoptosis and DNA damage in BT20 and MDA-MB-231 ... 76
3.5 Effects of CHRNA5 RNAi alone or in combination with doxorubicin (DOXO) or camptothecin (CPT) on cellular viability. ... 77
3.6 Effects of CHRNA5 RNAi treatment with or without CPT and DOXO on apoptotic and DDR proteins in MCF7 cells ... 79
3.7 Effects of CHRNA5 RNAi treatment with or without CPT and DOXO on DDR proteins in BT20 and MDA-MB-231 cells ... 84
3.8 How CHRNA5 variants and the genes affected by CHRNA5 depletion are modulated upon mir-15a, mir-15b, and mir-16 mimic treatment? ... 89
xv 3.10 Does transcriptional profile of CHRNA5 RNAi correlate with that of mimic miR-495 based on comparative transcriptomics plots (log fold change vs. log fold change)? . 96
3.12 Ingenuity Pathway Analysis (IPA) of the additively or inversely affected pathways upon CHRNA5 siRNA-1 along with mimic miR-495 treatments based on microarray
analysis. ... 100
3.13 Does use of CHRNA5 RNAi or mimic mir-495 alone or together with each other affect cell viability and cell cycle distributions? ... 105
3.14 Does use of CHRNA5 RNAi or mimic mir-495 alone or together have effects on DNA damage and apoptosis? ... 109
3.15 What are the genes that siRNA-1 and miR-495 mimic act either additively or inversely based on microarray analysis and can they be validated by qPCR? ... 112
CHAPTER 4: CONCLUSIONS AND DISCUSSION ... 119
4.1 Key Findings of the thesis ... 119
4.2 Effect of CHRNA5 depletion on apoptosis, DNA damage and drug sensitivity in cancer cells ... 120
4.3 Effect of CHRNA5 depletion on miR-15/16 family in MCF7 cells ... 124
4.4 Effect of CHRNA5 depletion on global miRNA changes and restoration of hsa-miR-495-3p levels in MCF7 cells ... 126
4.4 Proposed Mechanism ... 130
4.5 Future Perspectives ... 130
APPENDIX A ... 133
A1: Preliminary studies for co-culturing ... 133
A2: Preliminary Studies for the generation of shCHRNA5 Expressed MCF7 cells .. 136
REFERENCES ... 137
xvi
Figure 1.1: Progression of invasive ductal carcinoma. Progression of breast cancer
tumorigenesis starting from epithelial hyperplasia to invasive ductal carcinoma. Adapted from Myal Y. et al.,2010. Journal of Biomedicine and Biothecnology [13]. ... 3
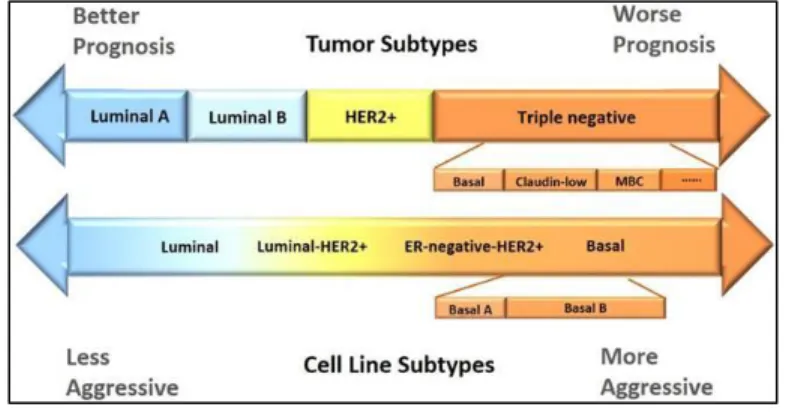
Figure 1.2: Breast cancer subtypes. The classification of breast cancer according to
hormonal receptor status. Breast tumors and cell lines are compatible with each other. Figure adapted from Dai X. et al., 2017. Journal of Cancer [28]. ... 5
Figure 1.3: Effect of nicotine. Nicotine exerts its effect through binding to nAChRs
resulting in transcriptional and post-transcriptional modifications. Adapted from Grando A. S., 2014. Nature Reviews Cancer [51]. (License Number 4487160216099). ... 10
Figure 1.4: Structure of nicotinic acetylcholine receptors family. Homomeric and
heteromeric structure of nAChRs. Adapted from Grando A. S., 2014. Nature Reviews Cancer [51]. (License Number 4487160216099) ... 11
Figure 1.5: Signaling cascade upon nAChRs activation. Binding of nicotine to nAChR
activates common cancer signaling pathways via recruitment of β-arrestin which in turn recurits Src kinase. This leads to activation of PI3K/AKT signalling, Ras/Raf/MAPK signalling pathways. Adapted from Schall C. et al., 2014. Molecular Cancer Research [71]. (License Number 4487160885032). ... 15
Figure 1.6: Cholinergic Receptor Nicotinic Alpha-5. Subunit composition of CHRNA5.
Adapted from Lassi G. et al., 2016. Trends in Neuroscience [98]. ... 16
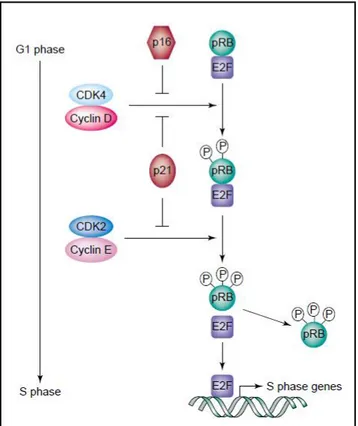
Figure 1.7: G1-S progression. RB is phosphorylated by the activated cyclin-D-CDK4
and cyclin-D-CDK2 complexes, which in turn releases E2F transcription factors. E2F transcribes the genes necessary for S phase transition. Adapted from Stewart A. Z. , et al., 2003. Trends in Pharmacological Sciences [104]. (License Number 4490711193264). ... 17
Figure 1.8: Activated checkpoints upon DNA damage. DNA double strand breaks lead
ATM activation, whereas single strand breaks together with stalled replication forks activate ATR. These in turn activates checkpoint kinases resulting in either cell cycle arrest or apoptosis. Adapted from Qiu Z. et al., 2018. Radiotherapy and Oncology [119]. (License Number 4490720913271). ... 20
Figure 1.9: Biogenesis of microRNAs. Adapted from Winter J. et al., 2009. Nature Cell
xvii
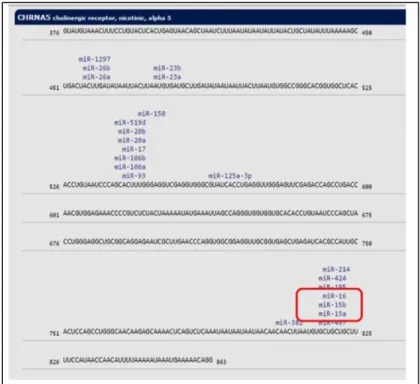
Figure 1.10: Predictive binding sites of miR-15a family in 3’UTR of CHRNA5. ... 28 Figure 3.1: Downregulation of CHRNA5 expression with RNAi. Downregulation of
CHRNA5 isoforms at mRNA levels treated with 72 h of siRNA-2 (A), with siRNA-3 (B) (n=2 per group). Downregulation of CHRNA5 at protein level with siRNA-1 (C) (n=4 per group), with siRNA-2 and siRNA-3 (D) along with their densitometry analyses (n=4 for siRNA-CN, n=3 for siRNA-2 and siRNA-3).DIC microscopy images of MCF7 cells treated with 72 h of siRNA-CN (10nm) (E), siRNA-1(10nm) (F), siRNA-CN (50nm) (G), siRNA-2 (50nm) (H), siRNA-3 (50nm) (I). One-Way ANOVA followed by Tukey’s HSD tests for RT-qPCR and Student’s t-test for densitometry analysis were used, (*:p<0.05; **:p<0.01; ***,#:p<0.001; ****p<0.0001). ... 68
Figure 3.2: RT-qPCR validation of CHRNA5 RNAi microarray data. Validation of
microarray findings with RT-qPCR of selected genes by using 72 h of independent siRNA-2 and siRNA-3 exposure studies (n=siRNA-2 per group). Student’s t-tests in comparison with their corresponding siRNA-CN group was performed, (*: p<0.05; **: p<0.01, #: p<0.001). ... 69
Figure 3.3: The Effects of CHRNA5 depletion on cell viability in MCF7 cells. Relative
cell viabilities of MCF7 cells upon 72h of siNRA-1 (10nM), siRNA-2 (50nM) and siRNA-3 (50nM) transfections (n=3 per group). One-Way ANOVA followed by Tukey’s HSD tests was used. (**: p<0.01; ***: p<0.001; ****: p<0.0001). ... 70
Figure 3.4: Effects of CHRNA5 depletion apoptosis, cell cycle and DDR pathways in MCF7 cells. Western blot results for pRB (S807/811), total CASP7, Cleaved
CASP7-7, BCL2, BAX, total CHEK1, p-CHEK1 (S345), pH2AX(Ser139) in 72 h siRNA-1 treated MCF7 cells (A); and 72 h siRNA-2 and siRNA-3 treated MCF7 cells (B). Densitometry measurements of pRB (C), BAX/BCL2 (D), total CHEK1 (E) and pCHEK1 (F), cleaved CASP7/total CASP7 ratio (G) and pH2AX (H). One-Way ANOVA was used in comparison with corresponding control groups, siRNA-CN (10nM) vs siRNA-1 and siRNA-CN (50nM) vs siRNA-2 and siRNA-3. (n=2 per group for siRNA-CN (10nM) and siRNA-1; n=3 per group for siRNA-CN (50nM) and siRNA-2 and siRNA-3), (+ :p <0.1, *: p< 0.05,**:p<0.01). ... 73
Figure 3.5: Effects of CHRNA5 depletion on genes related with apoptosis. A)
xviii of siRNA-1-3 treated MCF7 cells (n=2 per group). B) BAX/BCL2 ratio from RT-qPCR results (n=2 per group). One-Way ANOVA followed by Tukey’s multiple test correction is used. (*: p<0.05, **: p<0.01, #: p<0.001) ... 74
Figure 3.6: Effects of prolonged depletion of CHRNA5. 120h siRNA-1 treatment in
MCF7 cells at mRNA (A) and at protein levels together with densitometry analysis (B). Western blot results for pRB, Total CASP7, cleaved CASP7, BCL2, BAX, CHEK1, pCHEK1 and pH2AX (C); together with their densitometry analyses (D), (n=2 per group). Student’s t-test was applied, (*: p<0.05; **: p<0.01). ... 75
Figure 3.7: Effects of CHRNA5 RNAi on apoptosis, cell cycle and DDR in BT20 and MDA-MB-231 cells. Selected genes were checked with RT-qPCR (A). BAX/BCL2 ratio
in BT20 and MDA-MB-231 cells treated with 72 h of siRNA-1 molecules (B), (n=2 per group). One-Way ANOVA followed by Tukey’s multiple test correction was used). (+:p <0.1, *: p< 0.05, **: p<0.01). ... 77
Figure 3.8: Effects of CHRNA5 depletion on drug sensitivity in MCF7 cells. MTT
analyses of different doses of CPT (A) and DOXO (B) along with 72h of siRNA-1 treatments or CPT (C) and DOXO (D) along with72h of siRNA-2 treatments in MCF7 cells, (n=3 per group). One-Way ANOVA followed by Tukey’s multiple test correction were used for statistical analysis. (*: p<0.05, **: p<0.01; ***: p<0.001; ****: p<0.0001). ... 78
Figure 3.9: Effects of CHRNA5 depletion on drug sensitivity in BT20 (A and B) and in MDA-MB-231 cells (C and D). MTT analyses of different doses of CPT (A) and DOXO (B) with 72h of 1 treatment in BT20 and CPT (C) and DOXO (D) with 72h of
siRNA-1treatment in MDA-MB-231 cells, (n=3 per group). One-Way ANOVA followed by Tukey’s multiple test correction were used for statistical analysis. (*: p<0.05, **: p<0.01; ***: p<0.001; ****: p<0.0001). ... 79
Figure 3.10: Phenotypic changes in MCF7 cells upon siRNA or siRNA-CN treatments with or without TOPO inhibitors. Microscopy images of MCF7 cells at the
end of 72 h treatment with siRNA-CN (10nm) and siRNA-1 (10nm) with 0.125μM CPT or DMSO (A); treatment with siRNA-CN (50nM), siRNA-2 (50nM) and siRNA-3 (50nM) with 0.125μM CPT or DMSO (B); treatment with CN (10nM), 1 (10nM), siRNA-CN (50nM), siRNA-2 (50nM) and siRNA-3 (50nM) with 0.125μM DOXO or DMSO (C).81
xix
Figure 3.11: The effects of CHRNA5 depletion in drug sensitivity in MCF7 cells. (A-C) The representative western blot images treated with DMSO, CPT and DOXO (all
0.125µM) along with siRNA-1 (A) or siRNA-2 and siRNA-3 (B and C). The densitometry analysis of CHRNA5 (D), BAX/BCL2 (E), total CHEK1 (F), pCHEK1 (G), cleaved CASP7/total CASP7 (H), pH2AX (I). Two-Way ANOVA was used. (n=3 for DMSO siRNA-CN (50nM), siRNA-2 and siRNA-3; n=2 for other groups). (+:p <0.1, *: p< 0.05, **: p<0.01, ***:p<0.001, ****:p<0.0001). ... 83
Figure 3.12: Microscopy images of BT-20. A) Effect of CPT (0.125µM) along with
siRNA-1 (10nM) in comparison to their corresponding control groups on BT-20 cells’ phenotype. B) Effect of DOXO (0.125µM) along with siRNA-1(10nM) in comparison to their corresponding control groups in BT-20 cells. ... 85
Figure 3.13: Effects of CHRNA5 RNAi along with TOPO inhibitors on DDR proteins in BT-20 cells. Western Blot results of BT-20 cells with CPT (0.125µM) (A) and DOXO
(0.125µM) (B) treatments along with siRNA-1(10nM) and siRNA-CN (10nM). Densitometry results with statistical analysis of CPT (C) and DOXO (D) with or without siRNA-1. (n=2 per group), Two-Way ANOVA was used, (+ :p<0.1, * :p< 0.05). ... 86
Figure 3.14: Microscopy images of MDA-MB-231 cells. A) Effect of CPT (0.015µM)
along with siRNA-1 (10nM) in comparison to their corresponding control groups on MDA-MB-231 cells’ phenotype. B) Effect of DOXO (0.06µM) along with siRNA-1(10nM) in comparison to their corresponding control groups in MDA-MB-231 cells. ... 87
Figure 3.15: Effects of CHRNA5 RNAi along with TOPO inhibitors on DDR proteins in MDA-MB-231 cells. Western Blot results of MDA-MB-231 cells with CPT (0.015 µM) (A), and DOXO (0.06 µM) (B), treatments along with siRNA-1(50nM) and siRNA-CN
(50nM). Densitometry results with statistical analysis of CPT (C) and DOXO (D) with or without siRNA-1. (n=2 per group). Two-Way ANOVA was used (+ :p<0.1, * :p< 0.05, **: p<0.01, ***:p<0.001). ... 88
Figure 3.16: Expression levels of mir-15/16 family members upon 72h of CHRNA5 siRNA-1 treatment in MCF7 cells. One-Way ANOVA followed by Tukey’s multiple test
correction is used. ... 90
Figure 3.17: Specific miRNA mimic treatments for 72h. A) Upregulation of
xx miRNA-15b mimic treatment, C) Upregulation of miRNA-16 upon miRNA-16 mimic (5nM) treatment in MCF7 cells, (n=2 per group). Each sample normalized with siRNA-CN group and One-Way ANOVA followed by Tukey’s multiple test correction is used. (*:p< 0.05, **: p<0.01, ***:p<0.001, ****:p< 0.0001). ... 90
Figure 3.18: Expression levels of CHRNA5 variants upon 72 h of miRNA specific mimic (5nM) treatments. One-Way ANOVA followed by Tukey’s multiple test correction
is used. (*:p< 0.05, **: p<0.01, ***:p<0.001). ... 91
Figure 3.19: RT-qPCR results of the selected genes known to be modulated by CHRNA5 depletion along with 72 h of mir-15/16 family mimic treatments. CASK (A),
GADD45A (B), WDHD1 (C), GJA1 (D), CLDN1 (E). (n=2 per group). One-way ANOVA was used for statistical analysis. (*: p< 0.05, **: p<0.01). ... 92
Figure 3.20: Expression of CHRNA5 levels upon siRNA treatments. CHRNA5
expressions upon 72h of siRNA-1 (10nM) (A) and siRNA-2 (50nM) and siRNA-3(50nM)
(B) treatments in MCF7 cells. (n=5 for siRNA-1 and siRNA-CN; n=2 for siRNA-CN (50nM),
siRNA-2 and siRNA-3). Student’s t-test was applied for A, and One-Way ANOVA was used for B (****: p< 0.0001). ... 93
Figure 3.21: RNA quality and Agilent values of RNAs. Representative values of RNA
samples A) for CN, B) for 1used in microRNA Array study (n=2 for siRNA-CN and siRNA-1)... 94
Figure 3.22: Scatter plot of two miRNA arrays. CHRNA5 depletion resulted in global
changes in miRNA expression profile. The most downregulated miRNAs clustered in 14q32.31 region shown with black triangle, among them the most downregulated one was has-miR-495-3p shown with red triangle. ... 95
Figure 3.23: RT-qPCR validation of the hsa-miR-495-3p expression levels upon CHRNA5 depletion. Results with siRNA-1 (n=5) (A); with siRNA-2 and siRNA-3 (n=2)
(B). Student’s t-test was applied for A, and One-Way ANOVA was used for B, (*:p< 0.05, ****: p< 0.0001). ... 96
Figure 3.24: Examination of CHRNA5 and hsa-miR-495-3p expression levels by RT-qPCR. Validation of the decrease in CHRNA5 expression (A and B); increase in
hsa-mir-495-3p levels upon miR-495 mimic application (C and D). (n=2 per group). One way ANOVA was conducted as statistical analysis (*: p<0.05, **: p<0.01). ... 97
xxi
Figure 3.25: The scatterplot of log fold changes obtained from CHRNA5 siRNA microarray study (Ermira Jahja, PhD Thesis, GSE89333) against those obtained from mir-495 mimic microarray study. Red circled area represented the genes in which
siRNA-1 and miR-495 mimic acted additively; whereas in blue circled area represented the genes in which siRNA-1 and miR-495 mimic acted oppositely. ... 98
Figure 3.26: IPA upon CHRNA5 depletion and miR-495 overexpression. The effects
of each 3 treatments (i.e only siRNA-1, only miR-495 mimic and siRNA-1 + miR-495 mimic) in canonical pathways (A), in diseases and bio functions (blue indicates inhibition, orange indicates activation) (B), in G1-S cell cycle arrest (C). ... 103
Figure 3.27: IPA of miRNAs clustered in 14q32.31 region. Top 10 diseases and bio
functions related with miRNAs from 14q32.31 region (A). Detailed map of the affected genes upon CHRNA5 depletion analyzed with the clustered miRNAs at 14q32.31 region
(B). ... 105 Figure 3.28: MTT assay to investigate the effects of CHRNA5 depletion and miR-495 mimic treatment on cell viability of MCF7 cells One-Way ANOVA followed by
Tukey’s multiple test correction were used for statistical analysis (*: p <0.05, ****: p<0.0001) ... 106
Figure 3.29: PI staining of MCF7 cells treated with combinations of siRNA-1 and miR-495 mimic. Treatments were held with either siRNA-1 alone or miR-495 mimic alone
and together with siRNA-1 and miR-495 mimic in MCF7 cells for 72h, (n=2 per group). One-Way ANOVA followed by Tukey’s multiple test correction were used for statistical analysis. (#: p< 0.001; *: p<0.05 and compared to siRNA-CN (20nM). ... 107
Figure 3.30: 7-AAD/BrDU staining of MCF7 cells treated with miR-495 mimic alone or together with siRNA-1 in MCF7 cells. (In the graph, only the statistical analyses in
between groups were shown for ‘G1’ phase. *: p< 0.05, **: p<0.01, ***: p<0.001, ****: p< 0.0001. Two-Way ANOVA was used for statistical analysis and all treatment groups; siRNA-CN+siRNA-1, siRNA-CN+mimic-495, siRNA-1+mimic-495 were significantly different than siRNA-CN and TR control at the same significance level p<0.0001). .... 108
Figure 3.31: Effects of siRNA-1 and /or mir-495 mimic treatments on MCF7 cells’ phenotype. Images were taken at the end 72h of treatments. ... 110
xxii
Figure 3.32: Effects of CHRNA5 depletion and miR-495 overexpression on proteins in MCF7 cells. Images of CHRNA5, CDKN1A, CDK2, pRB1 proteins (A) and BCL2, BAX,
p-CHEK1 and γH2AX proteins (B) at the end of 72 h treatment with mimic miR-495 alone or together with siRNA-1 in MCF7 cells. GAPDH was used as a loading control. ... 111
Figure 3.33: RT-qPCR validation of additively or inversely affected genes from miR-495 microarray study. On the left sides the results from miR-miR-495 array is shown.
RT-qPCR results for two groups having different concentrations are shown in the middle and on the right side. A) WDHD1, BIRC5 and ANLN. B) CCND1, CCNE2 and CDC6. C) CHEK1 and CDC6. D) GADD45A, GPNMB, CDKN1A. E) MAP1B and CLDN1. F) BAX, BCL2, FAS. (n=2 per group for RT-qPCR results). One-Way ANOVA followed by Tukey’s multiple test correction were used for statistical analysis. (*: p<0.05, **: p<0.01; ***: p<0.001; ****: p<0.0001). ... 118
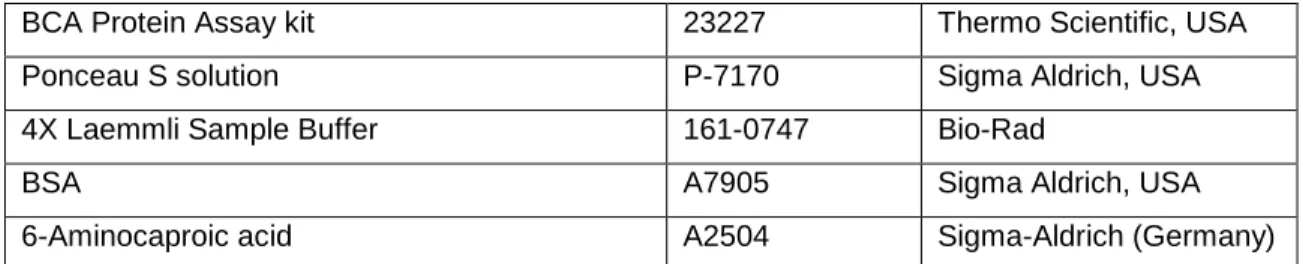
List of Tables
Table 2-1: Kits, Reagents, General Chemicals ... 40 Table 2-2: List of Nucleic Acids ... 42 Table 2-3: Primer Pairs ... 43 Table 2-4: Antibody Information ... 45 Table 2-5: List of Equipment ... 45 Table 2-6: General Buffers and Solutions ... 46 Table 2-7: Cell Culture Solutions ... 46 Table 2-8: Western Blot Reagents and Solutions ... 47 Table 2-9: Composition of 10% SDS-PAGE ... 48 Table 2-10: RT-qPCR conditions for the detection of gene expression levels ... 52 Table 2-11:RT-qPCR conditions for the detection miRNA expression levels ... 53 Table 2-12: Experimental Groups ... 55 Table 3-1. Top 10 most affected microRNAs (p< 0.05) ... 96 Table 3-2: Top Upregulated and Downregulated Genes by miRN-495 alone and
xxiii
Table 3-3: The list of KEGG pathways modulated by mir-495 mimic alone for A)
1
CHAPTER 1: INTRODUCTION
1.1 Breast cancer
1.1.1 General background of the disease and the breast tissue
Among women, breast cancer is the most common cancer type worldwide [1]. According to Cancer Statistics 2018 held in USA, out of 878.980 cancer cases, it is estimated that 266.120 of woman will be diagnosed with breast cancer which accounts for 30% of the top 10 cancer types in woman. Among diagnosed women, 40.920 estimated deaths will occur in 2018.
Apart from pediatric cancers, cancer is generally defined as the disease of the old [2]. Generally, without an obvious genetic background, sporadic cancers occur later in life [3], however the ones having a hereditary background may occur earlier in life implying the importance of genetic contribution [4].
Similar to the other types of cancer, due to its heterogeneous nature, breast cancer has varying prognoses and treatment options for breast cancer patients [1]. Prognosis of the cancer patients is important, since it estimates the risk of recurrence at early stages and also helps define the patients who could benefit from a specific therapy or not [5]. In the case of breast cancer, which exhibit high intra-tumor as well as inter-tumor heterogeneity [6], prognosis of a patient is highly dependent on the successful classification of the cancer subtype and hence proper therapy to be received.
The two main components of mammary gland are parenchyma, which performs the
specific function of the organ, and the stroma, which is the connective tissue providing both the framework of the organ as well as the environment where parenchyma can work
and grow [7]. The parenchyma is composed of alveoli, where milk is produced and stored,
and the branching ducts from where the milk is carried to the nipples [8]. The branching ducts are composed of two types of cells, namely, inner bilayer epithelial cells where the
2 milk is produced, and the outer surrounding layer of myoepithelial cells, which contacts with basement membrane [9].
This relatively basic structure of the mammary gland actually has more complex order of cellular functions which appears during carcinogenesis leading to the high level of heterogeneity of breast cancers [10]. It is this intra- and inter-tumor heterogeneity of the breast tissue that can lead to many subtypes of this disease.
Breast cancer develops from normal tissue to invasive ductal carcinoma (IDC) with stepwise progression involving many genetic and epigenetic alterations (Figure1). This starts with over production of normal looking cells called hyperplasia which is then followed by atypical hyperplasia where the cells divide on top of each other and some of them have the necessary alterations to turn into a cancerous tissue [11]. Atypical hyperplasia is then followed by noninvasive ductal carcinoma in situ (DCIS). DCIS is known to be non-invasive, but it can vary between the low-grade and high-grade lesions that can have alterations for invasiveness leading to invasive ductal carcinoma (IDC) [2]. Although it is speculative whether DCIS is the necessary step for the invasive breast cancer progression or not, many invasive cancer lesions occur together with adjacent DCIS during diagnosis. Moreover, recently, similar genetic alterations were identified between DCIS and invasive breast cancer suggesting that DCIS may act as a precursor for the invasive breast cancer in the absence of intervention [12].
3 Figure 1.1: Progression of invasive ductal carcinoma. Progression of breast cancer
tumorigenesis starting from epithelial hyperplasia to invasive ductal carcinoma. Adapted from
Myal Y. et al.,2010. Journal of Biomedicine and Biothecnology [13].
1.1.2 Subtypes of breast cancer and current treatment strategies
The subtyping of breast cancer is important since it helps to determine the course of therapy as well as gives information about the tumor progression [10].
The histological and molecular characteristics of breast cancer lead to emergence of many subtypes of the disease. The traditional histopathological and immunochemical classification of breast cancer was recently replaced with molecular subtyping since it is based on gene expression profiling and hence has the potential to combine clinical outcome and disease mechanism by giving better prognosis [6]. Actually, as stated by Perez EA (2011), breast cancer is among the few types of cancers where the molecular subtyping works best and increases the rate of disease free survival with individualized targeted therapy [14].
4 Based on gene expression profiling of large patient cohorts, currently six molecular subtypes of breast cancer were identified as follows (Figure 1.2):
o Luminal A and Luminal B Breast Cancers are characterized by their ER positivity (ER+). Luminal A is the most common subtype and has a favorable prognosis among the other types of the breast cancers [15]. Together with ER positivity, Luminal B is also characterized by its Her2 overexpression [16], and hence the drugs such as trastuzumab which targets Her2 has increased the survival of this group of patients [17]. In addition to Her2 status, one of the major differences between these two subtypes is the expression pattern of the genes related with proliferation [18], [19]. In addition to the ER and Her2 status, Luminal A subtype of breast cancers express PR, whereas Luminal B type of breast cancers may or may not express PR. Compared to Luminal B breast cancers, Luminal A breast cancers give better prognosis [20] but altogether, these two subtypes of breast cancers still have better prognosis compared to the ER (-) subtype since they can respond to targeted anti-estrogen treatments like tamoxifen [2].
o Her2+ Breast Cancers are associated with their over expression of HER2/neu proliferation related genes. HER2 is one of the epidermal growth factor receptor family, and in cancers, it behaves as an oncogene [21]. Since this subtype is frequently negative for ER status, therapy does not include anti-estrogenic hormone therapy [2]. Despite these, Her2 (+) subtype of breast cancers have poorer prognosis compared to luminal ones [20], yet combined targeted
therapies such as trastuzumab (anti-Her2 antibody) and lapatinib (tyrosine kinase inhibitor), improved the survival of these patients [22], [23].
o Basal Like Breast Cancers comprises 15% of invasive ductal carcinomas. Since this subtype of breast cancers shares high number of genes with basal epithelial cells, they are called as ‘Basal like breast cancers’. Since they do not express any of the ER, PR and Her2/neu receptors, they are so called ‘Triple negative breast cancers’ (TNBC) [5]. Since they are negative for all three receptors (which
5 could be otherwise targeted for either hormone or Her2 targeted therapy), and they also have high proliferation rate, they have very poor prognosis [20]. Most of the TNBC patients have mutations in BRCA1/2 gene which is one of the most important components of DNA repair machinery [24]. Therefore, using agents inducing DNA damage such as platinum for the treatment of TNBC patients is considered as an alternative treatment strategy [25].
o Claudin-low Breast cancers are associated with the high expression levels of the genes involved in epithelial to mesenchymal transition (EMT), stem cell related genes, and the ones associated with tumor initiation [26]. Patients with Claudin low breast cancers could be treated with chemotherapeutic agents however the prognosis is poor. Since they do not express hormone receptors and Her2, they are not sensitive to conventional chemotherapy [26].
o Normal Like breast cancers are so called since they reside closely to the normal breast epithelium based on microarray gene expression studies. They express ER and PR however do not express Her2 [27]. It is still speculative that whether this subtype of breast cancer represents a distinct subtype, or they are just outside of the other subtypes due to contamination of normal epithelium [27].
Figure 1.2: Breast cancer subtypes. The classification of breast cancer according to hormonal
receptor status. Breast tumors and cell lines are compatible with each other. Figure adapted from
6
1.2 Chemotherapy and drug resistance mechanisms in cancer
Chemotherapy constitutes one of the most important components of primary cancer treatment for both survival and better prognosis of the cancer patients [29]. However, one of the biggest challenges throughout the chemotherapy is the occurrence of drug resistance [30], [31]; in other terms tumor cells fail to respond to the actions of cytotoxic drugs. Drug resistance can be present intrinsically even before encountering the chemotherapeutic drugs or can be acquired during the therapy [31] such as by activating an alternative compensatory pathway which is intended to be targeted or by mutations which result in increased expression of targeted molecule [32]. In addition to these, resistance could also develop by the group of the cells which gains drug induced resistance and have a selective advantage over the other cell populations due to the heterogeneous nature of the tumor [33].
Drug resistance, either it is acquired or inherited, can occur via many different mechanisms. Among them alterations in drug metabolism is the most studied one [30]. This includes changes in uptake, efflux and activation/inactivation of the drug. The nature of the drug determines the way how it will enter to the cell. It may enter via transporters or it may exert its function by just binding to the receptors and transmit the effects without entering the cell. At this point, mutations in transporters and receptors, or changes in the expression levels of them may lead to drug resistance [30]. Another way which cancer cells gain drug resistance is the excessive efflux of the chemotherapeutic agent and promoting expression levels of the transmembrane proteins which efflux the drugs, such as multidrug resistance protein 1 (MDR1) [34].Inactivation of drug or lack of drug activation are the other ways of mechanisms for the development of drug resistance [34]. Mutations or downregulation of the enzymes required for the activation of the drug or overexpression of drug metabolizing enzymes such as CYP450 can lead to drug inactivation and hence drug resistance eventually [30]. Cancer cells have great tendency to be addicted to oncogenic mutations which give them growth advantage and resistance to various apoptotic stimuli [34]. In this case, targeting one protein may be ineffective since another alternative pathway may support the survival of the cancer cells, which is
7 termed as ‘synthetic lethal relationship’, making the cancer cells resistant to the chemotherapeutic agent [35]. Another way, which cancer cells resist chemotherapeutic agents inducing DNA damage directly or indirectly, is the promotion of DNA repair pathway. Upon treatment with drugs inducing DNA damage such as platinum-based drugs or topoisomerase inhibitors, cancer cells activate cell cycle arrest in order to gain time to repair their DNA and escape from apoptosis [34]. Thus using the drugs targeting the repair pathways in cancer cells together with DNA damage inducing agents is important to prevent cancer cells escape from apoptosis [34].
1.2.1 Topoisomerase inhibitors
During DNA replication, transcription or recombination, there occur topological restrictions such as introduction of supercoils due the double helix structure of the DNA [36]. To preserve the integrity of DNA, enzymes called ‘DNA topoisomerases’ solve such problems by introducing a temporary cleavage to one or both strand of the DNA [37]. In the case of topoisomerase class I enzymes, one cleavage is introduced to one strand, and then it is passed through the other strand of the helix. In the case of topoisomerase class II enzymes, both strands are cleaved and passed through the other helix [36]. At the end, cleavage sites are resealed to the backbone of the DNA. During this cleavage event, a temporary covalent bond between DNA and topoisomerases occurs which is called as ‘trappable complexes or cleavable complexes’. It is these sites where topo-active anti-cancer agents act [38] on. Topoisomerase (TOPO) inhibitors interfere with the bond between the DNA strand and topoisomerase by creating a permanent DNA breakage. Since the DNA cannot be repaired, replication fork collapses leading to cell death [39].
There two types of topoisomerase inhibitors, topoisomerase I inhibitors and topoisomerase II inhibitors which are explained as follows.
8
1.2.2 Cytotoxic effects of topoisomerase I inhibitors
This class of inhibitors includes camptothecin (CPT) and non-camptothecin compounds; such as topotecan, irinotecan and indolocarbazoles, indenoisoquinolines, dibenzonaphthyridinones, respectively [40]. Camptothecin is a plant alkaloid which has an anti-tumor activity against many solid tumors [41]. These highly selective TOP1 inhibitors exert their cytotoxic effects neither by binding to the enzyme nor to the DNA but by interfering with the enzyme-DNA complex leading to the formation of non-productive complex [42]. When DNA replication or transcription machinery collides with this bulky DNA lesion, it leads to the double stranded break (DSB) which is called as ‘replication fork run off’ [43]. Upon DSB, DNA damage response (DDR) signaling pathway steps in by the activation of ATM (ataxia telangiectasia mutated) and ATR (ataxia telangiectasia and Rad-3-related) kinases, H2AX phosphorylation and p53 stabilization. It is important to note that, not the inhibition of TOP1 itself, but the formation of TOP1-cleaveable complex and the following DSB are the major requirements for the cytotoxic effect of CPTs. Cell types, proliferation status, expression levels of TOP1 are also important factors for determining the cytotoxic effects of CPTs [44].
1.2.3 Cytotoxic effects of topoisomerase II inhibitors
TOP2 inhibitors are categorized into two classes and the first one is called as ‘TOP2 poisons’ including doxorubicin, etoposide and mitoxantrone. The TOP2 poisons exert their cytotoxic effect by increasing the levels of TOP2-DNA covalent complexes. This includes DNA strand breaks as well as protein accumulation bound to DNA, which eventually blocks transcription and replication [45]. As a result, TOP2 poisons rapidly result in enzyme mediated DNA damage which steps in DDR by the activation of ATM and downstream signaling pathways [46]. Among TOP2 poisons, anthracycline doxorubicin is one of the most studied chemotherapeutic drugs since it is also accepted as one of the most potent FDA approved chemotherapeutic agents [47]. Doxorubicin intercalates the DNA’s double helix hence resulting in DNA damage. When the attempt to repair the DNA fails, cellular growth is inhibited, as a result apoptosis is triggered [48].
9 The second class of TOP2 inhibitors is named as TOP2 catalytic inhibitors since they do not generate the DNA-enzyme complex rather they inhibit the catalytic activity of the enzyme [45]. Some of the TOP2 catalytic inhibitors are novobiocin, merbarone and the anthracycline aclarubicin [49] .
1.3 Role of nicotinic cholinergic receptors in cancer
1.3.1 Nicotine and its connection with cancer
There is an increasing evidence that consumption of nicotine, which is the major component of tobacco [50], is associated with many cancer types [51] such as lung, gastric, liver, colon, breast and kidney cancers as well as other diseases including heart diseases and stroke [52].
In order for tumorigenesis to develop, there should be a constant exposure to the agent, which is easily achieved in the case of smoking due to the addictive nature of nicotine [53]. In addition to cotinine, which is produced by the conversion nicotine in the tissues, the other two tobacco nitrosamines; N’-nitrosonornicotine (NNN) and 4-(methylnitrosamino)-1-(3-pyridyl)-1-butanone (NNK) are the carcinogens which have higher affinity for binding to nicotinic acetylcholine receptors (nAChRs) than the natural ligand acetylcholine (Ach) in non-neural cells [51]. Furthermore, nicotine also results in upregulation of nAChRs in cancer cells resulting in increased signaling of nAChRs [51] .
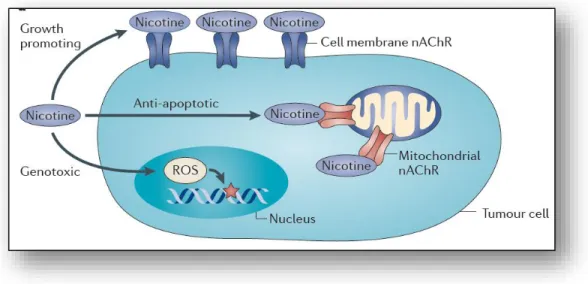
Most of the nicotine is absorbed by gastrointestinal tract and converted to cotinine which exerts its carcinogenic effects by increasing the formation of DNA adducts, promoting proliferation and evasion of apoptosis [54]. Moreover, these carcinogens result in mutations in vital genes such as KRAS, Rb and p53 which also contribute to DNA adduct formation [55]. In addition to cotinine, other nicotine metabolite NNN is also carcinogenic which induces tumorigenesis as well [56]. Genotoxic effects of nicotine also occur with the production of high levels of reactive oxygen species (ROS) by the stimulation nAChRNs, which eventually results in DNA damage [51] (Figure 1.3). Moreover, in one
10 study, it was shown that nicotine resulted in upregulation of anti-apoptotic protein BCL-2 (B-Cell Lymphoma2) levels in highly malignant MDA-MB-231 breast cancer cell lines showing the interplay between nicotine and cancer cell survival in breast cancer [57]. In another study, it was also shown that cigarette smoke extract (CSE) exposed MCF7 breast cancer cell line showed metastasis in the lungs of the mice, whereas no metastasis was observed in mice injected with unexposed MCF7 cells suggesting the metastasis promoting feature of cigarette smoking hence nicotine exposure [58]. Moreover, an in vivo study with mouse model of lung cancer showed that nicotine resulted in increased number and size of the tumor, and promoted metastasis [59].
Figure 1.3: Effect of nicotine. Nicotine exerts its effect through binding to nAChRs resulting in
transcriptional and post-transcriptional modifications. Adapted from Grando A. S., 2014. Nature
Reviews Cancer [51]. (License Number 4487160216099).
1.3.2 Nicotinic acetylcholine receptors (nAChRs)
Nicotinic acetylcholine receptors are integral transmembrane proteins [60] which are expressed both in neuronal and non-neuronal tissues [61]. Depending on their pharmacological properties and the relative affinities to the certain molecules, they are classified into two categories: metabotropic muscarinic AChRs (mAChRs) and ionotropic nAChRs. As the name implies mAChRs are responsive to muscarine and natural agonist Ach and mostly found in skeletal muscles where they participate in mediating
11 neuromuscular transmission [62]. mAChRs are ligand gated ion channels and they are composed of different combinations of 5 subunits including two α1, one β1, one δ and γ (or ε depending on the developmental stage). Similarly, nAChRs are also ligand gated ion channels and found both in neuronal and non-neuronal tissues which are responsive to nicotine besides Ach [63]. In neuromuscular junctions, upon stimulation, they result in release of neurotransmitters like γ-aminobutyric acid (GABA), serotonin and dopamine and that’s the actual reason why these receptors are associated with nicotine addiction [64]. nAChRs are composed of either homomeric or heteromeric combinations of 5 subunits which includes 9 alternative α subunits (α2- α10) and 3 alternative β subunits (β2- β4) [60], [65], [66]. Homomeric pentamer channels are only composed of one of identical α7, α8 (not in humans) or α9 subunits (Figure 1.4).
Figure 1.4: Structure of nicotinic acetylcholine receptors family. Homomeric and heteromeric
structure of nAChRs. Adapted from Grando A. S., 2014. Nature Reviews Cancer [51]. (License
Number 4487160216099)
In a study done by Schuller H. M., (1989), the involvement of nAChRs in tumorigenesis has been shown for the first time [67]. Moreover, through other researches it is also shown that nAChRs are involved in various cancer signaling pathways in cell type specific manner such as angiogenesis [68], metastasis [69], apoptosis [70].
12 Among the cholinergic receptors, homomeric pentamer composed of only α7 subunits, are mainly implicated in nicotine and NNK induced proliferation [71]. Through the stimulation of Akt and ERK pathways, α7 nAChRNs contributes to the progression, metastasis and angiogenesis of lung, bladder and gastrointestinal cancers [59]. Since the antagonists of α7 nAChRNs like α-Bungorotoxin result in deactivation of these receptors, downregulation of these receptors such as by using siRNAs represents an alternative approach for cancer therapy [72].
1.3.3 Role of nicotinic acetylcholine receptors (nAChR) in cancer
signaling pathways
Acetylcholine, which is the natural agonist of nAChRs, acts like an autocrine growth factor both at systematic and cellular levels [73]. It participates in many biological signaling pathways in neuronal as well as non-neuronal cells such as learning, memory, sleep cycle regulation [61] and proliferation, apoptosis, differentiation, migration [74], respectively. Ach is synthesized from choline and acetyl coenzyme A by choline acetyltransferase (ChAT) and hydrolyzed by acetylcholinesterase (AchE) [51].
Upon binding of Ach or nicotine to the α subunit of nAChRs, it results in a conformational change in the receptor and hence leads to Ca+ and Na+ influx from extracellular side to the intracellular side of the cell and efflux of K+ ions [75]. Increase in Ca+ levels ends up with thedepolarization of the membrane and this further propagates the opening of the voltage-operated calcium channels (VOCC). Hence more and more Ca+ enters to the cell triggering the release of growth factors which activates various downstream signaling pathways such as proliferation, apoptosis, angiogenesis, migration and differentiation depending on the cell type.
One of the important pathways involved in upon nAChRs stimulation is proliferation and regulation of the genes involved in proliferation. Β-arrestin, which is a scaffolding protein, is recruited to the nAChRs upon one of the agonists of it (nicotine or other nicotine derived metabolites or Ach) binds to the receptor [76] (Figure 1.5). With the downstream activation
13 of Src and Raf pathway, Retinoblastoma protein (Rb) is bound by Raf leading to Rb inactivation. Subsequent release of E2F from inhibitory binding of Rb, leads to CDK-cyclin activation which results in transcriptional activation of E2F initiated transcription of the G1-S transition genes [71] (Figure 1.5). Therefore, we can say that Rb-E2F pathway is one of the major players upon stimulation of nAChRs [76].
Another pathway involved in nAChR-stimulated proliferation is JAK-STAT pathway. STAT3 promotes the cell cycle progression through overexpression of cyclin-D1 [77]. In one study, chemotherapy sensitivity was restored with the depletion of STAT3 showing the impact of nAChR mediated stimulation of cell cycle progression [71].
Beside modulations of cell proliferation pathways, nAChR signaling also participate in resistance against apoptotic signals through PI3K-AKT signaling [78] (Figure 1.5). Akt is known to regulate anti-apoptotic protein BCL-2 and pro-apoptotic BAX, BAD proteins by phosphorylating them [79],[78]. Moreover, this signaling cascade also upregulates survivin and x-linked inhibitor of apoptosis (XIAP) which are the inhibitors of apoptosis [80]. Together with the modulations of pro-survival and anti-apoptotic signaling cascades, nAChRs have great impact on chemoresistance and hence the cancer patients who smoke have worse prognosis and poor response to chemotherapy compared to their non-smoking counterparts [81],[82],[83].
During tumor progression, the needs of oxygen and nutrients for cancer cells exceed beyond the simple diffusion. Therefore they develop ways to induce angiogenesis which stands for ‘development new blood vessels’ [84]. The developmental stages of angiogenesis start with recruitment of endothelial cells by secreting cytokine or angiogenesis inducing stimuli such as hypoxia. Following these inductions, endothelial cells degrade the basement membrane and move towards to the stimuli via VEGF (vascular growth factor) mediated mechanism [85], [86]. Similar to the cancer cells, vascular endothelial cells express nAChRs, hence Ach, as well as nicotine and its metabolites can act as in an autocrine or paracrine fashion to induce vascularization via VEGF signaling [87],[88]. Moreover, in a study done by Jarzynka MJ et al, estradiol in
14 combination with nicotine, enhanced the growth of lung cancer xenograft through VEGF mediated mechanism [89].
Another important biological process highly modulated in cancer cells is EMT which is the crucial step for metastasis and invasion [59]. β-catenin and E-cadherin are the two important epithelial markers are downregulated followed by the upregulation of mesenchymal markers like fibronectin and vimentin occurs upon nicotine induction [59], [90]. Implication of nAChRs in metastasis and invasion was identified in many cancers including lungs, pancreas and breasts [90].
Taking into account the interplay between nAChRs and various cancer signaling pathways, nicotine and its metabolites confer important factors for the tumor progression. Different subtypes of nAChRs may become prominent in one specific type of cancers such as the implication of α7 nAChRs in lung cancer and α9 nAChRs in breast cancer tumorigenesis [91].
Since most of the drugs targeting nAChRs are not subtype-specific [92], it is important to reveal the precise connection between the deregulated signaling pathway in cancer type specific manner.
15 Figure 1.5: Signaling cascade upon nAChRs activation. Binding of nicotine to nAChR
activates common cancer signaling pathways via recruitment of β-arrestin which in turn recurits Src kinase. This leads to activation of PI3K/AKT signalling, Ras/Raf/MAPK signalling pathways.
Adapted from Schall C. et al., 2014. Molecular Cancer Research [71]. (License Number 4487160885032).
1.3.4 Implication of CHRNA5 in cancer
The chromosomal locus 15q25.1 locus is home for CHRN genes encoding for nAChRα3, nAChRα5, nAChRβ4 [93],[94] which are highly associated with nicotine addiction, smoking behavior and hence predisposition for the development of lung cancer [95].
Moreover, the non-synonymous single nucleotide polymorphism in CHRNA5 which causes an amino acid change in aspartic acid to asparagine at the position of 398 (D398N) [96], (Figure 1.6), contributes to the nicotine addiction and hence strongly associated with risk of lung cancer development [97].
16 Figure 1.6: Cholinergic Receptor Nicotinic Alpha-5. Subunit composition of CHRNA5. Adapted
from Lassi G. et al., 2016. Trends in Neuroscience [98].
In a study done by Ramirez et al, the authors demonstrated the importance of α5 subunit for the formation and the lining of functional receptor complex. Depletion of α5 subunit with anti-sense oligonucleotides resulted in selective deletion of the highest conductance channel from the cholinergic receptor [97].
1.4 Cell cycle and DNA damage response
1.4.1 Cell cycle regulation in cancer cells
The process where the cell replicates all its components and partitions it to the daughter cells termed as cell division cycle [99]. It is composed of four sequential steps; where in the S phase DNA is replicated, in M phase, two daughter cells are generated with cell division. In between S and M phases, there are two gaps named as G1 and G2 [100]. The first gap, G1, plays an important role for the cell to decide whether or not to initiate DNA replication [101]. Moreover, in G1 phase, cell is sensitive to both positive and negative signals [100]. The second gap called G2, is in between S and M phases, where the cell prepares to enter mitosis. In the case of high cell density or deprivation of positive signals for the promotion of cell division, cells are reversibly withdrawn from this cycle and stay in a state termed as ‘G0’ [102].
17 Cell cycle progression is propelled by the proteins termed as ‘cyclin-dependent kinases’ (CDKs) which are serine/threonine kinases. As the name implies, their activation depends on the other proteins called ‘cyclins’ whose levels change throughout out the cell cycle [103]. Cyclin D-CDK4, cyclin D- CDK6 and cyclin E-CDK2 complexes are responsible for G1 to S phase transition [104], whereas S phase is initiated by cyclin A-CDK2. Followed by S phase, cyclin B-CDK1 complexes are responsible for the transition from G2 phase to mitosis [105].
Figure 1.7: G1-S progression. RB is phosphorylated by the activated cyclin-D-CDK4 and
cyclin-D-CDK2 complexes, which in turn releases E2F transcription factors. E2F transcribes the genes necessary for S phase transition. Adapted from Stewart A. Z. , et al., 2003. Trends in
18 The retinoblastoma (RB) protein, which is known as a tumor suppressor protein since it negatively regulates cell cycle progression [106], is the substrate for the activated cyclin-CDK complexes during G1 phase. Moreover, it is responsible for G1 checkpoint, determining either entry to S phase or blocking the growth [106] depending on its phosphorylation level by cyclin-D-CDK4,6 and cyclin-E-CDK2 [104]. Hypophosphorylated RB does not dissociate from E2F member of transcription factors and hence inactivates them. Since E2F member transcription factors are needed for the transcription of the genes required for S phase transition, cells arrested at G1-S phase [104]. Therefore, for the activation of E2F, RB should be hyperphosphorylated by cyclin-CDK complexes for S phase entry [106].
Cyclin-B-CDK1 complexes regulate the transition from G2 to M phase [104], and are activated by CDC25C phosphatase which is responsible for removing the inhibitory phosphate group from CDK1 [107]. Followed by this, cells enter mitosis after the ubiquitination and degradation of cyclin-B by the anaphase-promoting complex (APC), which in turn deactivates CDK1 [108].
The complex series of this cell cycle phases are regulated by another pathway called as cell-cycle checkpoints [109]. Upon recognition of aberrant or incomplete cell cycle event, checkpoint elements signal this problem to the effectors to induce cell cycle arrest until the problem is solved. If the problem cannot be solved, then the checkpoint signaling can activate the pathways inducing programmed cell death.
Dysregulation of cell cycle is the hallmark in cancer cells [104]. For example, the dysregulation of pRB occurs through alterations in the upstream molecules such as cyclins and CDKs in most of the cancer types including lung and breast [110]. This can occur by increased levels of cyclin D and cyclin E as well as upregulation of the genes encoding CDK4 and CDK6 or deletion of the negative regulator of these CDKs, p16 [110]. Another protein altered in many of the tumors is p53 which acts as a tumor suppressor gene [111]. Alterations in p53 can occur as a germline mutation as well as its regulation
19 can be altered such that the amplification of MDM2, the negative regulator of p53, can result in inactivation of p53 [112].
1.4.2 DNA damage response in cancer cells
Endogenous and exogenous agents can induce DNA damage which in turn evokes cells’ DNA damage response (DDR) machinery [113]. The major functions of DDR are to sustain genomic integrity as well as to prevent tumor formation. DDR involves three main components one of which is the sensors such as pH2AX, RAD51 and MRN (Mre11-Rad50-Nbc1) complex [113]. The sensors then recruit the mediators like ATM (ataxia-telangiectasia mutated) and the ATR (ATM and Rad3 related) which are the key serine/threonine protein kinases. These mediators in turn phosphorylate various effector molecules such as CHEK1, CHEK2, p53, Wee1 and the others [114].
There are three important consequences of DDR; first by activation of checkpoint proteins controlling the regulation of cell cycle which gives time to cells to repair the damage. Second is the activation of DNA repair mechanism. And finally, the induction of apoptosis in the case of damage is too extended to be repaired [113].
Checkpoint kinase 1 (CHEK1) and checkpoint kinase 2 (CHEK2) are the important substrates of ATR and ATM kinases, respectively [113]. In the case double strand breaks (DSB), the sensors, MRE11/NBS1/RAD50 activate ATM which in turn activates CHEK2 pathway to induce S arrest and p53 dependent G1-S checkpoint [115] (Figure 1.8). On the contrary, ATR is activated upon the accumulation of replication protein A (RPA) on the sites of single-stranded DNA (ssDNA) which occurs due to DNA damage .The ATR’s binding partner ATR-interacting protein (ATRIP) is also recruited to ssDNA [116]. The key downstream molecule of ATR pathway is CHEK1 is activated by phosphorylation at Ser-317 and Ser-345. This also leads the rapid autophosphorylation of CHEK1 at Ser-296. These phosphorylations create binding sites for the CDC25 family phosphatases [113]. Similarly, the sequential phosphorylation of CHEK2 also creates binding sites for these phosphatases. In normal cells, the common mission of CDC25 phosphatases is to
20 remove the inhibitory phosphate groups of CDK proteins to let them pursue the cell cycle progression. In the case of DDR context, CHEK1/CHEK2 phosphorylates CDC25 proteins leading them to proteasomal degradation. Hence, this abolishes either CDK2/cyclinE complexation to lead G1/S arrest [117] or proteasomal degradation of CDK1/cyclin B kinases leading G2/M arrest [118].
Figure 1.8: Activated checkpoints upon DNA damage. DNA double strand breaks lead ATM
activation, whereas single strand breaks together with stalled replication forks activate ATR. These in turn activates checkpoint kinases resulting in either cell cycle arrest or apoptosis.
Adapted from Qiu Z. et al., 2018. Radiotherapy and Oncology [119]. (License Number 4490720913271).
Alterations in DDR mechanism resulting in both activation and inactivation of the pathway, are found in many of the sporadic cancers [120]. For example, increased autophosphorylation of ATM and CHEK2 are found in early stage tumors [121] representing a barrier to the progression of tumor. Moreover, in late stage breast cancer tumors, hyper activation of ATM is also recorded which implies that it participates in metastasis and tumor progression as well [122]. In addition to these, overexpression of
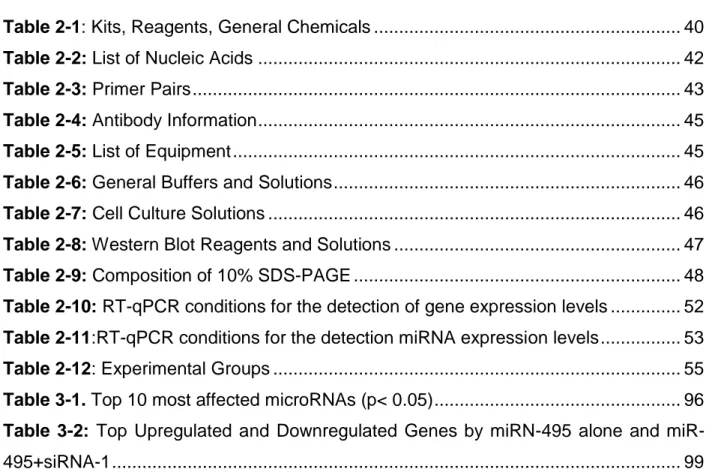


![Figure 1.9: Biogenesis of microRNAs. Adapted from Winter J. et al., 2009. Nature Cell Biology [187]](https://thumb-eu.123doks.com/thumbv2/9libnet/5683908.114440/50.918.254.665.406.801/figure-biogenesis-micrornas-adapted-winter-nature-cell-biology.webp)