ELUCIDATION of SORAFENIB RESISTANCE MECHANISMS
IN HEPATOCELLULAR CARCINOMA
A THESIS SUBMITTED TO
THE GRADUATE SCHOOL OF ENGINEERING AND SCIENCE OF BILKENT UNIVERSITY
IN PARTIAL FULFILLMENT OF THE REQUIREMENTS FOR THE DEGREE OF MASTER OF SCIENCE
IN
MOLECULAR BIOLOGY AND GENETICS
By
Zeynep Boyacıoğlu July, 2018
ii
ELUCIDATION of SORAFENIB RESISTANCE MECHANISMS
IN HEPATOCELLULAR CARCINOMA
By Zeynep Boyacıoğlu July, 2018
We certify that we have read this dissertation and that in our opinion it is fully adequate in scope and quality, as a thesis for the degree of Master of Science.
____________________ Serkan İsmail Göktuna (Advisor)
____________________ Fatima Susanna Faustina Aerts Kaya
____________________ Murat Alper Cevher
Approved for Graduate School of Engineering and Science
___________________ Ezhan Karaşan
iii
Abstract:
Elucidation of Sorafenib Resistance Mechanisms in Hepatocellular Carcinoma
Zeynep Boyacıoğlu
MSc in Molecular Biology and Genetics Advisor: Serkan İsmail Göktuna
July, 2018
Hepatocellular Carcinoma (HCC) is the sixth most common type of cancer and the
second leading cause of cancer-related deaths worldwide. Currently, Sorafenib is the
only approved first-line treatment option for unresectable advanced HCC patients.
Although Sorafenib can be beneficial for some patients, overall survival can only be
extended for 4 months. One of the main reasons is the development of Sorafenib
resistance. Many studies have been conducted to decipher the mechanisms underlying
this drug resistance, yet much more still awaits for elucidation. This study suggests a
novel involvement of a player, an antiviral kinase, which was previously described as
an oncogenic protein. Strikingly in our investigation, Sorafenib resistance seems to be
caused by the loss of this interferon related kinase. This protein expression is ablated
in Sorafenib resistant Hep3B cell line. Loss of this protein by shRNA confers
Sorafenib resistance to naïve Hep3B cells. Reversely, protein rescue can re-sensitize
these resistant cells to Sorafenib. We also report in this work for the first time that this
Sorafenib resistant Hep3B cell line exhibits partial EMT signature. Over all, this study
paves way for further studies investigating the implication of this antiviral protein in
Sorafenib resistance mechanism in HCC.
iv
Özet:
Hepatoselüler Karsinomda Sorafenib Direnç Mekanizmalarının Belirlenmesi Zeynep Boyacıoğlu
Moleküler Biyoloji ve Genetik, Yüksek Lisans Tez Danışmanı: Serkan İsmail Göktuna
Temmuz, 2018
Hepatosellüler Karsinom (HSK) en yaygın altıncı kanser türüdür. Ayrıca, HSK bütün dünyada kanser kökenli ölümler arasında ikinci sırada yer almaktadır. Ameliyat edilemez ileri derece HSK hastaları için onaylanmış tek tedavi seçeneği Sorafenib’dir. Ne var ki, hastalara yarar sağlamasına rağmen Sorafenib yaşam beklentisini yalnızca 4 ay uzatabilmektedir. Bunun başlıca nedenlerinden biri de direnç gelişmesidir. Sorafenib ilaç direncini kırmaya yönelik birçok çalışma olsa açıklanması gereken çok fazladır. Bu çalışmada daha önce bir onkogen olduğu gösterilen bir antiviral kinazın ilişkisi gösterilmiştir. Şaşırtıcı olarak, bizim çalışmamız bu interferon-alakalı kinaz’ın azalmasının Sorafenib direnci ile ilgili olduğunu göstermiştir. Protein ifadesi Sorafenib’e dirençli hücrelerde azalmıştır. Buna ek olarak, saf Hep3B hücrelerinden shRNA yardımı ile bu gen silindiğinde bu hücreler ilaca direnç göstermiştir. Ayrıca, dirençli hücrelerde antiviral kinaz kurtarıldığında ilaca duyarlı hale geldikleri görülmüştür. Ayrıca, bu çalışmada ilk defa Sorafenib’e dirençli hücrelerde kısmi EMT olduğu gösterilmiştir. Sonuç olarak, bu çalışma bu antiviral protein’in Sorafenib direncine etkisini incelemek için yol açacaktır.
Anahtar kelimeler: Hepatoselüler karsinom, sorafenib direnci, Hep3B, onkogenik antiviral proteinler
v
Acknowledgements:
I would like to thank my advisor Assist. Prof. Serkan İsmail Göktuna for giving me the opportunity to work in his lab, for believing in me and for always sharing his
invaluable experiences with me throughout my Master’s study.
I would like to thank deeply Dr. Tieu Lan Chau for the endless support that she gave
in the past two years. She has taught me for much, both including experimental
procedures and the field of science itself and I cannot thank her enough.
I would like to thank all the past and present members of Göktuna Lab for their support and help anytime I needed but most importantly for their friendship, dear
İlayda Baydemir, Elif Tuğçe Karasu, Erta Xhafa, Uğur Kahya.
I would like to thank my family and friends who have been so patient with me during
my Master’s study; for being so understanding of why I was always late to everywhere, because I was in the lab, and for giving me more support than I could
even ask for.
Lastly, I would like to thank Scientific and Technological Research Council of
Turkey (TÜBİTAK) for funding my Master’s studies. This thesis was supported by the grant number 116Z349.
vi
Teşekkürler:
Tez danışmanım Sayın Yar. Doç. Serkan İsmail Göktuna’ya bana laboratuvarında çalışma fırsatını verdiği, bana her zaman inandığı ve yüksek lisans eğitimim boyunca paha biçilemez tecrübelerini benimle paylaştığı için teşekkür ederim.
Dr. Tieu Lan Chau’ya bu iki yıldaki sonsuz desteği çok teşekkür ederim. Bana hem deney teknikleri hem de bilim dünyası dahil birçok şey öğrettiği için ona ne kadar teşekkür etsem azdır.
Göktuna Lab’ın geçmiş ve şimdiki bütün üyelerine destekleri, yardımları ve özellikle arkadaşlıkları için çok teşekkür ederim, sevgili İlayda Baydemir, Elif Tuğçe Karasu,
Erta Xhafa, Uğur Kahya.
Ailem ve arkadaşlarıma yüksek lisans eğitimim boyunca bana karşı sabırlı oldukları,
her yere geç kaldığımda anlayışları ve tahmin edebileceğimden çok fazla destekledikleri için teşekkür ederim.
Son olarak da Türkiye Bilimsel ve Teknolojik Araştırma Kurumu’na (TÜBİTAK) yüksek lisans eğitimimi destekledikleri için teşekkür ederim. Bu tez 116Z349 numaralı TÜBİTAK projesiyle desteklenmiştir.
vii
Contents:
Abstract: ... iii Özet: ... iv Acknowledgements:... v Contents: ... vii List of Figures: ... ix List of Tables: ... x 1 INTRODUCTION: ... 1 1.1 HEPATOCELLULAR CARCINOMA (HCC): ... 11.1.1 Incidence and cause of HCC ... 1
1.1.2 Current therapeutic treatments of HCC: ... 3
1.2 EPITHELIAL-MESENCHYMAL TRANSITION (EMT): ... 8
1.2.1 EMT and drug resistance: ... 9
1.2.2 Partial EMT: ... 9
1.3 IKBKE GENE: ... 10
1.3.1 NF-κB signaling pathway: ...10
1.4 Aim of the study: ... 11
2 Materials and Methods: ... 12
2.1 Materials: ... 12
2.1.1 Chemicals and reagents:...12
2.1.2 Cell culture media: ...12
2.1.3 Kits: ...13
2.1.4 Consumables: ...13
2.1.5 Buffers:...14
2.1.6 List of Antibodies: ...16
2.1.7 Sequences of primers: ...16
2.1.8 IKBKE overexpression plasmids: ...17
2.2 METHODS: ... 18
2.2.1 CELL CULTURE: ...18
2.2.2 Cell based Assays: ...24
2.2.3 Protein-based assays: ...25
2.2.4 RNA-based assays: ...29
2.2.5 Statistical Analysis: ...31
3 RESULTS: ... 32
3.1 Creation of Sorafenib resistant Hep3B cell line (SorRHep3B) line ... 32
3.1.1 Determination of Sorafenib IC50 of naïve Hep3B cells: ...32
3.1.2 Generation of SorRHep3B cell lines: ...33
3.1.3 Morphological differences of SorRHep3B Cells compared to Control cells: ...34
3.1.4 IC50 of SorRHep3B cell lines: ...35
3.2 Characterization of SorRHep3B cell lines: ... 37
3.2.1 Protein and mRNA expression is different between SorRHep3B and DMSO cells: 37 3.2.2 Assessment of proliferation of SorRHep3B cell line by Real Time Cell Analysis: 39 3.2.3 SorRHep3B cells have survival advantage when treated with poly(I:C): ...40
viii
3.2.4 SorRHep3B cells show increased survival upon TGF-β treatment: ...41
3.2.5 IKBKE rescue resensitizes SorRHep3B cells to Sorafenib: ...42
3.3 Hep3B cells with IKK loss of function show some similar phenotypes to SorHep3B cells ... 43
3.3.1 IKBKE depletion confers Sorafenib resistance to naïveHep3B ...43
3.4 IKBKE inhibition on naïve Hep3B cells also render them more resistant to Sorafenib: ... 45
3.4.1 Amlexanox: ...45
3.4.2 IKBKE-depleted cells are proliferating more than the control cells:...46
3.4.3 IKBKE rescue in depleted Hep3B re-sensitizes them to Sorafenib again: ...47
As the IKBKE-depleted cells appear to be resistant to Sorafenib, it is expected that IKBKE rescue might re-sensitize the cells to Sorafenib. To test this, naïveHep3B cells with IKBKE depletion were seeded to 96 well plate transfected with IKKε plasmid and treated with 4μM Sorafenib. On the contrary to expectation, a significant difference was not seen between IKBKE rescue and the empty vector control, however, a trend can be seen (Figure 3.16). ...47
4 Discussion:... 49
4.1 IKKε involvement in Sorafenib resistance of Hep3B cell line: ... 49
4.1.1 Loss of IKKε is associated with increase resistance of Hep3B to Sorafenib as reflected by IC50 value and Caspase 3/7 activity: ...50
4.1.2 IKK rescue resensitizes IKKε deficient Hep3B cells to Sorafenib: ...51
4.1.3 Loss of IKKε is associated with increased cell growth as seen both in SorHep3B and IKKε depleted Hep3B. ...52
4.1.4 Loss of IKKε protects Hep3B against apoptosis by TGF-β or cell insult such as poly(I:C) as seen in SorHep3B cells...53
4.2 SorHep3B exhibits partial EMT features. ... 53
5 Conclusion and Future Perspectives: ... 55
6 APPENDIX: ... 57
ix
List of Figures:
Figure 1.1: Estimated cancer cases worldwide ... 1
Figure 1.2: Estimated number of cancer-related deaths ... 2
Figure 1.3: NF-κB pathway. ... 11
Figure 2.1: The sandwich for Western Blot transfer. ... 28
Figure3.1: IC50 of naïve Hep3B cell line ... 32
Figure 3.2: Schematic description of SorRHep3B creation ... 34
Figure 3.3: SorRHep3B cells are morphologically different than DMSO cells. ... 35
Figure 3.4: IC50 of SorRHep3B cells ... 36
Figure 3.5: IC50 of SorRHep3B cells are higher than that of control cells in 48 hr ... 36
Figure 3.6: Protein expression is different DMSO cells and SorRHep3B cells. ... 38
Figure 3.7: mRNA level expression is different DMSO and SorRHep3B cells. ... 39
Figure 3.8: SorRHep3B cells are proliferating more than the control cells ... 40
Figure 3.9: SorRHep3B cells show survival advantage upon poly(I:C) treatment ... 41
Figure 3.10: SorRHep3B cells have increased survival upon TGF-β treatment... 42
Figure 3.11: IKBKE rescue re-sensitizes SorRHep3B cells to Sorafenib ... 43
Figure 3.12: Depletion of IKBKE with shRNA increases resistance of Hep3B cells to Sorafenib. ... 44
Figure 3.13: IKBKE depleted cells do not go through apoptosis upon Sorafenib treatment. ... 45
Figure 3.14: Amlexanox decreases naïve Hep3B sensitivity to Sorafenib. ... 46
Figure 3.15 IKBKE-depleted cells are proliferating more than the control cells. ... 47
Figure 3.16: IKBKE rescue on shRNA-IKBKE depleted naïve cells ... 48 Supplemented Figure 1: Different cell lines have different basal IKBKE expression.57
x
List of Tables:
Table 1: PCR setting for mycoplasm testing. ... 20
Table 2: Transfection settings of shRNA against IKBKE. ... 23
Table 3: Preparation of protein quantification standards. ... 27
Table 4: Reaction mixture for cDNA generation ... 29
Table 5: Conditions for cDNA generation. ... 30
1
1 INTRODUCTION
:
1.1 HEPATOCELLULAR CARCINOMA (HCC):
1.1.1 Incidence and cause of HCC
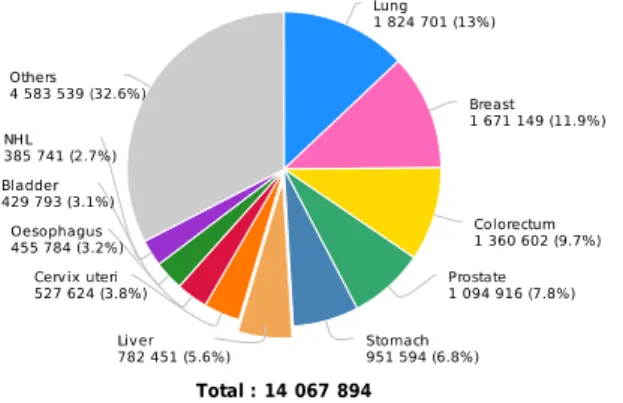
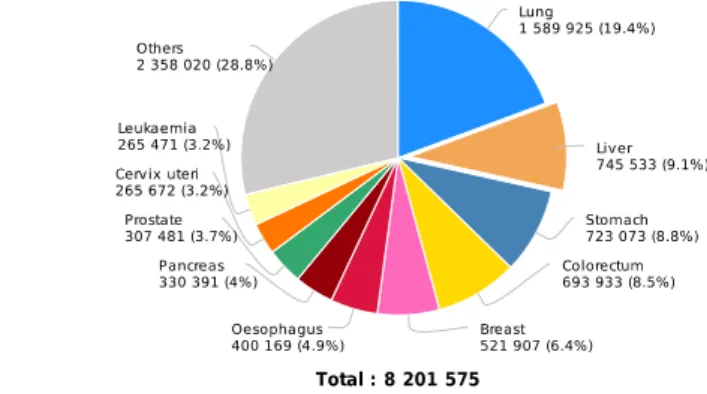
Cancer is a disease that affects the majority of the world’s population. Among all the
cancers, liver cancer is the sixth most common cancer type and the second leading
cause of cancer-related deaths (Figure 1.1 and Figure 1.2) [1,2].
Figure 1.1: Estimated cancer cases worldwide, divided according to the cancer type. Graph taken from Ref 2.
2 Figure 1.2: Estimated number of cancer-related deaths, divided according to cancer. Graph taken from Ref 2.
Hepatocellular Carcinoma (HCC) constitutes almost 90% of all primary liver
malignancies. Main risk factors of HCC are: Hepatitis Virus B (HBV) and Hepatitis
virus C (HCV) infections, cirrhosis, excessive alcohol use, Non-Alcoholic Fatty Liver
Disease (NAFLD), metabolic syndrome, Aflatoxin B inhalation/consumption and
smoking in considered [3]. In addition, diabetes and obesity are independent factors
and mortality is five times higher in patients with higher body mass index than in
patients with lower body mass index [4].
HCC development is a multi-step process. First, low-grade dysplastic pre-cancerous
cirrhotic nodules (LGDNs) are formed and these LGDNs convert into high-grade
dysplastic nodules (HGDNs). HGDNs are considered to have potential of being early
stage HCC (Stages 0 and A) and develop to become intermediate or advanced HCC
(Stages B and C) [3]. Underlying mechanism of HCC involves many mutations and
alterations in many signaling pathways that control cell proliferation, angiogenesis,
WNT-3 β Catenin signaling pathway, RAS/RAF/MAPK pathway, PI3K/AKT/mTOR pathway and oxidative stress pathway are significant.
1.1.2 Current therapeutic treatments of HCC:
HCC is resistant to treatment with chemotherapy and radiotherapy [5]. Hence, liver
transplantation is the best option for HCC patients since it enables complete treatment
of both HCC and the underlying liver condition. Unfortunately, only a very small
portion of the HCC patients is qualified for transplantation since the criteria for
eligibility is very strict. Milan criteria suggest that only patients with a single tumor
with diameter less than 5 cm or patients with at most 3 tumors with diameters less
than 3 cm are candidates for liver transplantation [6]. More inclusive criteria have
been proposed from a group in University of California, San Francisco (UCSF).
According to UCSF criteria, patients with single tumor that is less than 6.5cm or
patients with at most 3 nodules with less than 4.5cm and the total tumor diameter less
than 8cm are eligible for liver transplantation [6]. Furthermore, for patients at very
early or early stages of the disease, surgical resection of the tumor might be a
treatment option. These patients can be selected upon their tumors; isolated tumors
with persevered liver function [10]. Nevertheless, HCC at early stages is
asymptomatic hence generally can only be diagnosed at later stages [7]. This reduces
the number of patients than can benefit from liver transplantation. For these patients
there are other surgical treatment options that are minimally invasive. First,
Transarterial Chemoembolization (TACE) is an option for intermediate stage HCC
patients. In this treatment, the blood supply to the tumor is inhibited to selectively
target HCC cells. TACE can also be combined with Sorafenib. There are several
4 patients when compared to TACE alone. [8,9]. Another treatment option is
Radiofrequency Ablation (RFA), in which rapid electromagnetic pulses are used to
ablate the tumor size. RFA can be a beneficial treatment option to reduce the size of
the tumor and hinder the progression until the patient becomes a candidate for liver
transplantation [10]. For patients who are not qualified for surgery, Percutaneous
Ethanol Injection Therapy (PEIT) is the most common treatment option. This
treatment relies on the cytotoxicity of ethanol [10].
Apart from surgical treatment, there are some medical treatments available for HCC
patients. For example, Oncolytic Virus Treatment takes advantage of genetically
engineered viruses to kill the tumors cells. This therapy option utilizes the fact that the
viruses should infect the tumor cells and the patients’ own immune system to
eliminate the tumor cells. Last but not least, the immunotherapy is considered as a
crucial treatment option in which antibodies against apoptosis inhibitors are given to
the patients. [10]. The study by El-Khoueiry et al showed that the antibody against
5
1.1.2.1 Systemic treatment of advanced HCC:
Sorafenib is an oral multi-kinase inhibitor that blocks proliferation and angiogenesis
of tumor cells. It exerts its anti-proliferative effects by inhibiting kinases such as Ras
and Raf in the Ras/Raf/MEK/ERK signaling pathway. On the other hand, it exerts its
anti-angiogenetic effects by inhibiting kinases such as c-KIT, FLT-3, VEGFR,
PDGFR. Sorafenib also has cytotoxic effects that are believed to play an important
role as an anti-tumor agent [12,13]. There are two large-scale, double-blind,
placebo-controlled, phase III clinical trials conducted to assess the efficacy and the safety of
Sorafenib in patients with advanced HCC. The first trial was the Sorafenib
Hepatocellular Carcinoma Assessment Protocol (SHARP) that showed that the overall
survival (OS) of patients treated with Sorafenib is longer than patients treated with
placebo (10.7 months and 7.9 months, respectively). In addition, Sorafenib also
prolonged median time to progression (TTP) (5.5 months in Sorafenib arm compared
to 2.8 months in placebo arm) and the disease control rate (DCR) was also higher in
patients that received Sorafenib (43%) when compared to patients who received
placebo (32%) [14]. These results were confirmed in another phase III, double-blind,
placebo-controlled clinical trial that was conducted in the Asia-Pacific region (with
OS of 6.5 months in Sorafenib arm and 4.2 months in placebo arm) [15]. The
drug-related adverse events in both of the trials were similar, with the most common ones
being diarrhea, hand-foot skin reaction, fatigue and anorexia [14,15]. Although there
is a big difference in the OS of two different trials that might be explained due the
different geographical origins of the patients; in the SHARP trial, the patients are
from Western origins and the patients from the AP trial are from Asian origin. This
brings upon different etiologies of HCC in different regions. For instance, the
6 trial (73% and 12% respectively). On the other hand, 30% of the patients in SHARP
trial had HCV infection while only 8.4% of the patients enrolled in Asia-Pacific trial
were infected with HCV [14,15]. It is shown that patients with HBV infection have
worse prognosis than patients with HCV infection [16]. Upon these findings,
Sorafenib has been approved by the United States Food and Drug Administration
(FDA) in 2010 as the first-line treatment option for patients with advanced HCC
unresectable tumors.
Although Sorafenib is the only drug that is approved for the treatment of advanced
HCC, it can only increase overall survival by up to 4 months. Thus, other drugs have
been investigated to replace Sorafenib (such as Sunitinib, Brivanib, Linifenib and
Lenvatinib). However, none of these candidates have proven to the superior over
Sorafenib [17].
1.1.2.2 Sorafenib resistance:
Resistance against chemotherapeutic agents is commonly seen in cancer. Drug
resistance can be divided into two: intrinsic resistance and acquired resistance.
Intrinsic resistance is when a patient does not respond to the drug hence they can
never have any benefit from drug use. On the other hand, acquired resistance happens
when a patient stops responding to a drug after a period of benefit [13].
As mentioned above, Sorafenib can only increase the OS of patients by 4 months and
one primary reason for this the development of resistance. There are several proposed
7 pathway plays a role in cell apoptosis and over-phosphorylation of AKT is seen in
resistance against Sorafenib. Inhibition of AKT results in resensitization of HCC cells
against Sorafenib [12, 18]. Second, autophagy is a cell’s self-protection mechanism that enables cells to survive in unfavorable conditions. However, this may promote
tumor growth since it induces cell survival [19].
Furthermore, Sorafenib is an anti-angiogenic drug. These drugs might change the
tumor microenvironment; causing the blood vessels to contract and blood flow to the
tumor is decreased. However, this causes the selection of colonies in the solid tumor
that can survive under hypoxic conditions and these cells are generally more resistant
to chemotherapy [19]. Last but not least, Epithelial To Mesenchymal Transition
(EMT) also plays a role in Sorafenib resistance. Two recent studies by Fischer et al
and Zheng at al showed that targeting EMT resulted in reduced survival of cancer
cells and reduced tumor sizes [20-22].
1.1.2.3 Treatment after Sorafenib resistance:
As mentioned earlier, patients develop resistance against Sorafenib quickly and hence
a second-line treatment to be used after progression on Sorafenib was in urgent need.
To this extend, several drugs have been tested in several clinical trials but
unfortunately were not successful. For example, Brivanib, Everolimus, Ramucirumab
and Tivatinib were among the agents investigated as treatment after progression on
Sorafenib [16]. Only one multi-kinase inhibitor, Regorafenib, could show superiority
to placebo in clinical trials. In the RESOURCE Trial, Regorafenib lead to an increase
8 [16,23]. In addition, Nivolumab, a monoclonal antibody against Programmed death-1
(PD-1), also received a fast FDA approval after showing promising results in phase
I/II CheckMate 040 clinical trial [23].
1.2 EPITHELIAL-MESENCHYMAL TRANSITION (EMT):
Epithelial-to-mesenchymal transition (EMT) is a reversible multi-step progress in
which the cell-cell adhesion molecules are lost and the cells gain a more migratory
phenotype [24]. Furthermore, the cell polarity is lost and the cells are de-differentiated
from epithelial to mesenchymal. EMT is a process that is seen during embryonic
development, wound healing and tumor metastasis [25]. There are several signaling
pathways that play critical roles in EMT and those pathways are generally also shown
to be a part of carcinogenesis [26]. First of all, TGF-β signaling is one of the most
important inducers EMT. Although TGF-β suppresses proliferation in cells, once this
early effect is overcome, TGF-β acts as an inducer of EMT and contributes to cancer
cell migration. Clinically, higher expression of TGF-β late response genes is
associated with more metastatic tumors [27].
Snail is a transcription factor that downregulates the expression of epithelial markers,
especially E-Cadherin [28]. Snail expression is induced by the Notch signaling
pathway [27]. In addition, NF-κB signaling can also induce Snail and cause EMT
through TNFα [28]. Hence, TNFα can be considered as another important inducer of EMT.
9 1.2.1 EMT and drug resistance:
Other than being involved in metastasis, EMT is recently shown to play a role in
chemoresistance [20, 21, 29]. Zhang et al. showed that EMT is regulated by several
other pathways such as PI3K/AKT, MAPK and Ras/ERK pathways that are required
for the maintenance of the mesenchymal state [29]. As mentioned above,
upregulation of the PI3K/AKT pathway is associated with Sorafenib resistance.
Zhang et al. proved that hyperactive PI3K/AKT signaling pathway is responsible for
EMT in HCC [29].
1.2.2 Partial EMT:
EMT is seen in many aspects of embryogenesis, as well as wound healing and tumor
progression. However, the EMT process is not always complete during metastasis. In
fact, cells that have both epithelial and mesenchymal properties can be observed. This
dual property confers them to a more advantages while leaving the bloodstream [42].
In addition, there are studies that show that the tumors that possess both epithelial and
mesenchymal properties are more invasive. Recently, Yamashita et al showed that the
breast cancer samples that express both E-Cadherin and Vimentin are also more
10
1.3 IKBKE GENE:
Inhibitor of Nuclear Factor Kappa-b kinase epsilon (IKKε) protein is expressed from
the IKBKE gene in the q arm of Chromosome 1 [30]. It has been shown to play
important roles in inflammation, cell survival, cell proliferation and cell growth
through the IRF3/7 and NF-κB pathways [31,32]. In addition, IKBKE is also shown
to have roles in carcinogenesis in many malignancies. Not only IKBKE is
overexpressed in some cancers, high expression of IKBKE is also associated with
drug resistance [32]. Last but not least, IKBKE induces cell proliferation and cell
growth [32].
The IKBKE gene has been shown to act as an oncogene in many cancers such as
breast cancer, glioma, prostate cancer and ovarian cancer. In addition, IKBKE is also
associated with cisplatin resistance in ovarian cancer and tamoxifen resistance [32,
38].
Upon inflammation, IKBKE is activated and IKBKE subsequently activates IRF3/7
and STAT1 [32]. In addition, upon TLR3 activation (by ligand such as dsRNA), the
IKBKE activates both IRF-3 and NF-κB, which results in the induction of IFN-β [45].
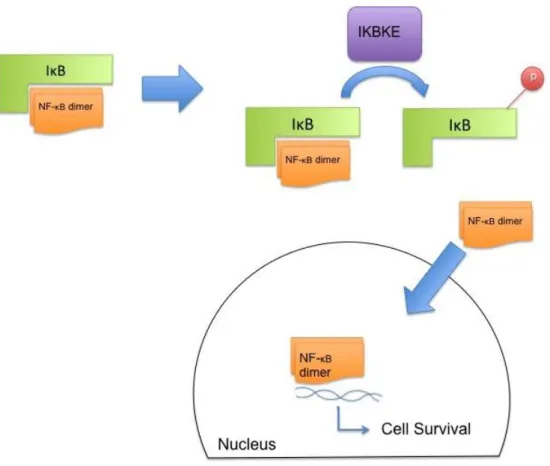
1.3.1 NF-κB signaling pathway:
NF-κB is a transcription factor that regulates many genes involved in inflammation,
immunity, cell proliferation, differentiation, survival, DNA damage and cell cycle
regulation [33]. As NF-κB is involved in cell survival and targets anti-apoptotic
11 Inhibitor of κB (IκB), which blocks its nuclear localization signal and sequesters NF-κB in the cytosol [34]. Upon induction, IKBKE phosphorylates INF-κB, causing its degradation and subsequent release and nuclear translocation of NF-kB. This leads to
the expression of target genes regulating many cellular processes like cell survival
(Figure 1.3).
Figure 1.3: NF-κB pathway. Pathway adapted from Ref 33.
1.4 Aim of the study:
This study aims to understand the resistance mechanisms of Sorafenib in HCC cells.
To this extend, naïve Hep3B cells were continuously treated with Sorafenib for 8 months to generate Sorafenib-resistant SorRHep3B cells. These cells were
characterized and IKBKE-dependent resistant mechanism was investigated. In
addition, the effects of IKBKE depletion and inhibition on Sorafenib response were
12
2 Materials and Methods:
2.1 Materials:
2.1.1 Chemicals and reagents:
Product Name: Catalog No: Company, Country
PageRuler Prestained Protein L SG-2661 Themo Fisher Scientific, USA
40% Acrylamide/Bis Solution, 37.5:1 1610148 Bio-Rad,USA
Hiperfect Transfection Reagent 301705 Qiagen, Germany
GIPZ LentiviralAL shRNA transduction starter kit
IKBKE RHS5086
Dharmacon/GE Healthcare, UK
cOmplete Protease Inhibitor Cocktail 11697498001 Roche, USA
Bovine Serum Albumin (BSA) sc-2323
Santa Cruz Biotechnology, USA
Glycine GLN001.1 Bioshop Canada, Canada
polyFect 1015586 Qiagen, Germany
Ammonyum persulphate A2941 Applichem, USA
Calcium chloride C3306 Sigma Aldrich, USA
EDTA E-5134 Sigma Aldrich, USA
Ethanol 32221 Sigma Aldrich, USA
Glycerol 15524 Sigma Aldrich, USA
Hydrochloric acid 100317 Merck, USA
2-Propanol 100995 Merck, USA
2- Mercaptoethanol 805740 Merck, USA
di Sodyum hydrogen phosphate dihydrate 1.06580. Merck, USA
Sodyum dodecyl sulfate 822050 Merck, USA
Tween 777 Ambresco/VWR, USA
Tris hydrochloride 234 Ambresco, USA
Trizma Base T1503 Sigma Aldrich, USA
2.1.2 Cell culture media:
Product Name: Catalog No: Company, Country
DMEM BE12-707F Lonza, Switzerland
DMEM 31885023 Gibco, USA
optiMEM 31985070 Gibco, USA
Pensicin/Streptomycin DE17-602E Lonza, Switzerland
L-Glutamine BE17-605E Lonza, Switzerland
DPBS BE17-512F Lonza, Switzerland
Trypsin-EDTA BE17-161E Lonza, Switzerland
Trypsin-EDTA 25200056 Gibco, USA
Fetal Bovine Serum
(FBS) S181H-500 Biowest, France
13
Geneticin (G418) 10131-027 Gibco, USA
Puromycin ant-pr-1 Invitrogen, USA
Sorafenib S7397-200MG Selleckchem, USA
Amlexanox A2401
Tokyo Chemical Industry, Japan
DMSO 67-68-5 Applichem, USA
2.1.3 Kits:
Product Name:
Catalog
No: Company, Country
iScript cDNA Synthesis Kit 1708891 Bio-Rad, USA
SYBR® Premix Ex Taq™ II (Tli RNase H Plus) RR820W Takara Bio, Japan
Pierce BCA Protein Assay kit LSG-23227
Thermo Fisher Scientific, USA
Pierce ECL western blotting substrate LSG-32106
Thermo Fisher Scientific, USA
SuperSignal West Femto Maximum Sensitivity
Substrate 34094
Thermo Fisher Scientific, USA
CellTiter-Glo® Luminescent Cell Viability Assay G7570 Promega,USA
Caspase-Glo® 3/7 Assay G8091 Promega,USA
E.Z.N.A. Total RNA Kit I R6834-02 Omega Bio-Tek, USA
2.1.4 Consumables:
Product Name: Catalog No: Company, Country
5mL serological pipets 4487 Corning, USA
10mL serological pipets 4488 Corning, USA
25mL serological pipets 4489 Corning, USA
1000uL filter tips 740288
Greiner-BİoOne, Germany
200uL filter tips 739288
Greiner-BİoOne, Germany
20uL filter tips 774288
Greiner-BİoOne, Germany
10uL filter tips F161630
Greiner-BİoOne, Germany
Loading tips 14-222-809 Axygen, USA
1000uL tips 551146 LP Italiana SP, Italy
200uL tips 4845 Corning, USA
10uL tips F161630 Gilson, USA
1.5mL SafeLock Tubes 30120086 Eppendorf, Germany
1.5mL Reaction Tubes 3621 Corning, USA
14
15mL Falcons 62.554.502-500 Sarstedt, Germany
50mL Falcon 62.547.254-300 Sarstedt, Germany
Non-sterile 96-well plates 3655101
Greiner-BİoOne, Germany
LightCycler 480 Multiwell 96 472969201 Roche, Switzerland
RTCA CIM plates 566581701 Acea BioSciences, USA
RTCA E-Plate 546983001 Acea BioSciences, USA
96-well plates 655180 Greiner-BİoOne, Germany 12-well plates 665180 Greiner-BİoOne, Germany 6-well plates 657160 Greiner-BİoOne, Germany
145mm tissue culture dish 639160
Greiner-BİoOne, Germany
100mm tissue culture dish 664160
Greiner-BİoOne, Germany
60mm tissue culture dish 628160
Greiner-BİoOne, Germany
35mm tissue culture dish 627160
Greiner-BİoOne, Germany
175cm tissue cultre flask 660175 Corning, USA
75cm tissue culture flask 658175 Corning, USA
25cm tissue culture flask 690175 Corning, USA
Cryovials 121263
Greiner-BİoOne, Germany
Immobilion-P PVDF
Membrane 1620177 Millipore, USA
Whatman Paper 732-4093 Whatman, UK
2.1.5 Buffers: Buffer: Composition: 10X Running Buffer 144g Glycine, 10 gr SDS, 30.2g Tris-Base up to 1L water 10X Transfer Buffer 144g Glycine, 30.2g Tris-Base up to 1L water 10X TBS-T 24.2g Tris-Base, 80g NaCl set pH=7.6 20mL Tween, up to 1L water
15 Stacking Gel
0.6mL Bis-Acrylamide, 3.5mL water
625uL 1M Tris pH=6.8, 125uL 0.25M EDTA, 100uL 10%SDS
60uL 1*% APS, 10uL TEMED
8% Separating Gel
3.2mL Bis-Acrylamide, 5.8mL water,
1.5mL Glycerol, 3.75mL 1.5M Tris pH=8.8
375uL 0.25M EDTA, 300uL 10% SDS
125uL 10% APS, 15uL TEMED 2X HBSS 10mL 1M Hepes, 666uL 3M KCl, 0.4g Dextrose, 11.2mL 5M NaCl, 0.0531g Na2HPO4, up to 200mL water ph=7.01 50X TAE Buufer 242g Tris-Base, 57.1mL Acetic Acid 100mL 0.5M EDTA, up to 1L water
2X Cell Lysis Buffer Stock 25mL 1M Hepes, 30mL 5M NaCl, 5mL Triton-X-100, 100mL Glycerol 340mL water
1X Cell Lysis Buffer
5mL 2X cell lysis buffer stock,
500uL Na3VO4, 500uL NaF, 500uL b-Glycerophosphate, 500uL cOmplete protease inhibitor up tp 10mL water 1X PBS 1.702g Na2HPO4, 8g NaCl, 0.2g KCl, 0.2g KH2PO4, up to 1L water
Mild Stripping Buffer
3g Glycine, 0.2g SDS, 20mL Tween, up to 200mL water,
16 2.1.6 List of Antibodies:
Product Name:
Catalog
No: Company, Country
(human) IKKε D20G4 2905S Cell Signaling Technoloy, USA
pIKKε (S172) D1B7 8766S Cell Signaling Technoloy, USA
TBK1/NAK 3031S Cell Signaling Technoloy, USA
pTBK1 (S172) D52C2 5483S Cell Signaling Technoloy, USA
pERK1/2 Thr202 pP44/42 Tyr204 4370S Cell Signaling Technoloy, USA
pAKT S473 D9E 4060S Cell Signaling Technoloy, USA
Vimentin D21H3 5741S Cell Signaling Technoloy, USA
ZO-1 (D6L1E) 13663S Cell Signaling Technoloy, USA
N-cadherin 13A9 14215S Cell Signaling Technoloy, USA
α-tubulin T5168 Sigma-Aldrich,USA
Cleaved Caspase 3 (Asp175)
5A1E 9664S Cell Signaling Technoloy, USA
ERK 1 Antibody (G-8) sc-271269
Santa Cruz Biotechnology, USA
IKK-i Antibody (A-11) sc-376114
Santa Cruz Biotechnology, USA
E-cadherin Antibody (G-10) sc-8426
Santa Cruz Biotechnology, USA
TANK Antibody (D-2) sc-166643
Santa Cruz Biotechnology, USA
Twist Antibody (Twist2C1a) sc-81417
Santa Cruz Biotechnology, USA
αMouse 7076S Cell Signaling Technoloy, USA
αRabbit 7074S Cell Signaling Technoloy, USA
2.1.7 Sequences of primers:
Primer Name SEQUENCE (5' --> 3')
h_IKBKE _Fw TGCGTGCAGAAGTATCAAGC h_IKBKE Rev TACAGGCAGCCACAGAACAG h_TBK1 _Fw GTGGTGGGTGGAATGAATCAT h_TBK1 Rev ATCACGGTGCACTATACCATTCTC h_CDH1_Fw CCCGGGACAACGTTTATTAC h_CDH1_Rev GCTGGCTCAAGTCAAAGTCC h_KRT18_Fw TGATGACACCAATATCACACGA h_KRT18_Rev GGCTTGTAGGCCTTTTACTTCC h_ZO1_Fw CAGAGCCTTCTGATCATTCCA h_ZO1_Rev CATCTCTACTCCGGAGACTGC h_CDH2_Fw ACAGTGGCCACCTACAAAGG h_CDH2_Rev CCGAGATGGGGTTGATAATG h_ZEB1_Fw GGGAGGAGCAGTGAAAGAGA
17 h_ZEB1_Rev TTTCTTGCCCTTCCTTTCTG h_ZEB2_Fw AAGCCAGGGACAGATCAGC h_ZEB2_Rev CCACACTCTGTGCATTTGAACT h_FN_Fw CTGGCCGAAAATACATTGTAAA h_FN_Rev CCACAGTCGGGTCAGGAG h_SNAI2_Fw TGGTTGCTTCAAGGACACAT h_SNAI2_Rev GTTGCAGTGAGGGCAAGAA h_MMP9_Fw GAACCAATCTCACCGACAGG h_MMP9_Rev GCCACCCGAGTGTAACCATA h_GAPDH_Fw GCCCAATACGACCAAATCC h_GAPDH_Rev AGCCACATCGCTCAGACAC h_EPCAM _Fw CGCAGCTCAGGAAGAATGTG h_EPCAM_Rev TGAAGTACACTGGCATTGACG h_Claudin7 _Fw CCACTCGAGCCCTAATGGTG h_Claudin7_Rev GGTACCCAGCCTTGCTCTCA h_KRT19 _Fw CTTCCGAACCAAGTTTGAGAC h_KRT19_Rev GAATCCACCTCCACACTGAC h_Vimentin _Fw GGTGGACCAGCTAACCAACGA h_Vimentin_Rev TCAAGGTCAAGACGTGCCAGA
2.1.8 IKBKE overexpression plasmids:
18
2.2 METHODS:
2.2.1 CELL CULTURE:
2.2.1.1 Cell line and the maintenance:
Hep3B cells were maintained in DMEM growth medium supplemented with 5% Fetal
Bovine Serum (FBS), 1% Penicillin/Streptomycin and 1% L-Glutamine. Medium was
changed regularly every 2-3 days and cells were passaged when they reached 80-90%
confluency with a subcultivation ratio of at least ¼, to keep them healthy.
2.2.1.2 Cryopreservation of cells:
Culture medium was discarded and cells were washed carefully with PBS. After a few
minutes upon adding Trypsin/EDTA to cells, watch under the microscope when cells
start to dissociate from each other, then remove Trypsin before cells detach from the
dish. Fresh medium was added to collect cells, followed by 5 minutes centrifugation
at 1500rpm. Supernatant was discarded and the cell pellet was resuspended in growth
medium supplied with 5% DMSO. Cryovials of cells were placed into the Mr. Frosty
Cell Freezing Container and put directly to -80oC. Cells were kept at -80oC for
19
2.2.1.3 Thawing cells:
Cryovial of cells was thawed in the water bath until there is an ice ball remaining
inside. Fresh growth medium was added in the vial drop-by-drop to reduce shock to
cells due to temperature change. Next, cells were collected into a 15mL falcon and
centrifuged at 1000 rpm for 3-5 minutes. Supernatant was discarded; cell pellet was
resuspended in fresh growth medium and transferred into a clean cell culture dish.
Gently shake the dish up-down-around for equal distribution and placed it at 37oC
5%CO2 in the cell incubator.
2.2.1.4 Enzyme-based Mycoplasm test:
1mL supernatant was taken from the cell medium. Cell debris was removed by
spinning at 13000 rpm for 5 minutes. 100μL of the clear medium was placed into 1
well of an opaque 96 well plate, added with 100μL reactant from the “Luminescence Mycoplasm Kit”. Following an incubation at room temperature for 5 minute, the luminescence was read and recorded as “Read A”. 100μL Substrate from the same kit
was added into the well, incubated at room temperature for 10 minutes. Luminescence
was recorded as “Read B”.
𝑅𝑒𝑎𝑑 𝐴 𝑅𝑒𝑎𝑑 𝐵 {
< 0.9 → 𝑛𝑜 𝑚𝑦𝑐𝑜𝑝𝑙𝑎𝑠𝑚
= 0.9 − 1.1 → 𝑚𝑒𝑎𝑠𝑢𝑟𝑒 𝑎𝑔𝑎𝑖𝑛 2 − 4 ℎ𝑜𝑢𝑟𝑠 𝑙𝑎𝑡𝑒𝑟 > 1.2 → 𝑚𝑦𝑐𝑜𝑝𝑙𝑎𝑠𝑚 𝑝𝑜𝑠𝑖𝑡𝑖𝑣𝑒
20
2.2.1.5 PCR-based mycoplasma test:
100μL medium was taken from a confluent cell plate, then boiled for 5 minutes at
95oC. PCR reaction mixture was prepared as follows for each condition: 24.5μL
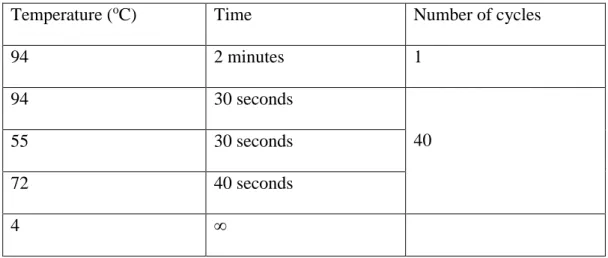
Rehydration Buffer (supplied in the kit) + 0.5μL JumpStart Taq Polymerase enzyme. For positive control, 25μL of the reaction mixture was used; for negative control: 23μL reaction mixture + 2μL nuclease free water; for samples to be checked: 23μL reaction buffer + 2μL boiled medium. After sitting at room temperature for 5 minutes, reaction tubes were placed in thermal cycler for Polymerase Chain Reaction with the
program shown inTable 1.
Table 1: the conditions for PCR for mycoplasm testing.
Temperature (oC) Time Number of cycles
94 2 minutes 1 94 30 seconds 40 55 30 seconds 72 40 seconds 4 ∞
The results were evaluated by running the reaction on 1.5% Agarose gel (with
21
2.2.1.6 Development of SorRHep3B cells:
First, the IC50 of Sorafenib of naïve Hep3B cells was determined using Cell Titer Glo
assay (described below). Next, Sorafenib resistant Hep3B cells were generated by
continuous exposure to gradually increasing concentrations of Sorafenib. Sorafenib
concentration was started just below the IC50 (2μM), then increased by either 0.25M
or 0.5M every three passages. The cells are considered to be resistant after their IC50
is increased sufficiently. The cells were cultured in normal medium supplemented
with Sorafenib. To perform experiments, resistant cells were first passaged without
Sorafenib and maintained in drug-free medium no more than 7 days.
2.2.1.7 Sorafenib IC50 determination:
IC50 values for different cells lines against Sorafenib was measured by seeding the
cells to 96 well plates such that they would be 80% confluent on the following day
(the number of the cells differs for each cell line). Cells were treated with different
concentrations of Sorafenib and incubated in 37oC 5% CO
2 incubator for 72 hours. At
the end of the treatment, cell viability was measured with Cell Titer Glo (explained at
Page 24) and the concentration of Sorafenib that kills 50% of the cells (IC50) was
22
2.2.1.8 IKKε overexpression in cells:
To over-express IKKε in Hep3B and SorHep3B in a well of 96 well plate: 0.2μg
DNA was added to 30μL Optimem in a 1.5mL SafeLock Eppendorf tube. Following a
soft vortex and quick spin down, 0.4μL PolyFect was added to the mixture. The
mixture was softly vortexed and quickly spinned down again and let it sit at room
temperature for 15 minutes before adding to the cell medium. Transfected cells were
treated with Sorafenib 24 hours later.
2.2.1.9 shRNA transfection:
HEK293T cells were cultured in DMEM supplemented with 8% FBS. The day before
the transfection, HEK293T cells were seeded to 6-well plates 8-9x10⁵ cells/well to
achieve 80% confluency next day. Cells were transfected with 8μg of DNA in total.
DNA mixture is prepared with plasmid, H2O and CaCl2 in amount listed in Table 2.
The mixture is then added drop-wise to the 2x HBSS under continuous agitation by a
vortex machine. The mixture was incubated at room temperature for 3 minutes then
added drop wise to HEK293T cells. The dish was gently shaken to distribute the
23 Table 2: The reaction conditions for transfection of shRNA against IKBKE.
Concentration (mg/ml) 4μG DNA Packaging plasmid (μL) ddH2O (μL) CaCl2 (μL) 2X HBSS (μL) shIKBKE Scr 1.1 3.64μL 4.3 123.06 19 150 shIKBKE 29 1.1 3.64μL 4.3 123.06 19 150 shICKBKE 43 1.2 3.33μL 4.3 123.37 19 150 shIKBKE 67 1 4μL 4.3 122.7 19 150
16 hours after the transfection, medium of transfected HEK293T cells was changed
to a minimum amount in order to concentrate the viral product prepared for
transduction.
The recipient cells were also previously seeded so that they are 30-40% confluent on
the day of transduction. 48h post transfection, supernatant harboring virus from the
producing HEK293T cells were collected, centrifuged to remove cell debris at
maximum speed for 10 minutes, and then added to recipient cells. Polybrene was
used at a final concentration of 5μg/ml to enhance transduction efficiency.
Successfully transduced cells were selected by culturing them with puromycin for at
24 2.2.2 Cell based Assays:
2.2.2.1 Cell viability assessment:
Cell viability assessment was carried out in 96 well plates with the Cell Titer Glo kit
(Promega). At the ending point of experiments, the medium of the wells to be
measured was replaced with 50μM fresh growth medium. Cell plate was incubated
again in 37oC 5% CO2 incubator for 1.5 hours to settle down any disturbance for cells.
After an additional 30 minutes incubation at room temperature, the plate is ready for
the measurement with Cell Titer Glo kit. 50μL of reconstituted Cell Titer Glo was
added to each well and plate, followed by 5 minutes shaking on plate shaker to assist
cell lysis and10 minute incubation at room temperature to stabilize the signals. Cell
lysates were next transferred to a white opaque walled 96 well plate and luminescence was to be read in Synergy HT Microplate reader.
2.2.2.2 Cell proliferation assessment with Real Time Cell Analyzer:
Before seeding the cells, 75μL of medium was added to each well of an E-Plate, by
reverse pipetting to avoid bubbles, then the E-Plate is inserted to the RTCA machine
and read for background measurement. SorRHep3B cells and DMSO cells were
seeded at 7500 cells/well (in 75μL). Hep3B-shIKBKE cells were seeded at 10000
25 incubator for 30 minutes to let the cells attach before proliferation measurements
starts. Cell index was measured every 10 minutes for 120 hours.
2.2.2.3 Sorafenib-Amlexanox combination treatment:
Naïve Hep3B cells were seeded to 96-well plates at 10000 cells/well to be 80% confluent the next day. The cells were treated with Sorafenib and Amlexanox at the
same time for 72 hours with different combination of concentrations for 72 hours.
Later, conditioned medium was replaced with 50μL fresh growth medium to avoid
potential cross reaction of chemicals with Cell Titer Glo reagent and cell viability was
assessed, as previously described.
2.2.2.4 poly(I:C) treatment:
The day before the treatment, cells were seeded to be 70-80% confluent on the next
day. Next day, medium on top of the cells was replaced with fresh growth medium
containing 50μg/mL poly(I:C). Cells were lysed 24 hours later.
2.2.3 Protein-based assays:
2.2.3.1 Protein extraction from cells:
The cells were taken out of the incubator and put directly on ice to halt all reactions.
Medium was aspirated out and the cells were washed with cold 1x PBS twice. Cells
26 tube. Cell pellet was separated by centrifugation at the highest speed for 5 minutes at
+4oC. Cell pellet was resuspended in Cell lysis buffer (Formula is given in materials
section). The suspension was further incubated on ice for 15 minutes for complete cell
lysis. Cell debris was separated by centrifugation at the highest speed for 10 minutes
at +4oC and the lysate was collected in another Eppendorf tube and kept at -80°C for
further analysis.
2.2.3.2 Proteins quantification:
Cell lysates were thawed directly on ice. Protein quantification is performed using
BCA kit according to the manufacturer’s instructionss. Bovine Serum Albumin (BSA)
2μg/μl is diluted 20x with dH2O (75μL BSA 2μg/μl +1425μL dH2O). The standards
were prepared in a 96 well as vertical triplicates with different concentrations as
shown in Table 3. Samples to be measured were diluted 1:100 by adding 4μL cell
lysate to 396μl dH2O and well mixed. Diluted samples were loaded horizontal
triplicate to the 96well plate. BCA reagent mixture was prepared as instructed (5mL
Solution A + 100μl Solution B) and 100μl BCA was added to each well of the standards and the samples. The plate was incubated at 60oC for 30 minutes and then
the signal was read in the Synergy HT microplate reader at 562nm. The
27 Table 3: preparation of protein quantification standards.
Concentration (μg /μl) Diluted BSA(μl) dH2O (μl) 0 0 100 1 10 90 2 20 80 3 30 70 4 40 60 5 50 50 7 70 30 10 100 0 2.2.3.3 Western Blotting:
Stacking and Separating gels were prepared according to the formula given in the
materials section. After the proteins were isolated and quantified, 4x loading dye was
added to the proteins and the samples were boiled at 75oC for 10 minutes. Equal
amounts of protein were loaded to the stacking gel. The gel was run at 120V for 100
minutes inside the Western Blot 1X Running Buffer. After the loading dye reaches the
end of the gel, the run was stopped and the gel was placed inside Western Blot 1x
Transfer Buffer. Sponges and Whatman papers were wetted in the same Western Blot
1x Transfer Buffer. The PVDF membrane was activated by shaking for 30 seconds in
28 Once every item was wet and ready to use, the transfer sandwich was prepared:
Figure 2.1: The sandwich for Western Blot transfer.
The sandwich was placed in the tank with Western Blot 1x Transfer Buffer. The
proteins were transferred to the membrane for 2 hours at 250mA (or overnight at
30mA). After the transfer was done, the membrane was blocked for 1 hour in 10%
milk (milk powder dissolved in 1x TBS-T) while shaking. The excess milk was
washed away by shaking the membrane in 1x TBS-T 3 times 10 minutes. The
membrane was cut according to the sizes of the proteins that will be checked and put
in primary antibody overnight (prepared in 3% BSA in 1x TBS-T). The excess
primary antibody was washed away in 1x TBS-T by shaking 3 times 10 minutes and
the membrane was put to secondary antibody for 1 hour. The excess secondary
antibody was washed away shaking 3 times 10 minutes in 1x TBS-T. After the
washing was done, the membrane was incubated with ECL for 5 minutes and
29 2.2.4 RNA-based assays:
2.2.4.1 RNA isolation:
Medium was aspirated from the cells and the cells were washed with cold 1x PBS
twice. 1x PBS was added on top of the cells and the cells were scraped out of the
dishes using a cell scraper. The cell suspension was centrifuged for 5 minutes at
maximum speed at +4oC. Later, the supernatant was discarded and RNA was isolated
from the remaining cell pellet according to the instructions supplied by the kit
manufacturer. The concentration of RNA was measured by Thermo Fisher NanoDrop
One.
2.2.4.2 cDNA synthesis:
The cDNA generation reaction was prepared as shown in Table 4. The enzyme should
be added last to the mixture and the mixture should always be prepared on ice.
Table 4: The reaction mixture for cDNA generation
DNA (μg) 4X primer Mix (μl) Nuclease Free Water (μl) Reverse Transcriptase (μl) Total (μl) 1 4 variable 1 20
After the preparation of the mixture, the tubes were quickly spinned down. The
30 Table 5: The conditions for cDNA generation.
Temperature (oC) Time (minutes)
25 5 46 20 95 1 4 ∞ 2.2.4.3 Quantitative PCR
The qPCR reaction mixtures were prepared as shown in Table 6.
Table 6: The reaction mixture of qPCR.
Samples:
cDNA stock (μl) 20 Add 3 μl
from this dilution H2O (μl) 440 Primers Primer mixture (μl) 0.5 SYBR Green (μl) 5 H2O 1.5 Total 10
Later, the plate was sealed very tightly and centrifuged for 3 minutes at 1200rpm. The
reaction was held in Roche Light Cycler 480. The reaction conditions were as
31 2.2.5 Statistical Analysis:
Unpaired t-Test was used for determining the differences between the datasets.
F-Test was used to test the differences between variance the curves. For all the
32
3 RESULTS
:
3.1 Creation of Sorafenib resistant Hep3B cell line (SorRHep3B) line
3.1.1 Determination of Sorafenib IC50 of naïve Hep3B cells:
In order to create the Sorafenib resistant Hep3B cell line (SorRHep3B), the naïve
Hep3B cells were continuously exposed to increasing doses of Sorafenib, starting
with a concentration just below the IC50. Therefore, first the IC50 of our Hep3B cells
needs to be measured. Cells seeded to a 96-well plate so that they would become 80%
confluent the next day are treated with different concentrations of Sorafenib. After 72
hours, cell viability was assessed by Cell Titer Glo assay. Upon calculation with
non-linear regression GraphPad Prism, the IC50 of the naïve Hep3B cells is obtained as
2.4μM (Figure 3.1).
Figure3.1: IC50 of naïve Hep3B cell line. Naïve Hep3B cells are exposed with increased
concentrations of Sorafenib for 72 hours and their viability is measured with Cell Titer Glo assay. Experiment has been performed twice with triplicates for each condition.
0 2 4 6 8 10 0 50 100 Sorafenib Concentration (µM) C e ll V ia b il it y ( % ) Naive Hep3B IC50: 2.4µM
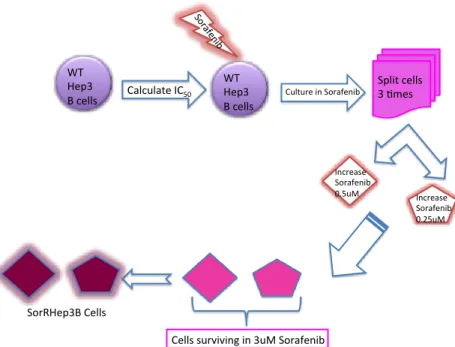
33 3.1.2 Generation of SorRHep3B cell lines:
To obtain the SorRHep3B cell line, we first start to treat naïveHep3B cells with 2μM
Sorafenib and gradually increase drug concentration over time. Cells were passaged
three times at the same drug concentration before being exposed to further increase by
either 0.5μM or 0.25μM. Two different cell lineages were created: SorRHep3B-A and
SorRHep3B-B, respectively. The schematic description is shown in Figure 3.2. Cell
morphology was carefully observed and recorded. Changes in cell shape first recorded
after 6 months (when the cells were growing in 2.5uM) and after 8 months we
assessed the IC50 of these cell lines again. Both lineages showed significant increase
of IC50 value: 5.758 for SorRHep3-A and 5.852 for SorRHep3B-B. We tried to
expose cells further at 3.25μM or 3.5μM but cells could not handle these concentrations anymore. Hence, we decided to make investigations with cells stably
growing in 3μM Sorafenib and consider them as SorHep3B, resistant to Sorafenib.
To carry out experiment with these SorHep3B, the cells were passaged without drug
and kept in medium without drug for at least 4 day and at most 7 days. After 7 days,
34 Figure 3.2: Schematic description of SorRHep3B creation. Naïve Hep3B cells were treated with gradually increasing concentrations of Sorafenib over 8 months and Sorafenib-resistant SorRHep3B cells were established.
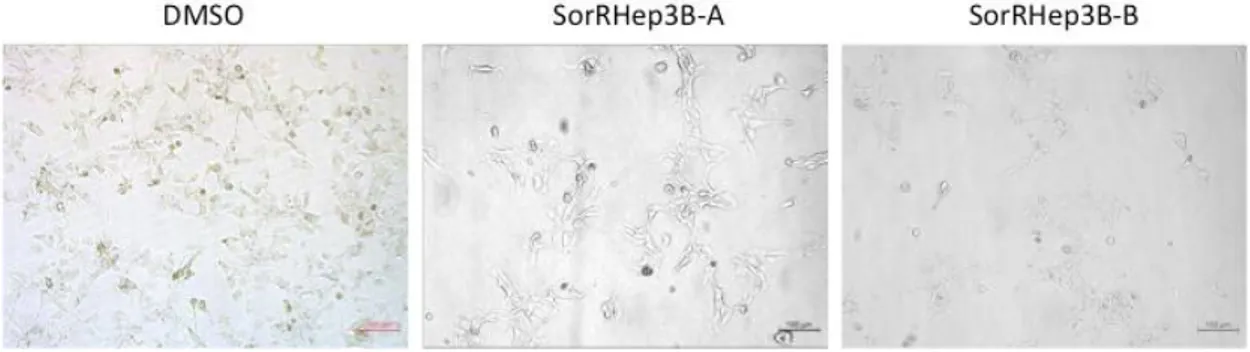
3.1.3 Morphological differences of SorRHep3B Cells compared to Control cells:
Hep3B are epithelial, adherent cells. While DMSO-treated cells look pretty similar to
the naïve cells, SorRHep3B cells showed obvious different morphological features. They are much bigger and highly branched. At high confluency, DMSO treated cells
become more packed while SorRHep3B cells could never be compacted. SorRHep3B
cells are healthier with big spaces among them. In addition, control cells could
survive better when they were in lower confluency as compared to the SorRHep3B
cells, which seem to be very fragile. Last but not least, SorRHep3B cells detached
from the tissue culture dishes easier than the control cells (Figure 3.3). WT Hep3 B cells Calculate IC50 Sora fe nib Split cells 3 mes Increase Sorafenib 0.5uM Increase Sorafenib 0.25uM
Cells surviving in 3uM Sorafenib SorRHep3B Cells
WT Hep3 B cells
35 Figure 3.3: SorRHep3B cells are morphologically different than DMSO cells. These images are taken with 4X magnification. Left: Hep3B cells cultured in 3µM DMSO. Middle and Right: SorRHep3B cells cultured in 3µM Sorafenib.
3.1.4 IC50 of SorRHep3B cell lines:
Both DMSO-treated and two lineages of SorRHep3B cells were seeded to 96-well
plate at 6000 cell/well. The next day, the cells were 80% confluent and Sorafenib
treatment was started. The cells were treated with different concentrations of
Sorafenib for 72 hours. The cell viability was measured by Cell Titer Glo assay. The
IC50 ofSorRHep3B cells were significantly higher than that of the DMSO treated cells
when compared to (5.758 and 5.82 for SorRHep3B-A and SorRHep3B-B,
36 Figure 3.4: IC50 of SorRHep3B cells. Control cells (DMSO) and SorRHep3B cells were seeded with
the same cell number and exposed to different concentrations of Sorafenib Their viability is measured with Cell Titer Glo assay after 72 hours. The experiment has been performed with triplicates.
Since SorHep3B cells have much bigger size as compared to the control ones, we
wanted to determine the IC50 of 48h instead of 72h to rule out the possibility of cell
death due to being over confluent. Again we obtained the IC50 of SorRHep3B-A cells
is of 5.765 whereas that of DMSO-treated cells is 3.604 (Figure 3.5).
Figure 3.5: IC50 of SorRHep3B cells are higher than that of control cells in 48 hours. Control cells
and SorRHep3B-A cells are treated with increasing Sorafenib concentrations for 48 hours and the cells viability is measured with Cell Titer Glo assay. Experiment was done with triplicate for each concentration. 0 1 2 3 4 5 6 7 8 9 0 50 100 Sorafenib Concenration (µM) C e ll V ia b il it y ( % )
SorRHep3B
DMSO SorRHep3B-A SorRHep3B-B IC50: DMSO: 3.244µM SorRHep3B-A: 5.758µM SorRHep3B-B: 5.852µM p-value < 0.0001 0 2 4 6 8 10 0 50 100Sorafenib Concenration (uM)
c e ll v ia b il it y (% ) SorRHep3B DMSO SorRHep3B-A IC50: DMSO: 3.769 SorRHep3B:5.765 p-value < 0.0001
37
3.2 Characterization of SorRHep3B cell lines:
3.2.1 Protein and mRNA expression is different between SorRHep3B and DMSO cells:
After the resistant cells were established, the differences in gene signatures were
assessed with Western Blot analysis. Clear differences between the control cells and
the SorRHep3B cells were observed (Figure 3.6). First of all, there was a significant
downregulation of IKBKE. Correspondingly, a decrease in TBK1 was also observed
at protein levels. There is an expected increase in the p-AKT levels of SorRHep3B-A
as p-AKT is shown to be involved in the generation of drug resistance [18]. As
mentioned above, SorRHep3B cells resembled mesenchymal cells. Hence, EMT
markers were also checked. Expectedly, there was an increase in the Vimentin levels.
However, E-Cadherin levels were also increased while the N-Cadherin levels were
decreased in SorRHep3B cells. Since SorRHep3B cells had long branches when
compared to control cells (Figure 3.3), the Integrin-α levels were also checked and
38 Figure 3.6: Protein expression is different DMSO-treated cells and SorRHep3B cells. Protein levels are determined by western blotting. -tubulin is used as loading control.
In order to check the RNA levels of EMT markers, qPCR was performed. Mostly, the
differences that were seen in the protein levels were mirrored also to RNA levels and
similar differences were observed. IKBKE and CDH2 (N-Cadherin) transcripts were
39 However, a 65% decrease in the Vimentin RNA levels were observed. This is the
exact opposite of what was seen with western blot analysis. Finally, a 200-fold
increase was seen in Snai2 RNA levels in SorRHep3B cells when compared to control
cells (Figure 3.7).
Figure 3.7: mRNA level expression is different DMSO-treated and SorRHep3B cells. A. All the epithelial markers, except CDH1 (E-Cadherin), are decreased. B. All the mesenchymal markers, expect CHD2 (N-Cadherin), are increased. C. IKBKE is decreased.
3.2.2 Assessment of proliferation of SorRHep3B cell line by Real Time Cell Analysis:
In order to assess the differences of proliferation between the control cells and
SorRHep3B cells, Real Time Cell Analysis (RTCA) was used. Upon seeding 7500
cells to each well of an E-Plate, proliferation was measured. As it can be seen form
the figure, SorRHep3B cells were significantly more proliferative than then control
CD H1 KRT1 8 EpC am 0 1 2 3 4 5 R e la ti v e E x p re s s io n
SorRHep3B Epithelial Markers
DMSO SorRHep3-A SorRHep3B-B DM SO Sor RHep 3-A Sor RH ep3B -B 0.0 0.5 1.0 1.5 R e la ti v e E x p re s s io n IKBKE DMSO SorRHep3-A SorRHep3B-B CDH 2 Vim entin Sna L 0.0 0.5 1.0 60 80 100 120 140 R e la ti v e E x p re s s io n
SorRHep3B Mesenchymal Markers
DMSO SorRHep3-A SorRHep3B-B
40 cells. At the end of 48 hours, SorRHep3B cells proliferated almost twice as much as
the control cells (Figure 3.8).
Figure 3.8: SorRHep3B cells are proliferating more than the control cells as shown by RTCA experiment. The experiment was performed as duplicates for each cell line.
3.2.3 SorRHep3B cells have survival advantage when treated with poly(I:C): poly(I:C) is a dsRNA analog which is a ligand for TLR3. Since the IKBKE is
significantly decreased in SorRHep3B, it is expected that the SorRHep3B cells to
have an advantage over DMSO cells when treated with poly(I:C). As expected, the
SorRHep3B cells had a significant survival advantage over DMSO-treated cells (cell
viability 80% and 71% 24hr after poly(I:C) treatment, respectively. p-value = 0.0394,
Figure 3.9). 0:00 :00 20:0 0:00 40:0 0:00 0 2 4 6 Time (hr) C e ll I n d e x
SorRHep3B
DMSO SorRHep3B-B SorRHep3B-A **** p-value < 0.0001 * p-value = 0.001441 Figure 3.9: SorRHep3B cells show survival advantage upon poly(I:C) treatment. Cells are treated with 0ug/ml and 50μg/ml poly(I:C) for 24 hours and the cell viability is measured using Cell Titer Glo assay. (p-value= 0.0394). The experiment was performed twice with triplicates for each condition.
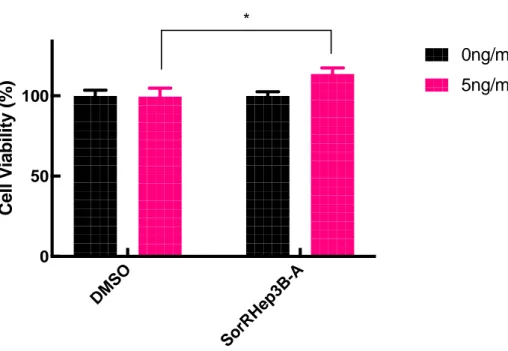
3.2.4 SorRHep3B cells show increased survival upon TGF-β treatment:
TGF-β is an inducer of EMT and since the SorRHep3B cells showed more
mesenchymal properties it is expected that they would have survival advantage when
treated with TGF-β. To test this, DMSO-treated control cells and SorRHep3B-A cells
were treated with 5ng/ml TGF-β for 48 hours and their viability was measured with
Cell Titer Glo Assay. As Figure 3.10 shows, SorRHep3B cells showed higher
survival upon TGF-β treatment when compared to treated cells.
DMSO-treated cells could not increase their viability upon TGF-β treatment whereas the
SorRHep3B cells had an 13% increase upon induction (p-value = 0.0184, Figure 3.10)
DM SO Sor RH ep3B 0 50 100 C e ll V ia b il it y ( % ) 0 µg/ml 50 µg/ml *
42 Figure 3.10: SorRHep3B cells have increased survival upon TGF-β treatment. Cells are treated with 0ng/ml and 5ng/ml TGF-b and the cell survival was assessed with Cell Titer Glo assay. The experiment was performed twice with triplicates for each condition.
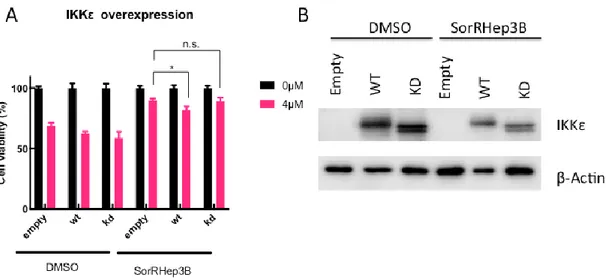
3.2.5 IKBKE rescue resensitizes SorRHep3B cells to Sorafenib:
Since SorRHep3B cells have a downregulation of IKKε, we wanted to see if IKBKE
rescue would re-sensitize SorRHep3B cells to Sorafenib. To this extend, IKBKE was
overexpressed and treated with 4μM Sorafenib for 24 hours. Cells were seeded to 96-well plates to 70% confluent the next day. As it can be seen from Figure 3.11A that
the Wild Type (WT) IKBKE rescue results in a significant decrease in cell survival.
On the other hand, when kinase-dead IKBKE (KD) is exogenously expressed in the
cells, it fails to induce further cell death upon Sorafenib treatment. Figure 3.11B
shows the transfection of IKBKE plasmid was successful. The reason why IKBKE
levels are lower in SorRHep3B cells might be because the cells are trying to degrade
the protein as it is being produced.
DM SO Sor RH ep3B -A 0 50 100 C e ll V ia b il it y ( % ) 0ng/ml 5ng/ml *
43 Figure 3.11: IKBKE rescue re-sensitizes SorRHep3B cells to Sorafenib. A. DMSO or SorRHep3B cells are transfected with empty pcDNA vector (Empty), IKBKE wild Type (WT) plasmid or Kinase Dead IKBKE (KD) plasmid and treated with 4uM Sorafenib for 24 hours. Cell viability is assessed with Cell Titer Glo assay. B. IKBKE levels are checked with western blotting to confirm that the transfection is successful. β-Actin is used as loading control. The experiment was performed twice, with either triplicates or 5-replicates for each condition. The image is representative of both experiments. (p-value: 0.0159).
3.3 Hep3B cells with IKK loss of function show some similar phenotypes
to SorHep3B cells
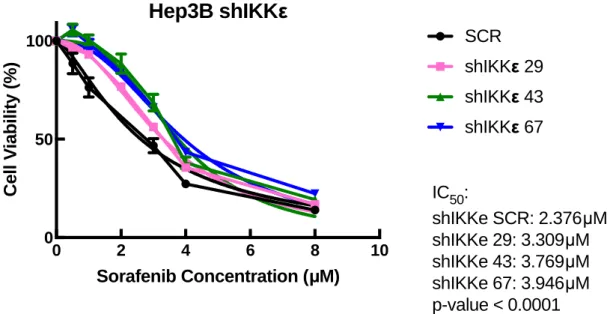
3.3.1 IKBKE depletion confers Sorafenib resistance to naïveHep3B
Since the level IKBKE expression is dramatically decreased in SorRHep3B cells, we
would like to test the Sorafenib resistance ability of naïve Hep3B cells upon IKBKE depletion by shRNA. As expected, IKBKE depleted Hep3B cells, appeared to be
44 more resistant to Sorafenib. First of all, the Sorafenib IC50 of the depleted cells were
significantly higher than the control cells (Figure 3.12).
Figure 3.12: Depletion of IKBKE with shRNA increases resistance of Hep3B cells to Sorafenib. Cells are treated with different concentrations of Sorafenib for 72 hours and their viability is measured with Cell Titer Glo assay. The experiment was performed twice with triplicates for each condition.
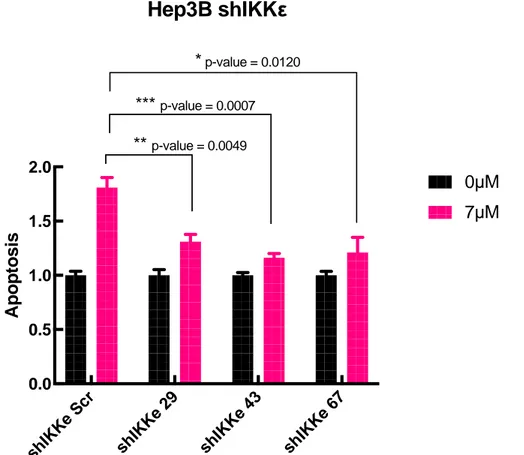
In addition, IKBKE depleted cells were treated with 7μM Sorafenib and their apoptosis was quantified by measuring the Caspase 3/7 activation of the cells using
Caspase3/7 Glo assay. Figure 3.13 shows that the shSCR control cells went through
apoptosis almost twice as much as the shIKKε cells upon Sorafenib.
0 2 4 6 8 10 0 50 100 Sorafenib Concentration (µM) C e ll V ia b il it y ( % )