https://doi.org/10.1007/s11033-018-4522-z
ORIGINAL ARTICLE
PKNOX2 expression and regulation in the bone marrow mesenchymal
stem cells of Fanconi anemia patients and healthy donors
Ilgin Cagnan1,5 · Erdal Cosgun2,6 · Ozlen Konu3 · Duygu Uckan1,4 · Aysen Gunel‑Ozcan1 Received: 5 September 2018 / Accepted: 22 November 2018 / Published online: 4 December 2018
© Springer Nature B.V. 2018 Abstract
HOX and TALE transcription factors are important regulators of development and homeostasis in determining cellular identity. Deregulation of this process may drive cancer progression. The aim of this study was to investigate the expression of these transcription factors in the bone marrow derived mesenchymal stem cells (BM-MSCs) of Fanconi anemia (FA) patients, which is a cancer-predisposing disease. Expression levels of HOX and TALE genes in BM-MSCs were obtained from FA patients and healthy donors by RT-qPCR and highly conserved expression levels were observed between patient and donor cells, except PKNOX2, which is a member of TALE class. PKNOX2 was significantly downregulated in FA cells compared to donors (P < 0.05). PKNOX2 expression levels did not change with diepoxybutane (DEB), a DNA crosslinking agent, in either donor or FA cells except one patient’s with a truncation mutation of FANCA. A difference of PKNOX2 protein level was not obtained between FA patient and donor BM-MSCs by western blot analysis. When human TGF-β1 (rTGF-β1) recombinant protein was provided to the cultures, PKNOX2 as well as TGF-β1 expression increased both in FA and donor BM-MSCs in a dose dependent manner. 5 ng/mL rTGF-β stimulation had more dominant effect on the gene expression of donor BM-MSCs compared to FA cells. Decreased PKNOX2 expression in FA BM-MSCs may provide new insights into the molecular pathophysiology of the disease and TGF-β1 levels of the microenvironment may be the cause of PKNOX2 downregulation.
Keywords PKNOX2 · HOX genes · TALE class · TGF-β1 · Fanconi anemia · Bone marrow mesenchymal stem cells
Introduction
Cellular identity is established during developmental pro-cess when cells progressively gain specific lineage prop-erties through the guidance of transcriptional networks.
Electronic supplementary material The online version of this article (https ://doi.org/10.1007/s1103 3-018-4522-z) contains supplementary material, which is available to authorized users. * Aysen Gunel-Ozcan agozcan@hacettepe.edu.tr Ilgin Cagnan icagnan@hotmail.com Erdal Cosgun ercosgun@microsoft.com Ozlen Konu konu@fen.bilkent.edu.tr Duygu Uckan duckan@hacettepe.edu.tr
1 Department of Stem Cell Sciences, Graduate School
of Health Sciences, Center for Stem Cell Research and Development, Hacettepe University, Sihhiye, 06100 Ankara, Turkey
2 Department of Biostatistics, Faculty of Medicine, Hacettepe
University, Ankara, Turkey
3 Department of Molecular Biology and Genetics, Bilkent
University, Ankara, Turkey
4 Department of Pediatrics, Division of Bone Marrow
Transplantation Unit, Faculty of Medicine, Hacettepe University, Ankara, Turkey
5 Present Address: Blood Bank, Burhan Nalbantoglu State
Hospital, Nicosia, North Cyprus
6 Present Address: Microsoft Research, 14820 NE 36th Street,
Organ-specifically expressed HOX genes encode ‘mas-ter regulatory’ homeodomain transcription factors that function in specifying anterior-posterior patterning and establish regional identity during embryonic development [1–3]. In mammals, HOX genes are found in four clusters, designated as A, B, C and D, which are located on differ-ent chromosomes. DNA binding specificity of HOX pro-teins is increased through protein–protein interactions with the members of three-amino-acid loop extension (TALE) class homeodomain proteins, known as Meis (MEIS1,
MEIS2, MEIS3), Pknox (PKNOX1, PKNOX2) and Pbx
(PBX1, PBX2, PBX3, PBX4) gene families [4, 5]. Besides their role in embryonic development, TALE members act as oncogenes (e.g. MEIS1) and tumor suppressors (e.g.
PKNOX1), as well as function in DNA repair and maintain
genomic stability (e.g. PKNOX1) [6, 7].
During adult life, tightly regulated HOX expression pattern continues to provide a “biological fingerprint” for different cell types [8–10]. Loss of cellular identity through alterations in HOX pathway is one of the driving mechanisms of cancer development such as solid tumors and leukemia [11, 12]. Genomic instability in patients (e.g. Fanconi anemia, Wemer syndrome, Bloom syndrome and Ataxia telangiectasia) with defective DNA damage repair pathway (i.e. direct reversal, homologous recombination, non-homologous end joining, mismatch repair, nucleotide excision repair and base excision repair) is also a con-tributor of cancer progression [13, 14]. We hypothesize that HOX code may change in the diseases with defec-tive DNA repair pathway and predisposition to cancer. To test this hypothesis, we profiled HOX and TALE gene expression in Fanconi anemia (FA) patients, which is a rare inherited disorder with an estimated incidence of 1 in 160,000-360,000 live births [15, 16]. FA patients are characterized with congenital malformations, predis-position to leukemia and solid organ cancers and bone marrow (BM) failure [15]. Mutations in twenty-two dif-ferent genes, which encode FA complementation group (FANC) proteins and are involved in DNA repair path-way, are responsible for the disease [15, 17]. Moreover, patient cells display hypersensitivity to DNA interstrand crosslinking agents, such as diepoxybutane (DEB), which lead to DNA damage through high levels of chromosomal breaks [18]. The molecular basis of the FA pathophysiol-ogy has not been completely elucidated. A study by Zhang et al. shows hyperactive transforming growth factor-beta (TGF-β) signaling as a cause of BM failure in the patients [19]. Members of TGF-β signaling pathway is reported to interact with HOX genes [20–23], thus deregulation of TGF-β signaling in FA patients may disturb HOX and TALE gene expression as well. Therefore, we also inves-tigated the degree of association between TGF-β and
modulation of PKNOX2, which we found out differentially expressed in FA.
Materials and methods
Bone marrow mesenchymal stem cells from FA patients and donors
Bone marrow mesenchymal stem cells (BM-MSCs) obtained from FA patients (HUSCS-FA1 -12; n = 12) and donors (HUSCS-D1-16; n = 16) were used. Cells were maintained in DMF10 medium, which contained 100 U/mL penicillin, 100 µg/mL streptomycin, 2 mM L-glutamine (Biochrom AG, Germany) and 10% heat-inactivated fetal bovine serum (GIBCO, UK) in a mixture of 60% Dulbecco’s modified Eagle’s medium–low glucose (GIBCO) and 40% MCDB-201 medium (Sigma-Aldrich, USA). Passage 3 BM-MSCs were used in the following experiments. Characterization of BM-MSCs was published previously [24, 25]. Informed consent was obtained from FA patients and donors enrolled in this study. This study was approved by the Local Ethical Committee (Number 14, 24/08/2009) and Hacettepe Univer-sity Non-interventional Clinical Research Ethics Board (GO 14/403-12, 23/07/2014).
HOX and TALE gene expression profiling of BM‑MSCs from FA patients and donors
Details of RNA isolation, cDNA synthesis and reverse tran-scriptase quantitative polymerase chain reaction (RT-qPCR) analysis were outlined previously [24, 26]. cDNAs were syn-thesized from 260 ng RNA samples per 20 µl. Expression of 39 HOX and 8 TALE genes were analyzed using RealTime ready Assay (Roche, USA). Target gene expression was nor-malized against house keeping gene, ACTB. Relative gene expression was determined by ΔCt method, calculated by log transformation of 2−ΔCt. To enhance the efficiency of
statistical analyses, missing ΔCt values were imputed by Multivariate Imputation by Chained Equations (MICE) in R Project for Statistical Computing [27]. MICE method involved assigning a default value for each missing entry. Each column was then updated by appropriate regression or classification algorithm and Number of Iterations parameter showed number of times the updates were repeated [28, 29]. Western blot analysis
The differentially expressed gene obtained by RT-qPCR profiling was also determined at protein level. Total pro-tein lysates from BM-MSCs were prepared using Pierce® RIPA Buffer (Thermo Scientific, USA) containing 1X pro-tease inhibitor cocktail (Sigma-Aldrich). Protein lysates in
Laemmli Buffer (Bio-Rad, USA) containing 355 mM 2-mer-captoethanol (Bio-Rad) were denatured by boiling for 5 min, and then separated by SDS-PAGE, using 10% TGX Stain-Free FastCast Acrylamide kit (Bio-Rad) following manu-facturer’s protocol. Proteins were transferred to a PVDF membrane by Trans-Blot® Turbo™ Transfer System (7 min, 2.5 A and ≤ 25 V; Bio-Rad). Membranes were blocked in TBS containing 0.1% Tween 20 (TBS-T; Bio-Rad) and 5% dry milk (Bio-Rad) for 1 h at room temperature, followed by incubation with 1:100 diluted mouse-anti-PKNOX2 primary antibody (Santa Cruz Biotechnology, USA, Cat# sc-101857) overnight at 4 °C. Membranes were washed with TBS-T, followed by incubation with HRP-goat-anti-mouse secondary antibody (1:2000 dilution; Abclonal, USA) for 1 h at room temperature. Peroxidase activity was measured using Clarity Western ECL Substrate kit (Bio-Rad), follow-ing manufacturer’s protocol and images were obtained by Kodak Gel Logic 1500 Imaging System (Thermo Fisher Scientific). Membranes were washed, blocked, and re-blotted with 1:2500 diluted rabbit-anti-β-ACTIN (Cell Signaling Technology, USA, Cat# 8457). Subsequent steps were same as described above, but HRP-goat-anti-rabbit secondary antibody (Abclonal) was used. PKNOX2 protein levels were compared between samples according to signal intensity of PKNOX2 protein bands normalized to loading control β-ACTIN. Densitometry analyses were performed by evaluating band intensity of mean grey value using ImageJ software [30, 31].
DEB treatment of BM‑MSCs
FA cells show sensitivity to DNA interstrand crosslinking agents, such as DEB. Once treated with DEB, patient cells acquire chromosome breaks and undergo cell cycle arrest as well as genomic instability [18]. BM-MSCs derived from FA patients (n = 6) and donors (n = 3) were treated with 0.1 µg/ mL DEB (Sigma-Aldrich) in DMF10 medium, as outlined previously [25]. Untreated cells cultured in DMF10 medium were used as control. cDNAs synthesized from 260 ng RNA samples were used in RT-qPCR analysis to determine the effect of DEB treatment on PKNOX2 relative expression. When Ct value was not acquired, ΔCt was accepted as − 25. Culture of BM‑MSCs with recombinant human TGF‑β1 protein
BM-MSCs from FA patients or donor were plated into six-well plates and kept in a 5% CO2 incubator at 37 °C for 24 h. Cells were then induced with 0.1 or 5 ng/mL of recombinant human TGF-β1 protein (rTGF-β1; BioLegend, USA) con-taining DMF10 medium for 24 h. Uninduced cells main-tained in DMF10 medium were included as controls. The effect of rTGF-β1 treatment on PKNOX2, MEIS1, PBX1 and
TGF-β1 expression in BM-MSCs from FA patients (n = 5)
and donors (n = 5) was determined. Following induction, BM-MSCs were trypsinized in 0.25% trypsin (Invitrogen, UK) containing 1 mM EDTA (Invitrogen) and washed with PBS (Applichem, Germany), followed by RNA isolation and cDNAs synthesis (i.e. 130 ng RNA was used), accord-ing to above protocol. Fold change (FC) in gene expres-sion between induced and control cells were calculated by applying a log transformation to 2−ΔΔCt [32]. The effect of
rTGF-β1 induction on PKNOX2 protein level of BM-MSCs from FA patients (n = 3) and donors (n = 3) was determined using western blot analysis, following the above protocol. Statistical analysis
Statistical analyses were performed using IBM SPSS Sta-tistic software, V24 and graphics were constructed using GraphPad Prism 7, unless stated otherwise. To compare two independent groups, Student’s t-test or Mann Whitney
U (MWU) test was performed and P-value less than 0.05
was considered as statistically significant. To compare three dependent groups, Friedman’s 2-way ANOVA by ranks test was used and if asymptotic P-value was less than 0.05, pair-wise test with Bonferroni correction was applied to test the significance within two groups (i.e. adjusted P < 0.05). Heat-map (clustering method: single linkage; distance method: Euclidean), as well as scatter-plot showing differentially expressed genes between groups was constructed using Exiqon GenEx qPCR analysis software. Spearman correla-tion analysis was performed on GraphPad Prism 7 software and was expressed as correlation coefficient (r).
Results
HOX and TALE profile of BM‑MSCs
HOX and TALE genes had a conserved expression between FA patient and donor BM-MSCs. Cells had no
HOXB1 expression, whereas they had low and
inconsist-ent expression of HOXB13, HOXC12, HOXD10, HOXD11,
HOXD12 and HOXD13 (Online Resource 1), thus these
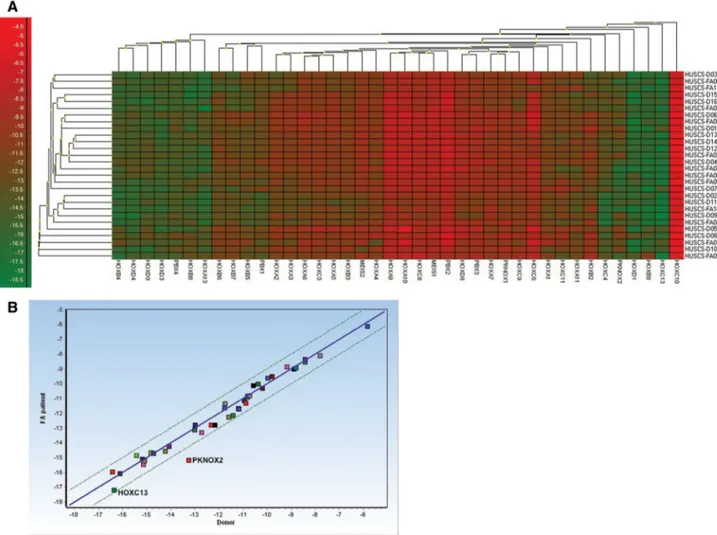
genes were excluded from imputation and further analy-sis. HOX and TALE gene expression was grouped into six clusters (Fig. 1a). The first cluster included HOXA13,
HOXB4, HOXB8, HOXD3, HOXD4, HOXD9 and PBX4 (ΔCtmin = − 18.79, ΔCtmax = − 11.91). The
sec-ond cluster was consisted of HOXA1, HOXA2, HOXA3,
HOXA4, HOXA5, HOXA6, HOXA7, HOXA9, HOXA10, HOXA11, HOXB2, HOXB3, HOXB5, HOXB6, HOXB7, HOXC4, HOXC5, HOXC6, HOXC8, HOXC9, HOXC11, HOXD8, MEIS1, MEIS2, PBX1, PBX2, PBX3, PKNOX1
HOXD1 (ΔCtmin = − 18.05, ΔCtmax = − 12.73), HOXB9
(ΔCtmin = − 18.74, ΔCtmax = − 11.25), HOXC13
(ΔCtmin = − 18.97, ΔCtmax = − 13.90) or HOXC10
(ΔCtmin = − 7.10, ΔCtmax = − 4.03) were clustered alone (Fig. 1a). Additionally, HOXC10 had the highest relative expression level in all BM-MSCs (Fig. 1a). Correlation analysis revealed that gene expression was highly associated (r = 0.9861, P < 0.0001) between FA patients and donors, while PKNOX2 and HOXC13 were differentially expressed between groups (Fig. 1b).
Statistical analysis revealed that expression of HOX (Fig. 2a–d) genes, as well as MEIS1, MEIS2, PBX1, PBX2,
PBX3, PBX4 and PKNOX1 (Fig. 2e) were not significantly (P > 0.05) different between groups. However, PKNOX2 expression of FA patients (− 15.19 ± 1.49) was significantly lower than (P < 0.05) the expression of donors (− 13.24 ± 1.37; Fig. 2e). DEB treatment had no effect on PKNOX2 relative
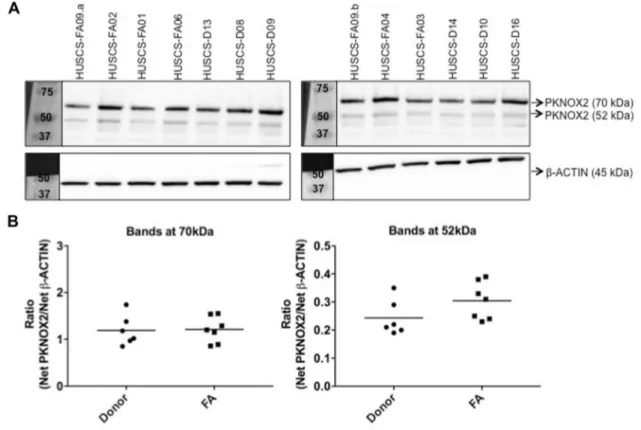
expression levels of FA patients and donors, except one patient’s BM-MSCs (HUSCS-FA04) which lost the expres-sion of PKNOX2 (ΔCt = − 25) by DEB treatment (Fig. 2f). Western blot analysis revealed that BM-MSCs probably had more than one PKNOX2 isoform (Fig. 3a). When variants corresponding to 70 kDa (i.e. large) and 52 kDa (i.e. small) were quantified, cells had higher levels of large variant com-pared to small one (Fig. 3b). Additionally, level of large and small PKNOX2 isoforms did not differ (P > 0.05) between FA patient (1.21 ± 0.28 and 0.30 ± 0.07, respectively) and donor cells (1.19 ± 0.33 and 0.24 ± 0.06, respectively; Fig. 3b). Effect of rTGF‑β1 induction on PKNOX2 and TGF‑β1 levels
For each experimental condition (i.e. control, 0.1 or 5 ng/mL rTGF-β1 protein), fold change in gene expressions of both
Fig. 1 HOX and TALE gene expression was conserved between FA patient and donor BM-MSCs. a Heat-map illustration of gene expres-sion of BM-MSCs from FA patients (n = 12) and donors (n = 16). Dendrograms showed clustering of genes or FA and donor samples. Red color indicates high expression, whereas green color indicates
low gene expression. b HOX and TALE gene expression was highly correlated between FA patient (n = 12) and donor (n = 16) BM-MSCs. However, PKNOX2 and HOXC13 were differentially expressed between groups. (Color figure online)
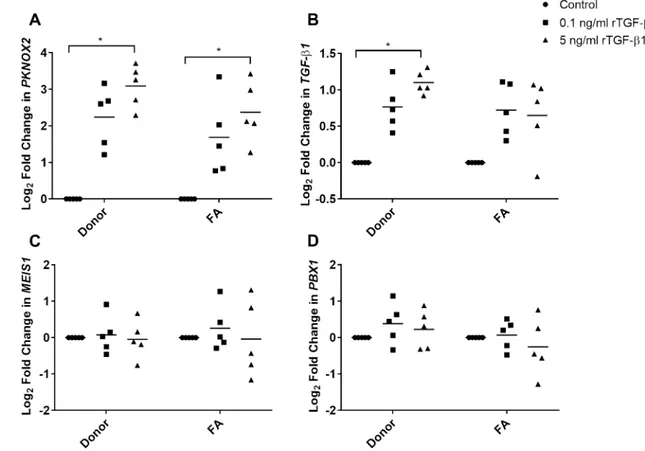
FA and donor BM-MSCs were upregulated as the dose of rTGF-β1 increased (Fig. 4a, b). When compared to their cor-responding uninduced controls, increase in PKNOX2 expres-sion was significant in both FA (Log2 FC = 2.37 ± 0.84) and
donor (Log2 FC = 3.09 ± 0.58) BM-MSCs induced with
5 ng/mL rTGF-β1 protein (adjusted P < 0.05; Fig. 4a). The same dose also provided a significant increase in TGF-β1 expression of the donor BM-MSCs (Log2 FC = 1.10 ± 0.16);
adjusted P < 0.05; Fig. 4b, but not of the FA BM-MSCs. Fold change differences in either PKNOX2 (Fig. 4a) or
TGF-β1 (Fig. 4b) were not significant when FA patients compared to donors (P > 0.05). rTGF-β1 treatment of BM-MSCs did not alter MEIS1 (Fig. 4c) or PBX1 (Fig. 4d) expression levels (P > 0.05).
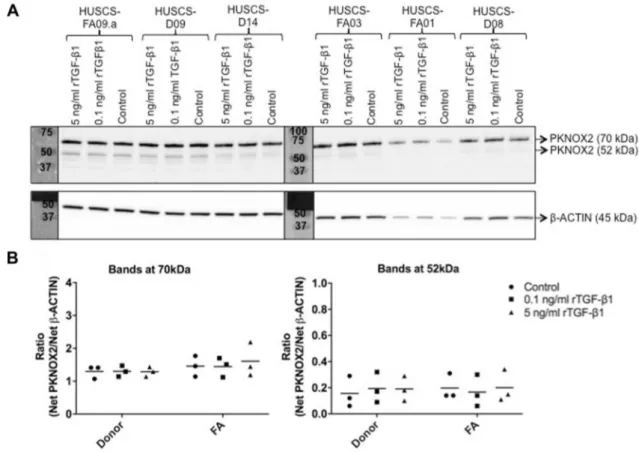
Level of PKNOX2 protein was determined prior to and after induction with 0.1 and 5 ng/mL rTGF-β1 protein
Fig. 2 Relative expression of a HOXA, b HOXB, c HOXC, d HOXD, as well as e TALE class genes were highly conserved between FA (n = 12) and donor (n = 16) BM-MSCs. However, PKNOX2 expres-sion of FA BM-MSCs was significantly lower than donor cells. Data are shown as means ± standard deviation (SD). Asterisk (*) depicted
statistically significant difference (P < 0.05). f DEB treatment had no effect on PKNOX2 expression of FA (n = 6) and donor (n = 3) BM-MSCs. BM-MSCs from a patient (HUSCS-FA04) had no expression of PKNOX2 (ΔCt = − 25) following DEB treatment
(Fig. 5). All samples had higher level of large variant (70 kDa) compared to small isoform (52 kDa; Fig. 5a). PKNOX2 protein level remained unchanged (P > 0.05) between FA and donor BM-MSCs at any experimental con-dition (Fig. 5b). Additionally, PKNOX2 protein level within either FA patients or donors did not change significantly (P > 0.05) upon induction (Fig. 5b).
Discussion
The molecular signature of HOX expression is organ-spe-cific [8, 9]. Changes in HOX pathway may result in altera-tions in the cellular identity and trigger cancer progression [11, 12]. One of the aims of this study was to assess, whether HOX and TALE gene expression pattern changed in diseases predisposed to cancer, like FA. At the third passage, FA BM-MSCs had comparable HOX gene expression levels with donor cells, but HOXC13 expression was relatively lower in patients. In conjunction with other studies, we also found that most HOX genes, except HOXB1, HOXB13, HOXC12,
HOXD10, HOXD11, HOXD12 and HOXD13, were actively
expressed by BM-MSCs [33, 34]. Expression of HOXA9,
HOXA10, HOXC6, HOXC8, HOXC10 and HOXD8 in
BM-MSCs is known to be higher than other HOX genes, as also observed in our study [33, 34]. Liedtke and co-authors (2010) have reported that HOXA3, HOXA11, HOXA13,
HOXB2, HOXB3, HOXB8, HOXB9, HOXC11, HOXC13 and HOXD1 expression were absent in BM-MSCs [33], but we observed that they were expressed at low to intermediate level.
In our study, BM-MSCs also actively expressed mem-bers of TALE gene class. Intriguingly, BM-MSCs derived from FA patients had significantly lower PKNOX2 expres-sion compared to donors. We analyzed two different GEO datasets (GSE61853 and GSE87806) containing gene expression profile of bone marrow mesenchymal stromal cells from other bone marrow diseases (myelodysplastic syndrome—MDS-, polycythemia vera—PV-, and essential thrombocythemia—ET-, chronic myeloid leukemia—CML-) to test whether PKNOX2 expression level changed under other disease states. We found that PKNOX2 expression of mesenchymal stromal cells from MDS, PV, ET or CML patients did not significantly differ from controls (adjusted
P > 0.05; Online Resource 2) [35, 36]. According to the results of these datasets, decrease in PKNOX2 expression is restricted to FA patients. Additionally, it would be intrigu-ing to compare, whether PKNOX2 expression changes upon
Fig. 3 PKNOX2 protein level of BM-MSCs derived from FA patients (n = 7) and donors (n = 6) was not significantly different (P > 0.05). BM-MSCs expressed two different PKNOX2 isoforms (70 and 52 kDa). a Protein samples (45 µg per lane) were run on two different
10% SDS-PAGE gels and the pictures were taken at the same time (exposure time = 5 min). b Ratio of PKNOX2 isoforms normalized to β-ACTIN was calculated
cell passaging. Due to their low frequency (0.001–0.01% of nucleated cells) in the bone marrow [37], BM-MSCs have to be expanded in-vitro, which prevents the use of fresh explants. However, passaging BM-MSCs for a long-term trigger senescence and affect their proliferative capacity [38,
39]. Also, FA BM-MSCs have defects in their proliferation capacity and undergo senescence in-vitro [40]. Therefore, the passage number is one of the limitations of this study.
Unlike its mRNA level, PKNOX2 protein level did not change between FA patients and healthy donors. Protein and mRNA levels of a gene may not always correlate with each other due to post-transcriptional modifications or half-lives of proteins [41]. Herein, we obtained expression of two different PKNOX2 isoforms in BM-MSCs, correspond-ing to 70 and 52 kDa. On the SDS-PAGE gel, smaller vari-ant had the expected molecular weight of PKNOX2, while the molecular weight of large isoform corresponded to the in-vitro synthesized protein by Fognani et al. [42]. Similar to our findings, NIH3T3 mouse embryo fibroblast cell line is shown to have variants of PKNOX2 protein [43]. Clear function of PKNOX2 is not well understood apart from its
role in regulation of transcription through sequence-specific DNA binding and actin filament/monomer binding. Further-more, Pknox2 overexpression in mice limb bud mesenchyme results in hypoplastic radius and ulna, which are common defects observed in FA patients [44]. PKNOX2 has a high structural similarity to its paralogous gene PKNOX1, which is known to function as a tumor suppressor gene with roles in DNA repair and maintenance of genomic stability [6,
7, 42]. This might implicate that PKNOX2 could also be a potential player in the DNA repair of FA stromal environ-ment. Indeed, a whole genome RNA interference (RNAi) study showed that PKNOX2 silencing increased cellular sensitivity to ionizing radiation [45]. However, our study showed that DEB treatment of BM-MSCs did not change the expression of PKNOX2 in either donor or FA patients, except one that possessed a novel deletion of exon 1–2 in FANCA gene, reported in our previous study [25]. PKNOX2 expression is lost by DEB treatment in that patient’s BM-MSCs. Truncation mutation of that patient is probable to be more deleterious and can increase cellular sensitivity to cross linking agents such as DEB by PKNOX2 silencing or
Fig. 4 Fold change in a PKNOX2, b TGF-β1, c MEIS1 and d PBX1
expression of FA (n = 5) and donor (n = 5) BM-MSCs induced with 0.1 or 5 ng/mL rTGF-β1 for 24 h was determined. Increase in
PKNOX2 expression was significant in both FA and donor
BM-MSCs induced with 5 ng/mL rTGF-β1 protein compared to their corresponding controls (adjusted P < 0.05). TGF-β1 expression of
the donor BM-MSCs induced with 5 ng/mL recombinant protein was also significantly higher than uninduced donor cells (adjusted
P < 0.05), while the expression level in FA BM-MSCs fluctuated
within individuals. Asterisk (*) depicted statistically significant dif-ference (P < 0.05)
increased cellular sensitivity to DEB may be the cause of
PKNOX2 silencing. It is also possible that FANCA exon 1–2
is required for PKNOX2 expression, which should be tested by further functional assays.
From many (n = 1639) transcription factors found in humans [46], we focused on HOX and TALE transcription factors that are strictly under epigenetic control during adult life. TGF-β signaling interacts with HOX genes [20–23], and we previously showed fluctuation of TGF-β1 secretion from FA BM-MSCs [25]. Deregulated TGF-β signaling may disturb PKNOX2 expression in FA BM-MSCs and trigger disease progression, as seen in FA HSCs [19]. Dose- and time-dependent effects of TGF-β1 on cell cultures are well known [47, 48]. We performed the preliminary experiment by stimulating BM-MSCs from a donor with 0.1 or 5 ng/ mL rTGF-β1 protein for 24, 48 or 72 h (Online Resource 3). Following 24 h of incubation, TGF-β1 expression increased linearly in a dose-dependent manner (Online Resource 3), thus further experiments were only performed on this time-point. Additionally, 5 ng/mL rTGF-β1 protein was the maxi-mum induction dose used, because higher concentrations
stimulate chondrogenic differentiation [48]. Wu et al. also show that increase in TGFβ-1 concentration increases senes-cence activity of BM-MSCs [47].
PKNOX2 expression of both FA and donor BM-MSCs
were increased by rTGF-β1 in a similar dose-dependent manner, suggesting TGF-β1 signaling may not be per-turbed in FA BM-MSCs. Our data confirm the results of an expression microarray study deposited to GEO database (GSE46019) that shows an increase in PKNOX2 expression of BM-MSCs following TGF-β1 stimulation [49]. Also, Zhou et al. report that overexpressed Pknox2 decreases p-Smad1/5/8 levels in mice [44]. All in all, our data in con-junction with these studies suggest that PKNOX2 and TGF-β signaling pathway are associated with each other. Secondly, we investigated whether change in rTGF-β1 level altered the expression of any other TALE factors. To answer this question, MEIS1, an oncogenic transcription factor, as well as its cofactor, PBX1, were chosen [7, 50]. Stimulation of BM-MSCs did not affect the mRNA level of these genes, thus the dose-dependent effect of rTGF-β1 treatment is pos-sibly constrained to PKNOX2 expression. Moreover, this
Fig. 5 rTGF-β1 protein induction had no effect on PKNOX2 protein
level of FA (n = 3) and donor (n = 3) BM-MSCs. a Protein samples (20 µg per lane) were run on two different 10% SDS-PAGE gels and the pictures were taken at the same time (exposure time = 5 min). b Ratio of PKNOX2 protein isoforms normalized to β-ACTIN were
calculated. PKNOX2 protein level did not differ (P > 0.05) between FA and donor BM-MSCs at any experimental condition. Besides, PKNOX2 protein level within either FA patients or donors groups remained unchanged (P > 0.05) upon induction
study displayed that rβ1 treatment up-regulated
TGF-β1 expression of BM-MSCs in a dose-dependent manner,
confirming a positive feedback loop shown previously [51]. It was intriguing that the dose dependence of this loop was slightly disrupted in the BM-MSCs of FA patients. Although mouse models of FA do not resemble the complete charac-teristics of patients [52], it will be important to investigate whether in-vitro effect of rTGF-β1 treatment on the gene expression of BM-MSCs could be correlated with in-vivo studies.
In conclusion, PKNOX2 expression was downregulated in FA patient BM-MSCs compared to controls. Our results suggest that fluctuation in TGF-β1 levels may change
PKNOX2 expression. Being one of the important members
of bone marrow microenvironment, MSCs with deregu-lated PKNOX2 expression may impair the function of niche and would contribute to hematopoietic defects seen in FA patients, which needs to be elucidated further with func-tional analysis.
Acknowledgements This study was supported by The Scientific and
Technological Research Council of Turkey (TUBITAK; Project No: 110S021 in conjunction with EU COST Action BM0805 designated as ‘HOX and TALE transcription factors in Development and Disease’ and TUBITAK Project No: 214Z033). The data in this study is a part of Ilgin Cagnan’s Ph.D. thesis.
Compliance with ethical standards
Conflict of interest The authors declare that they have no conflict of interest.
References
1. Illig R, Fritsch H, Schwarzer C (2013) Spatio-temporal expres-sion of HOX genes in human hindgut development. Dev Dyn 242:53–66. https ://doi.org/10.1002/dvdy.23893
2. McGinnis W, Krumlauf R (1992) Homeobox genes and axial pat-terning. Cell 68:283–302
3. Williamson I, Eskeland R, Lettice LA et al (2012) Anterior-poste-rior differences in HoxD chromatin topology in limb development. Development 139:3157–3167. https ://doi.org/10.1242/dev.08117 4
4. Holland PW, Booth HA, Bruford EA (2007) Classification and nomenclature of all human homeobox genes. BMC Biol 5:47 5. Merabet S, Mann RS (2016) To Be Specific or Not: The Critical
Relationship Between Hox And TALE Proteins. Trends Genet 32:334–347. https ://doi.org/10.1016/j.tig.2016.03.004
6. Iotti G, Longobardi E, Masella S et al (2011) Homeodomain tran-scription factor and tumor suppressor Prep1 is required to main-tain genomic stability. Proc Natl Acad Sci U S A 108:E314–E322. https ://doi.org/10.1073/pnas.11052 16108
7. Thorsteinsdottir U, Kroon E, Jerome L, Blasi F, Sauvageau G (2001) Defining roles for HOX and MEIS1 genes in induction of acute myeloid leukemia. Mol Cell Biol 21:224–234
8. Ackema KB, Charite J (2008) Mesenchymal stem cells from different organs are characterized by distinct topographic Hox
codes. Stem Cells Dev 17:979–991. https ://doi.org/10.1089/ scd.2007.0220
9. Takahashi Y, Hamada J, Murakawa K et al (2004) Expression profiles of 39 HOX genes in normal human adult organs and anaplastic thyroid cancer cell lines by quantitative real-time RT-PCR system. Exp Cell Res 293:144–153
10. Yamamoto M, Takai D, Yamamoto F (2003) Comprehensive expression profiling of highly homologous 39 hox genes in 26 different human adult tissues by the modified systematic multi-plex RT-pCR method reveals tissue-specific expression pattern that suggests an important role of chromosomal structure in the regulation of Hox gene expression in adult tissues. Gene Expr 11:199–210
11. Bhatlekar S, Fields JZ, Boman BM (2014) HOX genes and their role in the development of human cancers. J Mol Med 92:811–823. https ://doi.org/10.1007/s0010 9-014-1181-y 12. Platais C, Hakami F, Darda L, Lambert DW, Morgan R, Hunter
KD (2016) The role of HOX genes in head and neck squamous cell carcinoma. J Oral Pathol Med 45:239–247. https ://doi. org/10.1111/jop.12388
13. Bhattacharjee S, Nandi S (2018) Rare genetic diseases with defects in DNA repair: opportunities and challenges in orphan drug development for targeted cancer therapy. Cancers 10(298). https ://doi.org/10.3390/cance rs100 90298
14. Hakem R (2008) DNA-damage repair; the good, the bad, and the ugly. EMBO J 27:589–605. https ://doi.org/10.1038/emboj .2008.15
15. Mamrak NE, Shimamura A, Howlett NG (2016) Recent dis-coveries in the molecular pathogenesis of the inherited bone marrow failure syndrome Fanconi anemia. Blood Rev 31:93–99. https ://doi.org/10.1016/j.blre.2016.10.002
16. Zhan-He W (2013) The concept and practice of Fan-coni Anemia: from the clinical bedside to the laboratory bench. Transl Pediatr 2:112–119. https ://doi.org/10.3978/j. issn.2224-4336.2013.07.01
17. Knies K, Inano S, Ramirez MJ et al (2017) Biallelic mutations in the ubiquitin ligase RFWD3 cause Fanconi anemia. J Clin Invest 127:3013–3027. https ://doi.org/10.1172/JCI92 069
18. Auerbach AD (1993) Fanconi anemia diagnosis and the diepoxyb-utane (DEB) test. Exp Hematol 21:731–733
19. Zhang H, Kozono DE, O’Connor KW et al (2016) TGF-beta Inhi-bition rescues hematopoietic stem cell defects and bone marrow failure in Fanconi anemia. Cell Stem Cell 18:668–681. https ://doi. org/10.1016/j.stem.2016.03.002
20. Wang N, Kim HG, Cotta CV et al (2006) TGFbeta/BMP inhibits the bone marrow transformation capability of Hoxa9 by repressing its DNA-binding ability. EMBO J 25:1469–1480
21. Walsh CM, Carroll SB (2007) Collaboration between Smads and a Hox protein in target gene repression. Development 134:3585–3592
22. Ruiz i Altaba A, Melton DA (1989) Interaction between peptide growth factors and homoeobox genes in the establishment of antero-posterior polarity in frog embryos. Nature 341:33–38 23. Kloen P, Visker MH, Olijve W, van Zoelen EJ, Boersma CJ (1997)
Cell-type-specific modulation of Hox gene expression by mem-bers of the TGF-beta superfamily: a comparison between human osteosarcoma and neuroblastoma cell lines. Biochem Biophys Res Commun 233:365–369
24. Cagnan I (2018) HOX and TALE transcription factors in Fanconi anemia bone-marrow mesenchymal stem cells: gene expression and protein interactions. Dissertation, Hacettepe University 25. Cagnan I, Gunel-Ozcan A, Aerts-Kaya F et al (2018) Bone
mar-row mesenchymal stem cells carrying FANCD2 mutation differ from the other Fanconi anemia complementation groups in terms of TGF-beta1 production. Stem Cell Rev 14:425–437. https ://doi. org/10.1007/s1201 5-017-9794-5
26. Cagnan I, Aerts Kaya F, Cetinkaya D, Gunel Ozcan G (2017) Stably expressed reference genes during differentiation of bone marrow-derived mesenchymal stromal cells. Turkish J Biol 41:88– 97. https ://doi.org/10.3906/biy-1511-93
27. Van Buuren S, Groothuis-Oudshoorn K (2011) mice: Multivari-ate Imputation by Chained Equations in R. J Statistical Software 45:1–67. https ://doi.org/10.18637 /jss.v045.i03
28. Azur MJ, Stuart EA, Frangakis C, Leaf PJ (2011) Multiple imputa-tion by chained equaimputa-tions: what is it and how does it work? Int J Methods Psychiatr Res 20:40–49. https ://doi.org/10.1002/mpr.329 29. Waljee AK, Mukherjee A, Singal AG et al (2013) Comparison of
imputation methods for missing laboratory data in medicine. BMJ Open 3. https ://doi.org/10.1136/bmjop en-2013-00284 7
30. Davarinejad H (2017) Quantifications of western blots with Image J. http://www.yorku .ca/yishe ng/Inter nal/Proto cols/Image J.pdf. (Accessed 01 October 2017)
31. Schneider CA, Rasband WS, Eliceiri KW (2012) NIH Image to ImageJ: 25 years of image analysis. Nat Methods 9:671–675 32. Livak KJ, Schmittgen TD (2001) Analysis of relative gene
expres-sion data using real-time quantitative PCR and the 2(− delta delta C(T)) method. Methods 25:402–408
33. Liedtke S, Buchheiser A, Bosch J et al (2010) The HOX Code as a “biological fingerprint” to distinguish functionally distinct stem cell populations derived from cord blood. Stem Cell Res 5:40–50. https ://doi.org/10.1016/j.scr.2010.03.004
34. Picchi J, Trombi L, Spugnesi L et al (2013) HOX and TALE sig-natures specify human stromal stem cell populations from differ-ent sources. J Cell Physiol 228:879–889. https ://doi.org/10.1002/ jcp.24239
35. Kim M, Hwang S, Park K, Kim SY, Lee YK, Lee DS (2015) Increased expression of interferon signaling genes in the bone marrow microenvironment of myelodysplastic syndromes. PLoS ONE 10:e0120602. https ://doi.org/10.1371/journ al.pone.01206 02 36. Ramos TL, Sánchez-Abarca LI, Rosón-Burgo B et al (2017) Mes-enchymal stromal cells (MSC) from JAK2 + myeloproliferative neoplasms differ from normal MSC and contribute to the main-tenance of neoplastic hematopoiesis. PLoS ONE 12:e0182470. https ://doi.org/10.1371/journ al.pone.01824 70
37. Pittenger MF, Mackay AM, Beck SC et al (1999) Multiline-age potential of adult human mesenchymal stem cells. Science 284:143–147
38. Baxter M, Wynn RF, Jowitt SN, Wraith JE, Fairbairn LJ, Bel-lantuono I (2004) Study of telomere length reveal rapid aging of human marrow stromal cells following in vitro expansion. Stem Cells 22:675–682
39. Wagner W, Horn P, Castoldi M, Diehlmann A, Bork S, Saffrich R, Benes V, Blake J, Pfiser S, Ecstein V et al (2008) Replica-tive senescence of mesenchymal stem cells: a continuous and organized process. PLoS ONE 3. https ://doi.org/10.1371/journ al.pone.00022 13
40. Xu J, Li X, Cole A, Sherman Z, Du W (2018) Reduced cell division control protein 42 activity compromises
hematopoiesis-supportive function of Fanconi anemia mesenchy-mal stromesenchy-mal cells. Stem Cells 36:785–795. https ://doi.org/10.1002/ stem.2789
41. Greenbaum D, Colangelo C, Williams K, Gerstein M (2003) Comparing protein abundance and mRNA expression levels on a genomic scale. Genome Biol 4:117
42. Fognani C, Kilstrup-Nielsen C, Berthelsen J, Ferretti E, Zap-pavigna V, Blasi F (2002) Characterization of PREP2, a paralog of PREP1, which defines a novel sub-family of the MEINOX TALE homeodomain transcription factors. Nucleic Acids Res 30:2043–2051
43. Haller K, Rambaldi I, Daniels E, Featherstone M (2004) Subcellu-lar localization of multiple PREP2 isoforms is regulated by actin, tubulin, and nuclear export. J Biol Chem 279:49384–49394 44. Zhou W, Zhu H, Zhao J et al (2013) Misexpression of Pknox2 in
mouse limb bud mesenchyme perturbs zeugopod development and deltoid crest formation. PloS ONE 8:e64237. https ://doi. org/10.1371/journ al.pone.00642 37
45. Hurov KE, Cotta-Ramusino C, Elledge SJ (2010) A genetic screen identifies the Triple T complex required for DNA damage signal-ing and ATM and ATR stability. Genes Dev 24:1939–1950. https ://doi.org/10.1101/gad.19342 10
46. Lambert SA, Jolma A, Campitelli LF et al (2018) The human transcription factors. Cell 172:650–665. https ://doi.org/10.1016/j. cell.2018.01.029
47. Wu J, Niu J, Li X, Wang X, Guo Z, Zhang F (2014) TGF-β1 induces senescence of bone marrow mesenchymal stem cells via increase of mitochondrial ROS production. BMC Dev Biol 14:21. https ://doi.org/10.1186/1471-213X-14-21
48. Schedel J, Lowin T, Kujat R et al (2010) RAP-PCR fingerprinting reveals time-dependent expression of matrix-related molecules following stem-cell based TGFβ1-induced chondrocyte devel-opment. Int J Mol Med 27:519–523. https ://doi.org/10.3892/ ijmm.2011.608
49. Walenda G, Abnaof K, Joussen S et al (2013) TGF-beta1 does not induce senescence of multipotent mesenchymal stromal cells and has similar effects in early and late passages. PloS ONE 8:e77656. https ://doi.org/10.1371/journ al.pone.00776 56
50. Dardaei L, Longobardi E, Blasi F (2014) Prep1 and Meis1 com-petition for Pbx1 binding regulates protein stability and tumori-genesis. Proc Natl Acad Sci U S A 111:E896–E905. https ://doi. org/10.1073/pnas.13212 00111
51. Li J, Tripathi BJ, Chalam KV, Tripathi RC (1996) Transforming growth factor-beta 1 and -beta 2 positively regulate TGF-beta 1 mRNA expression in trabecular cells. Invest Ophthalmol Vis Sci 37:2778–2782
52. Bakker ST, de Winter JP, te Riele H (2013) Learning from a paradox: recent insight into Fanconi anaemia through studying mouse models. Dis Model Mech 6:40–47. https ://doi.org/10.1002/ stem.2789