PERFORMANCE CHARACTERISTICS OF INVESTABLE
HEDGE FUNDS INDEXES
A Master‘s Thesis
by
ALİ ERDURMUŞ
Department Of
Management
Bilkent University
Ankara
May 2010
i
PERFORMANCE CHARACTERISTICS OF INVESTABLE
HEDGE FUNDS INDEXES
The Institute of Economics and Social Sciences
of
Bilkent University
by
ALİ ERDURMUŞ
In Partial Fulfilment of the Requirements for the Degree of
MASTER OF SCIENCE
in
THE DEPARTMENT OF
MANAGEMENT
BİLKENT UNIVERSITY
ANKARA
May 2010
ii
I certify that I have read this thesis and have found that it is fully adequate, in scope and in quality, as a thesis for the degree of Master of Science in Management.
--- Assoc. Prof. Levent Akdeniz Supervisor
I certify that I have read this thesis and have found that it is fully adequate, in scope and in quality, as a thesis for the degree of Master of Science in Management.
--- Assoc. Prof. Aslıhan Altay-Salih Examining Committee Member
I certify that I have read this thesis and have found that it is fully adequate, in scope and in quality, as a thesis for the degree of Master of Science in Management.
--- Assist. Prof. Ümit Özlale Examining Committee Member
Approval of the Institute of Economics and Social Sciences
--- Prof. Dr. Erdal Erel
iii
ABSTRACT
PERFORMANCE CHARACTERISTICS OF INVESTABLE HEDGE FUNDS INDEXES
Erdurmuş, Ali
M.S., Department of Management
Supervisor: Assoc. Prof. Levent Akdeniz
May 2010
In this study we examine the performance of investable hedge fund indexes by using an extended asset pricing model which uses GMM regression methods. Monthly returns of Hedge Fund Research (HFR) investable hedge fund indexes from January 2005 to October 2009 are analyzed. Our extended asset pricing model uses twelve different asset classes as explanatory factors such that three factors of Fama & French, three equity indexes, five bond indexes and one commodity index. The performance of investable hedge fund indexes for several strategies indicates that investable hedge funds indexes fail to deliver significant excess returns to their investors and their factor exposures are parallel to their main investment strategies.
iv
ÖZET
YATIRIM YAPILABİLİR HEDGE FONU ENDEKSLERİNİN PERFORMANS ÖZELLİKLERİ
Erdurmuş, Ali
Yüksek Lisans, İşletme Bölümü
Tez Yöneticisi: Doç. Dr. Levent Akdeniz
Mayıs 2010
Bu çalışmada, yatırım yapılabilir hedge fonu endekslerinin performans özellikleri GMM regresyon metodunu kullanan genişletilmiş bir varlık fiyatlama modeli kullanılarak analiz edilmektedir. Yatırım yapılabilir hedge fonu endekslerinin Ocak 2005 - Ekim 2009 dönemine ilişkin aylık net getiri verileri kullanılmaktadır. Genişletilmiş varlık fiyatlama modeli Fama & French‘in 3 faktörü, 3 adet hisse senedi endeksi faktörü, 5 adet tahvil/bono endeksi faktörü ve bir adet emtia endeksi faktörü olmak üzere toplam 12 faktörden oluşmaktadır. Yatırım yapılabilir hedge fonu endekslerinin performans özelliklerine dönük çalışma; yatırım yapılabilir hedge fonu endekslerinin yatırımcılarına anlamlı düzeylerde mutlak getiri sağlamada başarısız olduklarını ve ana yatırım stratejileriyle paralel varlık sınıflarına yatırım yaptıklarını ortaya çıkarmaktadır.
v
ACKNOWLEDGMENTS
I would like to thank my supervisor Assoc. Dr. Levent Akdeniz for his patience and guidance throughout this study. He was always with me whenever I needed advice, which extended beyond academic studies. I feel extremely privileged for having been the student of such an honorable teacher.
I am thankful to Assoc. Dr. Aslıhan Salih Altay for her guidance from the beginning of my graduate study till the end of this thesis.
I am grateful to Assist. Prof. Ümit Özlale, for his valuable comments throughout this thesis.
I would like to thank Hedge Fund Research Inc. and Eren Merzeci for the data support they provided for my graduate study.
I am also indebted to my wife Lütfiye Erdurmuş, for the unconditional support and encouragement she gave me for the completion of this thesis. Without her, it would simply be impossible for me to complete this study.
vi TABLE OF CONTENTS ABSTRACT ... iii ÖZET ... iv ACKNOWLEDGMENTS ... v TABLE OF CONTENTS ... vi
LIST OF TABLES ... vii
CHAPTER 1: INTRODUCTION ... 1
CHAPTER 2: LITERATURE REVIEW ... 8
CHAPTER 3: DATA AND METHODOLOGY ... 21
3.1 Empirical Data ... 21 3.2 Methodology ... 26 CHAPTER 4: ANALYSIS ... 29 4.1 Descriptive Statistics ... 29 4.2 Regression Analysis ... 39 4.2.1 General Results ... 41
4.2.2 Strategy Level Results ... 48
CHAPTER 5: EFFECTS OF CRISES ON HEDGE FUNDS ... 52
CHAPTER 6: SUMMARY AND CONCLUSIONS ... 57
SELECTED BIBLIOGRAPHY ... 61
APPENDICES ... 66
APPENDIX A: HEDGE FUND INDEX DESCRIPTIONS ... 66
APPENDIX B: INDEX GLOSSARY ... 71
vii
LIST OF TABLES
Table 1:Data Vendors ... 22
Table 2:Comparison fo Non Investable and Investable HFR Indexes ... 23
Table 3:Index Construction Procedure ... 25
Table 4:Descriptive Statistics of Investable Hedge Fund Indexes ... 32
Table 5:Descriptive Statistics of Independent Variables ... 35
Table 6:Pairwise Correlations of Independent Variables ... 37
Table 7:Unit Root Test Results For Strategies and Regressors ... 38
Table 8:Regression Results (GMM) ... 42
Table 9:Regression Results (OLS) ... 43
Table 10:Regression Results (Full Period-GMM) ... 53
1
CHAPTER 1
INTRODUCTION
Although hedge funds have become popular in recent years and displayed a tremendous growth both in number of funds and portfolio holdings they have a history of more than fifty years in financial markets. Alfred Winslow Jones founded first hedge fund fifty years ago. Hedge funds lost their popularity during 1969-1970 and 1973-74 bear markets since they realized substantial losses. (Agarwal and Naik (2005)) According to the industry reports1 net asset value of hedge funds was just 39 billion US Dollars in 1990. It tremendously increased to 2.132 billion US Dollars in 2008. According to Hedge Fund Research the number of hedge funds increased from 592 to 9.611 from 1990 to 2008. The hedge fund industry continued its recovery from the financial crisis of 2008 by posting the strongest gains since 1999. The strong performance of hedge funds compensated for investor redemptions in the
1
2
crises. Global hedge fund assets increased to $1.6 trillion level at the end of year 2009.2
Investment strategies of hedge funds have significantly changed recently. Hedge funds have incorporated dynamic trading environment into their investment strategies. Indeed most of the hedge funds currently do not hedge market risk. The term ―hedge‖ sometimes leads to investor illusions. Investors consider that these funds hedge all their positions and do not take market risk. Hedge funds target absolute returns independent from the market conditions. Portfolio management of hedge funds is carried out by the unlimited liability partner. The unlimited liability partner usually has a stake of 20-25% in fund assets. Fund managers take a performance fee of near to 20-25% of profits. Fund managers are essentially motivated by this performance fee.
It is impossible to get a unique and globally accepted description of hedge funds in the sector since hedge funds offer a wide variety of investment strategies to the accredited (qualified) investors.3 Hedge funds are the alternative investment funds which are sold to restrictive number of investors. They have flexible
2
HFR Global Hedge Fund Industry Report - Year End 2009.
3
The accredited investor definition can be found in the Securities Act of 1933. The definition is: Accredited investor shall mean any person who comes within any of the mentioned categories, or who the issuer reasonably believes comes within any of the following categories, at the time of the sale of the securities to that person. With regard to individual investors, the most common of the requirements is the $1 million dollar net worth (which does include assets such as a personal residence). With regard to institutional investors, the most commonly used category is that an entity with at least $5 million dollars in assets.
3
investment limits and dynamic trading strategies. They are unregulated financial entities. Profit generation abilities of hedge funds stem from the flexible and dynamic investment strategies. Hedge funds can have different investment opportunities by implementing these strategies. These investment opportunities provide hedge funds diversification benefits which cannot be achieved by traditional asset classes such as equities and bonds. The performance of hedge funds can be divided into two components. One of them depends on fund manager‘s skill. It is called as alpha return. The other component depends on the investment strategy of hedge funds. It is called as beta return. Hedge funds always target positive returns which are called as absolute returns. Hedge funds should have large positive alpha returns to have positive absolute returns in case of negative beta returns. This search for positive absolute return by the fund manager is the driving force of hedge fund investments.
Most of the hedge funds are located on off shore regions. They are founded as limited partnerships to circumvent regulations for investment funds. They are exempted from legal regulations since they have limited numbers of investors and limited numbers of partners. Hedge funds are not registered with the legal authorities since they are sold to qualified investors on a private placement basis. They have limited liabilities in terms of information dissemination to the public. They use different dynamic trading strategies such as short selling, use of derivatives, use of leverage etc. Regulations of hedge funds depend on country jurisdictions. They have an important role for the development of hedge fund industry. While rule based regulations are common in USA, hedge funds face principle based regulations in Europe.
4
Hedge funds limit the number of their investors (maximum 100) in US. They are sold just to the qualified investors to be exempted from Securities Act of 1933. According to the Investment Advisers Act of 1940, investor advisors who have less than 15 clients for the latest 12 months do not have to register with Securities and Exchange Commission (SEC). Due to this rule, investment advisors of hedge funds have limited number of clients. Investment advisors do not have to register with SEC in terms of the traditional ―client‖ definition. On the other hand a few managers voluntarily choose to register with SEC since this registration provides them credibility and prestige. Despite loose regulations, hedge funds in US are self regulated within their sector since investor base in hedge funds has significantly shifted from wealthy individual investors to institutional investors such as pension funds, university endowment funds etc. This shift in investor type has led hedge funds to be more transparent and accountable to their investors.
Hedge funds are regulated within the mutual funds regulations4 in Turkey. They are regulated as a special type of mutual funds which have loose investment restrictions. They can be sold to just qualified investors. Qualified investors are investment funds, pension funds, investment trusts, intermediaries, banks, insurance companies, asset management companies, mortgage finance companies, foundations or other investors authorized by the board according to the related communiqué. Hedge funds cannot advertise their performance data to the public. They have to calculate net asset value at least monthly. They can determine redemption periods
4
5
longer than one month. Their participation units cannot be traded over exchanges. They are exempted from daily reporting and semiannual auditing of financial tables.
Data about hedge funds can be accessible via private data vendors since these funds offer little transparency in terms of their investments, portfolio holdings and strategies. These data vendors collect individual hedge funds data and disseminate them to qualified investors. These data vendors also group their database funds into strategy classes. They produce strategy indexes and publish these indexes over their web sites. One of these data vendors is Hedge Fund Research (HFR). HFR also publishes investable hedge fund strategy indexes which can be used as alternative investment tool by the prospective investors.
This thesis basically aims to discover the performance characteristics of different investable hedge fund strategies to extend the understanding of investors about hedge funds performance characteristics. Unlike the most of hedge fund studies, this study is the first that focuses on the performance characteristics of investable hedge funds indexes.
Hedge funds managers have the flexibility to invest on a wide range of asset classes like equities, government and corporate bonds, derivatives, emerging markets instruments, currencies etc. On the other hand these funds offer little transparency in terms of their investment strategies and portfolio holdings. We use multifactor regression models to discover performance characteristics of investable hedge fund
6
indexes. We employ both OLS and GMM techniques to analyze returns of different investable hedge fund indexes. First we expect significant factor loadings parallel to their main investment strategy for different hedge fund indexes. As an example, we expect that returns of short bias strategy index will have negatively significant factor exposures on market index whereas returns of emerging markets strategy index will have positively significant factor exposures on emerging markets asset classes. Secondly we expect that investable hedge fund indexes will have positive alpha returns since hedge funds target absolute returns.
We conduct regression analysis for different investable hedge fund indexes. Regression results reveal that significance and coefficient levels of regressors improve with GMM method. We find out that the coefficient of constant term in absolute terms is higher (less) than the OLS regression estimates in twelve (six) of the strategies for GMM regression estimates. This finding gives us an important clue that ranking of hedge funds in terms of their absolute returns will be biased if one uses OLS regression estimates rather than GMM regression estimates. This finding has valuable insights for portfolio managers and portfolio selection process. The performance analysis reveals that hedge funds fail to deliver significant positive excess returns. Hedge funds invest in US bonds, non US stocks, emerging market stocks and low book-to-market value stocks. Hedge funds rarely invest in US stocks.
The remaining of the thesis is organized as follows: Chapter 2 presents information about the literature on performance studies of hedge funds. We overview
7
micro, macro and mixed multi factor models. Chapter 3 introduces the data used and methodology employed in this thesis. Chapter 4 discusses the descriptive statistics of the returns of investable hedge fund indexes. Then we conduct OLS and GMM regression analyses by using our extended multi factor model. Chapter 5 presents conclusions.
8
CHAPTER 2
LITERATURE REVIEW
Hedge funds offer little transparency in terms of their investment strategies and portfolio holdings since they are designed for accredited (qualified) investors. In some jurisdictions like US, hedge funds can not disclose their performance data to the public. Due to limited transparency, hedge funds data can be only accessible via private data vendors5. These data vendors collect individual hedge funds data and just disseminate these data to qualified investors. Due to this feature of hedge funds there are a few commercial databases which collect individual hedge funds data on a voluntary basis and disseminate these data to potential qualified investors. These databases consist of different numbers of hedge funds. There are several differences among them in terms of representativeness of hedge fund universe. These data vendors also group their database funds into strategy classes. They produce strategy indexes (equal and asset weighted) and publish these indexes on their web sites. In
5
9
literature, empirical performance studies of hedge funds can offer different results according to the database and chosen data period due to limited representativeness of hedge fund data.
Although hedge funds are an alternative class of investment universe since 1950‘s, due to lack of data we are unable to see academic studies on hedge funds until 2000‘s. Hedge funds have become popular alternative investment class after 2000‘s therefore academic studies on this alternative investment class rapidly increased.
Research on hedge funds can be grouped under the following categories: performance comparison of hedge funds with mutual funds; analysis of risk and return characteristics of hedge funds using multi factor models; analysis of investment strategies; analysis of manager skills; performance persistence of hedge funds; effects of hedge funds on systemic risk etc.
Multi factor models which are used to analyze return characteristics of hedge funds can be divided into three groups. First group uses macro factors such as equity indexes, bond indexes, commodity indexes and interest rates. Hedge funds mainly invest on these asset classes. Second group uses micro factors related with hedge funds such as fund age, incentive fee, management fee, strategy etc. Third group uses both micro and macro factors within the same model to analyze hedge funds return characteristics. Selected fundamental articles from these groups are presented below.
10
Ackermann, McEnally and Ravenscraft (1999) use a large sample of monthly hedge fund return data from 1988 to 1995 obtained from Managed Account Reports (MAR) and Hedge Fund Research (HFR). Ackermann et al. analyze hedge fund performance using both U.S. and offshore funds to provide potential explanation for the outperformance of hedge funds by linking incentive fee to performance. Ackermann et al. use multiple regression models since variables do not have serious multicolinearity among them. According to Ackermann et al. the ability of hedge funds to outperform the market clearly depends on the time period, the market index and the hedge fund category. They account for total risk and use Sharpe ratio (Sharpe (1966)) instead of raw returns for their regression models. Sharpe ratio is calculated by deducting riskless asset return from the raw returns of individual hedge fund and dividing it by the standard deviation of individual hedge fund return over studied period. Ackermann et al. find that hedge funds outperform mutual funds even on a risk adjusted basis. Ackermann et al. also use micro factors; management fee, incentive fee, age, US vs. offshore and fund categories; to explain the effects of hedge fund characteristics on risk adjusted performance and volatility of funds. Incentive fee consistently explains risk adjusted performance whereas it has negligible effect on the volatility of returns according to Ackermann et al. It is documented that management fees consistently raise total risk and reduce Sharpe ratios. Fund age does not have significant effects on risk or return. Ackermann et al. also discuss the possibility of six data conditioning biases such as survivor bias, termination bias, self selection bias, liquidation bias, backfilling bias, multi period sampling bias.
11
Agarwal and Naik (1999) use a new database of ten hedge fund indexes compiled by HFR to present a comprehensive analysis of risk-return characteristics, risk exposures and performance persistence of various hedge fund strategies. Agarwal and Naik (1999) use several asset classes to capture the different investment opportunities available to hedge funds in a multi factor model. Their model uses macro factors such as S&P 500 Composite Index, MSCI World Excluding US Index, MSCI Emerging Markets Index, Salomon Brothers World Government Bond Index, Salomon Brothers World Government & Corporate Bond Index, Lehman High Yield Composite Index, FED Trade Weighted Dollar Index, UK Market Price Index for Gold. Agarwal and Naik (1999) also make a distinction between hedge fund indexes such as directional (fixed income arbitrage, event driven, equity hedge, restructuring, event arbitrage, capital structure arbitrage) and non directional (macro, long, long bias, short bias) hedge fund strategies. The data consists of monthly returns of individual hedge funds from January 1994 to September 1998. Agarwal and Naik (1999) document that non directional strategies perform better than directional strategies based on several risk-return characteristics. The average return of non directional strategies (0, 94 % per month) exceeds the average return of directional strategies (0, 71 % per month) during the studied period. According to Agarwal and Naik (1999) standard deviations of non directional strategies are lower than those of directional strategies. It is documented that inclusion of hedge funds to the traditional portfolios provides better opportunities for diversification in a mean-variance framework. A mix of traditional asset classes and hedge funds investment in hedge funds, mainly non directional and passive indexing offer significantly better risk-return tradeoff compared to sole investments in traditional asset classes. Agarwal and Naik (1999) find evidences that directional strategies have substantial exposures to
12
US equities, emerging market equities and currencies, while non directional strategies have substantial exposures to currencies and bond indexes. These findings are consistent with the investment objectives of the different hedge fund strategies. Agarwal and Naik (1999) find reasonable amount of persistence which is driven more by losers rather than by winners for the performance persistence analysis.
Liang (1999) studies hedge fund performance and risk characteristics by using HFR data from January 1994 to December 1996. The author requires all funds to have consecutive 36 monthly return histories to study hedge fund performance and risk characteristics. The article sheds light on the relationship between hedge fund performance and fund characteristics by using an asset class factor model. The macro factors are S&P 500 Composite Index, MSCI World Excluding US Index, MSCI Emerging Markets Index, Salomon Brothers World Government Bond Index, Salomon Brothers World Government & Corporate Bond Index, Gold price for commodities, FED Trade Weighted Dollar Index, One Month Eurodollar Deposit for cash. Liang (1999) uses a stepwise regression to select variables according to the standard AIC criterion like Agarwal and Naik (1999) since few of variables are correlated to each other. Liang (1999) aims to mitigate collinearity problems among variables and to simplify the regression results with this methodology. The analyzed hedge fund strategy indexes are composite, convertible arbitrage, distressed securities, emerging markets, fixed income, foreign exchange, funds of funds, growth, macro, market neutral, market timing, merger arbitrage, opportunistic, sector, short selling and value strategies. Liang (1999) reports that half of strategies invest in US equity. The range of R2‘s is from 0,23 to 0,77 which indicates relatively
13
low correlation between returns of hedge fund and returns of standard asset classes. This finding is explained by dynamic trading strategies of hedge funds like Fung and Hsieh (1997). He also finds that strategies have higher factor loadings on their base investment asset class. Emerging markets funds have a factor loading of 0,58 on the emerging market index. It is documented that there are seven hedge fund strategies which earn significantly positive abnormal returns. All unexplained returns range from -5,22% to 1,26% per month. Another regression model uses micro factors such as management fee, incentive fee, age, assets and lock up periods to explain average returns of fund strategies. Liang (1999) finds that incentive fee has a significantly positive effect on fund performance like Ackermann, McEnally and Ravenscraft (1999). 1% increase in the incentive fee will increase the average monthly return by 1,3%. He also documents that the longer the lockup periods the better the fund performance. Moreover Liang (1999) finds that hedge funds offer higher Sharpe ratios, higher abnormal returns, and lower systematic risks than mutual funds.
Edwards and Caglayan (2001) use monthly hedge funds returns data of MAR from 1990 to 1998. Edwards and Caglayan (2001) use two different factor models to explain excess returns of eight hedge fund strategies which are funds of funds, event driven, global macro, global, long only, market neutral, sector, short sell strategies. Their primary model uses macro factors such as S&P 500 Index, HML, SML, TERM (monthly return on a long term government bond portfolio minus the one month lagged 30 day T-Bill return), DEF (monthly return on a portfolio of long term corporate bonds minus the monthly return on a portfolio of long term government). Edwards and Caglayan (2001) use primary model to estimate excess returns of hedge
14
fund strategies. They find that annualized excess returns are lower than absolute excess returns (average return-T-Bill rate) for directional trading strategies. Sharpe ratio rankings of strategies are consistent with the rankings of strategies according to the alphas. Edwards and Caglayan (2001) use another multi factor model to analysis excess returns from the primary factor model. This second model uses micro factors such as management fee, incentive fee, age and size to explain average excess returns of fund strategies since significant differences among alternative measures of excess returns for hedge fund strategies are observed. Edwards and Caglayan (2001) find that incentive fee is statistically significant and positively related to excess returns for all hedge funds. A positive coefficient on the size variable indicates that hedge fund performance increases at a declining rate as fund size increases. Edwards and Caglayan (2001) also test for performance persistence using both parametric and non parametric tests. It is documented that performance persistence exists among top performing hedge funds as well as among losers like Agarwal and Naik (1999).
Capocci and Hübner (2004) use an aggregated hedge fund database from HFR and MAR to analyze performance characteristics of hedge funds by using various multi factor asset pricing models similar to Ackermann et al. (1999). Capocci and Hübner (2004) extensively analyze performance measurement models such as the classical Capital Asset Pricing Model (CAPM) developed by Sharpe (1964) and Lintner (1965), the three factors model of Fama and French (1993), international version of Fama and French, the four factors model of Carhart (1997) and an extended multi factor model. The extended model uses macro factors such as Russell 3000 Index, MSCI World Index excluding US, Lehman Aggregate US Bond Index,
15
Salomon World Government Bond Index, JP Morgan Emerging Markets Bond Index, Lehman BAA Corporate Bond Index, Goldman Sachs Commodity Index, momentum factor of Carhart (1997), SMB, HML and IHML to explain excess returns of several hedge fund strategies for different sub periods. Capocci and Hübner (2004) calculate and present several data biases such as survivorship bias and instant return history bias. Their findings indicate that hedge funds deliver significant excess returns, seem to prefer smaller stocks, invest in emerging markets bonds and suffer from the US bond markets. Their extended model explains hedge funds behavior better than previous models since average adjusted R2 increases from 0,44 for the single factor model to 0,66 for the extended model. Capocci and Hübner (2004) also test for performance persistence in hedge funds. It is documented that performance persistence does not exist for best and worst performing hedge funds while there is weak evidence of performance persistence for middle deciles funds.
Fung and Hsieh (1997) extend Sharpe‘s (1992) asset class factor model. Fung and Hsieh (1997) apply this model to the hedge funds by using macro factors such as MSCI U.S. equities, MSCI non-U.S. equities, IFC emerging market equities, JP Morgan U.S. government bonds, JP Morgan non-U.S. government bonds, 1-month Eurodollar deposit, the price of gold and Federal Reserve‘s Trade Weighted Dollar Index to explain hedge fund performance. Paradigm LDC and TASS hedge funds data are used in their study. Fung and Hsieh (1997) run the Sharpe‘s style regression for both mutual funds and hedge funds. They compare the regression results of hedge funds with the regression results of mutual funds. Striking differences in terms of R2‘s are documented. While more than half of mutual funds have R2‘s above 75%,
16
half of hedge funds have R2‘s below 25%. Unlike mutual funds, 25% of hedge funds are negatively correlated with the standard asset classes. They concluded that hedge funds which employ dynamic trading strategies are different from mutual funds which employ buy and hold trading strategies. Fung and Hsieh (1997) extend Sharpe‘s model by adding high yield bonds to the model. This extended model is used over the five style factors (value, distressed, systems/opportunistic, systems/trend following, global/macro). These style factors are extracted from the hedge fund performance data with the principal component analysis. Fung and Hsieh (1997) find that two systems factors have low R2‘s while the other three factors have greater R2‘s. Fung and Hsieh (1997) also find that value style uses buy and hold strategy in US equities whereas the other four styles do not use buy and hold strategies in any asset classes.
Harvey and Sıddique (2000) points out the importance of systematic skewness for asset pricing models. They extend the traditional Fama and French‘s three factors model by adding coskewness6 to the model. Harvey and Sıddique (2000) hypothesize that if the asset returns have conditional skewness, expected returns should include a component attributable to skewness. Their model formalizes systematic skewness. Harvey and Sıddique (2000) estimate equity returns both
6 Harvey and Sıddique uses the direct measure of coskewness by using the residuals from the regression of the excess return on the contemporaneous market excess return. This measure represents the contribution of a security to the coskewness of a broader portfolio. A negative measure means that the security is adding negative skewness. According to classical utility assumptions, a stock with negative coskewness should have a higher expected return—that is, the premium should be negative. Another approach to estimating coskewness is to regress the asset return on the square of the market return. In our study second approach is used since data set consists of index returns not single fund returns unlike the Harvey and Sıddique (2000) case.
17
individually and jointly using their model. They find that the model including skewness is better to explain cross sectional variation of asset returns.
Racicot and Theoret (2007, 2008) extend multi factor analysis of hedge fund returns by incorporating higher moments to the asset factor models. Racicot and Theoret (2007, 2008) use higher moments for multi factor analysis of hedge fund returns since they document that hedge fund index returns display non normal distribution properties. Racicot and Theoret (2007, 2008) use HFR index returns and augmented Fama & French models. Racicot and Theoret (2007, 2008) analyze their model by using OLS, TSLS and GMM estimation methods. Racicot and Theoret (2007, 2008) extend the classical instruments of Chen, Roll and Ross (1986) factors (credit risk spreads, term structure of interest rates, dividend yields of stock market indexes, inflation rate, prices of commodities, growth of industrial production, exchange rates etc.) by adding lagged explanatory variables of the model. They also use higher moments of explanatory variables up to fifth power. It is evidenced that classical instruments give poor results within the context of hedge fund index returns. On the other hand higher moments of lagged explanatory variables of the models and higher moments of these variables up to fifth degree give better results for hedge fund index returns. Racicot and Theoret (2007, 2008) compare three different estimation methods. They find that coefficients estimated by TSLS and GMM estimation methods are close to those of the OLS estimation method. The slight decrease in alphas which are estimated by TSLS and GMM methods is interpreted as an overstatement of the absolute performance of the hedge funds.
18
There are several empirical studies on hedge fund performance characteristics. These studies use different versions of factor models. Steri et al. (2008) review various performance measurement models from Ackermann et al. (1999) to Capocci, Hübner (2004). Steri et al. (2008) use an aggregated factor model which includes both macro and micro factors such as asset size, prime broker, advisor, repayment frequency, notice days, management fee, incentive fee, age, fund administration, MSCI US Index, MSCI ex US Index, MSCI Emerging Markets Index, MSCI ex Italy Index, MSCI Japan Index, HML, SMB, Lehman Brother High Yield Bond Index, Goldman Sachs Commodity Index, Lehman Brothers Government and Corporate Bond Index, JP Morgan EMBI, growth rate of dollar/euro exchange rate to explain Italian funds of hedge funds performance characteristics by using panel data. Do et al. (2005) focus on empirical analysis of Australian hedge funds industry by using both macro and micro factor models. Factors of their model are S&P ASX500 Index, SMB, HML, Lehman Corporate Bond Index, Lehman Emerging Markets Index, JP Morgan Global Government Bond Index, Goldman Sachs Commodity Index, MSCI ex Australia Index, fund age, holding period, incentive fee, management fee and asset size. Do et al. (2005) also test for market timing ability of hedge fund managers by using ASX500 Index. Liang (2003) compares performance characteristics of hedge funds with CTA‘s by using an asset class factor model. Ranaldo and Favre (2003) study four moments CAPM model to explain hedge fund performance characteristics. Ranaldo and Favre (2003) use both traditional and quadratic CAPM models. Brown et al. (1998) examine the performance characteristics of the off shore hedge fund industry over the period of 1989-1995. Gupta et al. (2003) evaluates performance characteristics of hedge funds by using conditional approaches and GMM methods. Ibbotson and Chen (2006)
19
decompose hedge fund returns into three components. These are the value added by hedge funds (alpha), the value added by systematic market exposures (beta) and the hedge fund fees (costs). Ibbotson and Chen (2006) estimate an average return of 12,72%. This can be divided into three as a fee (3,74%), an alpha return (3,04) and beta return (5,94%).
According to Stultz (2007), hedge funds will converge to traditional mutual funds and traditional mutual fund will converge to the hedge funds in the future. Mutual funds will use investment instruments which are currently used by hedge funds. Stultz articulate that hedge funds will converge to the traditional mutual funds since the strategies and investment tools which are used by hedge funds will be eventually lessened by the nature of the perfect competition within the industry. There are several developments in the hedge funds sector which confirm this convergence trend. In fact tremendous growth in numbers of hedge funds justify this articulation since there will be less arbitrage opportunities for the hedge funds in the future. National authorities have taken lots of regulatory actions for the hedge funds during recent financial crises. Increasing numbers of funds of hedge funds and alternative mutual funds7 which are initiated by hedge fund managers to reap the savings of retail investors can be considered as weak evidences of this convergence in hedge fund industry. Another instrument is investable hedge funds indexes which can be invested by using separately managed accounts by retail investors. These new
7 The Economist print edition, Jan 7th 2010. Alternative mutual funds: The feeling is mutual: Hedge-fund managers look to retail investors
20
developments in hedge funds industry give the motivation to study performance characteristics of investable hedge fund indexes.
It can be seen that performance studies of hedge funds can be divided into macro, micro and mixed factors models from the brief literature review. It is common to use hedge fund strategy indexes data as well as single hedge funds data for performance analysis though these hedge fund strategy indexes are not investable. This thesis targets to analyze performance characteristics of investable hedge fund strategy indexes through a multi factor asset class model which uses several asset classes such that hedge funds invest on.
21
CHAPTER 3
DATA AND METHODOLOGY
3.1 Empirical Data
Several data vendors publish hedge fund indexes over their web sites. These indexes are constructed from their database funds. A few of these data vendors do not have individual funds data so that they construct indexes from other data sources. There is no agreement on strategy classification and index construction in hedge fund industry. Different data vendors classify their database funds into several strategy classifications. They construct strategy indexes according to these strategy classifications by using different methodologies such as value weighted, equal weighted, principal component analysis, and representative optimization. It is preferable to use indexes provided by data vendors which have individual hedge fund data since none of these data vendors completely represents hedge fund universe. One should be careful while using the data of hedge fund indexes which are
22
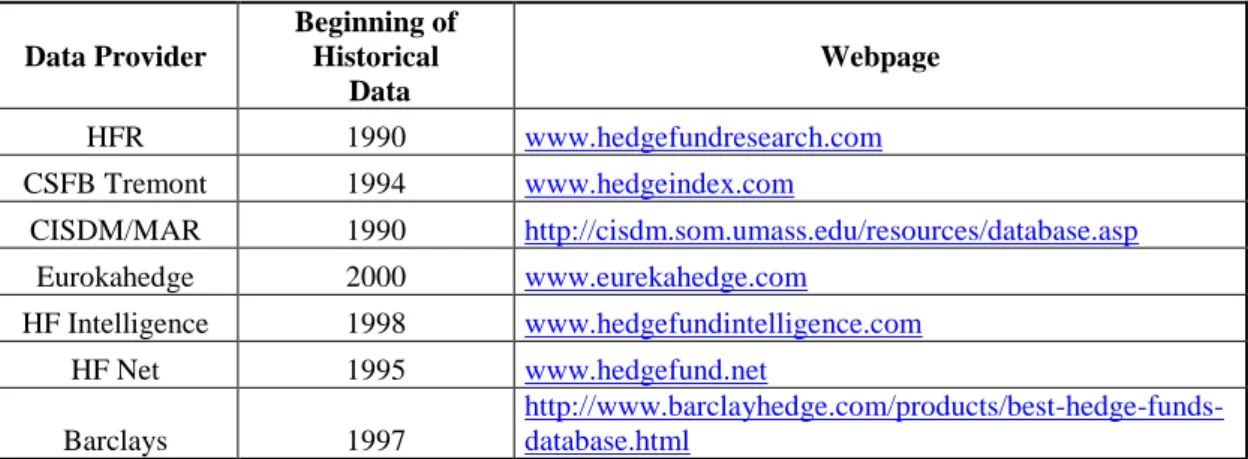
constructed from other data vendors‘ data. This type of secondary data can have several data biases which are widely documented in literature. These data biases can negatively affect the empirical results so that our data universe for the hedge fund indexes contracts to several data vendors which have primary fund information. Main data vendors are presented at the following table.
Table 1 Data Vendors Data Provider Beginning of Historical Data Webpage HFR 1990 www.hedgefundresearch.com CSFB Tremont 1994 www.hedgeindex.com CISDM/MAR 1990 http://cisdm.som.umass.edu/resources/database.asp Eurokahedge 2000 www.eurekahedge.com HF Intelligence 1998 www.hedgefundintelligence.com HF Net 1995 www.hedgefund.net Barclays 1997 http://www.barclayhedge.com/products/best-hedge-funds-database.html
Note: This table presents main data vendors and beginning of their historical data. There are also several data vendors which provide secondary information about hedge funds. They are not included in the table.
There are several differences between investable and non investable hedge fund indexes. Non investable hedge fund indexes are common. On the other hand they are not investable. Individual investors can not invest on these hedge fund indexes so that these indexes cannot be used as alternative investment tool. These indexes can be used as an indicator of the related hedge fund strategy. On the other hand investable hedge funds indexes can be used as an alternative investment tool by individual investors. Constituent funds of investable hedge funds indexes are naturally less than those of non investable hedge funds indexes due to costly disclosure requirements for constituent funds. It is convenient to compare
23
performance characteristics of investable hedge fund indexes with the performance characteristics of the traditional asset classes.
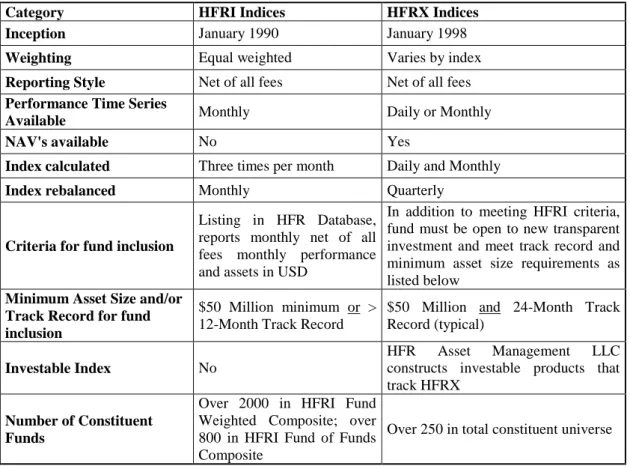
Table 2 presents the comparison of non investable HFR indexes (HFRI) and investable HFR indexes (HFRX).
Table 2
Comparison of Non Investable and Investable HFR Indexes
Category HFRI Indices HFRX Indices Inception January 1990 January 1998
Weighting Equal weighted Varies by index
Reporting Style Net of all fees Net of all fees
Performance Time Series
Available Monthly Daily or Monthly NAV's available No Yes
Index calculated Three times per month Daily and Monthly
Index rebalanced Monthly Quarterly
Criteria for fund inclusion
Listing in HFR Database, reports monthly net of all fees monthly performance and assets in USD
In addition to meeting HFRI criteria, fund must be open to new transparent investment and meet track record and minimum asset size requirements as listed below
Minimum Asset Size and/or Track Record for fund inclusion
$50 Million minimum or > 12-Month Track Record
$50 Million and 24-Month Track Record (typical)
Investable Index No
HFR Asset Management LLC
constructs investable products that track HFRX
Number of Constituent Funds
Over 2000 in HFRI Fund Weighted Composite; over 800 in HFRI Fund of Funds Composite
Over 250 in total constituent universe
Source: https://www.hedgefundresearch.com
In this study, we use monthly returns of HFR investable hedge fund indexes from January 2005 to October 2009. We choose this period since it covers official data of investable hedge fund indexes. Pro forma data is also available from 1998 to
24
2003 since data of investable hedge fund indexes are officially launched at 2003. We did not choose to use the data from 1998 to 2003 since the data of this period comprised of theoretical values. According to the HFR webpage;
The HFRX Indexes (HFRX) is series of benchmarks of hedge fund industry performance. HFRX are engineered to achieve representative performance of a larger universe of hedge fund strategies. HFR employs the HFRX Methodology (UCITS III compliant) which is a proprietary and highly quantitative process by which hedge funds are selected as constituents for the HFRX Indexes. This methodology includes robust classification, cluster analysis, correlation analysis, advanced optimization and Monte Carlo simulations. HFRX Methodology defines certain qualitative characteristics, such as transparent fund investment, due diligence requirements. HFRX Methodology produces a model output which selects funds which have the highest statistical likelihood of producing return series which are most representative of the reference universe of strategies. Constituents of HFRX Indexes are selected and weighted by the complex and robust methodology. The model output constitutes a sub-set of strategies which are representative of a larger universe of hedge fund strategies, geographic constituencies or groupings of funds maintaining certain specific characteristics. In order to be considered for inclusion in the HFRX Indexes, a hedge fund must be currently open to new transparent investment, maintain a minimum asset size (typically $50 Million) and meet the duration requirement (24 month track record). These criteria may vary slightly by index.
25 Table 3
Index Construction Procedure
HFR screens approximately 7,000 hedge funds to identify those firms with at least $50 million AUM and a minimum two-year track record that are also willing to trade on a transparent basis and are open to new assets
Cluster and correlation analyses are performed to group managers by true strategy categories and to eliminate outliers
Monte Carlo Simulation helps determine the adequate number and types of managers to replicate each strategy
Selected managers must provide transparency and pass extensive qualitative screening
Manager investments are then weighted to maximize correlation with their group
Source: https://www.hedgefundresearch.com
The HFRX Indexes are investable through tracker funds which are constructed by HFR Asset Management LLC, a registered investment adviser and asset management company. Investors can invest on these tracker funds via separately managed accounts. These tracker funds try to replicate related HFRX index. The index descriptions presented in Appendix A.
Monthly returns of hedge fund indexes are provided by HFR. SMB and HML data are provided by Kenneth French‘s data library. Rf is taken from FED web site. Other independent variables are provided by DataStream. These are
26
RBARCORPBAA for corporate bonds, IHML for international value, RM for US equities, RMSCIXUS for non US equities, RJPMEMBI for emerging markets bonds, RMSCIEM for emerging markets equities, RBARUSAGG for US bonds, RBARGLOBAGG for global bonds markets, RBARHYLD high yield corporate bonds (distressed securities) and RGSCI for commodities. Detailed information about market indexes can be found in Appendix B.
3.2 Methodology
This study aims to infer about the performance characteristics of investable hedge fund indexes by using their monthly performance data. A multi factor model will be developed to understand how these funds managers achieve absolute return over several markets indexes. These market indexes are benchmarks of main asset classes. Hedge funds managers invest in these asset classes
This study helps us to understand investments strategies of hedge funds managers. We analyze performance characteristics of hedge funds by using a multi factor model. This model uses market indexes which are accepted as market benchmarks. This aggregate multi factor model is like Capocci and Hübner‘s (2004) extended model. The model uses just macro factors since our data set do not include any micro factors such as fund age, performance fee.
Multiple regression models are constructed to analyze performance characteristics of investable hedge fund indexes. Factor exposures of investable
27
hedge fund returns to the several market indexes are estimated by using investable hedge fund returns as dependent variables and returns of market indexes as independent variables. All statistical analyses are carried out by using E-Views. The model investigates the relationship between investable hedge fund returns and returns of several market indexes. Several market indexes are used in our model since hedge funds invest in a wide range of asset classes. Market indexes are RBARCORPBAA for corporate bonds, SMB for size, HML for value, IHML for international value, RM for US equities, RMSCIXUS for non US equities, RJPMEMBI for emerging markets bonds, RMSCIEM for emerging markets equities, RBARUSAGG for US bonds, RBARGLOBAGG for global bonds markets, RBARHYLD high yield corporate bonds (distressed securities) and RGSCI for commodities.
where Fit is the excess return of factor (i) for the time period (t).
In open form;
Ri - Rf = { αi + β1 [RMt]+ β2 [SMBt] + β3 [HMLt] + β4 [IHMLt] + β5 [RMSCIXUSt] + β6 [RMSCIEMt ] + β7 [RJPMEMBIt] + β8 [RBARUSAGGt] + β9 [RBARCORPBAAt] + β10 [RBARGLOBAGGt] + β11 [RBARHYLDt] + β12 [RGSCIt] + t }
All variables other than SMB, HML and IHML are adjusted for risk free rate (one month T-Bill Rate of FED) since hedge funds target absolute returns. This formulization also has the flexibility to interpret alpha estimates as a rough measure
28
of absolute returns of related hedge fund index. Definitions of model variables presented below.
αit = Constant term.
βit = Coefficient of related asset class excess return. Rit = Return of Investable Hedge Fund Strategy Index.
Rf = One month Treasury bill secondary market rate on a discount basis. RM = Excess Return of Russell 3000 Price Index.
SMB = Size Factor (Small Minus Big).
HML = Book to Market Equity Factor (High Minus Low).
IHML = International Version of HML. (Calculated as MSCI Global Value Index Return minus MSCI Global Growth Index Return)
RMSCIXUS = Excess Return of MSCI World Excluding US Index. RMSCIEM = Excess Return of MSCI Emerging Markets Index.
RJPMEMBI = Excess Return of JP Morgan Emerging Markets Bond Index. RBARUSAGG = Excess Return of Barclays US Aggregate Bond Index. RBARCORPBAA = Excess Return of Barclays US Corp. BAA Bond Index. RBARGLOBAGG = Excess Return of Barclays Global Agg. Bond Index. RBARHYLD = Excess Return of Barclays Global High Yield Bond Index. RGSCI = Excess Return of S&P GSCI Commodity Index.
29
CHAPTER 4
ANALYSIS
4.1 Descriptive Statistics
The data set used in this study reveals the following descriptive statistics at a first glance. The data period is from January 2005 to October 2009. Table 4 presents descriptive statistics of eighteen investable hedge fund indexes.
Table 4 shows that the range of mean returns of investable hedge fund indexes is %-0,68-%1,03. Convertible arbitrage strategy has the lowest mean return whereas commodity strategy has the highest mean return. While mean returns of thirteen strategies are positive, mean returns of five strategies are negative during studied period. To make an inference about the performance of strategies by just looking at mean returns will be misleading since we observe that return distributions of hedge fund strategies are not normal. Due to this fact, it is preferable to look at the median return values of strategies. As it can be seen from Table 4, all hedge fund
30
strategies except for distressed and short bias strategies have positive median values. The range of median values is %-0,10-%1,28. Fundamental growth strategy has the highest median value while short bias strategy has the lowest median value. The range of standard deviations of returns is %1,06-%5,67. Convertible arbitrage strategy has the highest dispersion around the mean value while equity market neutral index has the lowest dispersion around the mean value.
It is apparent from Table 4 that skewness values of sixteen strategies are negative. This indicates that return distributions of strategies consist of mainly small positive returns and rarely big negative returns. Return distributions of strategies are also skewed to the left. On the other hand commodity and macro strategies have positive skewness values. Return distributions of strategies display platykurtic properties since kurtosis values of strategies are greater than normal distribution value of 3. We use the Jarque-Bera test statistics (JB) which uses the skewness and kurtosis values of a distribution to test the normality of return distributions of strategies. JB statistics reveal that return distributions of fourteen strategies are non normal. On the other hand, return distributions of fundamental growth, equity market neutral, macro and short bias strategies have normal distribution properties. Non normality of hedge fund returns can be explained by the dynamic trading strategies employed by hedge fund managers.
A look at the Sharpe ratios indicates that the range of Sharpe ratios is-0,25-0,40. Commodity strategy has the highest Sharpe ratio while distressed securities
31
strategy has the lowest Sharpe ratio. Although Sharpe ratios of strategies are relatively low, eleven of eighteen strategies have positive Sharpe ratios. Negative Sharpe ratios can be explained by the effects of recent financial crisis on the hedge funds.
32 Table 4
Descriptive Statistics of Investable Hedge Fund Indexes
AGGR AR CA COM DS ED EHG EHMS EHV EMN EW GL M MA MD MEM RVA SB Mean 0.45 -0.08 -0.69 1.03 -0.50 0.12 0.70 0.67 0.16 0.02 -0.02 0.02 0.24 0.50 0.16 0.75 -0.01 0.11 Median 0.99 0.10 0.45 0.59 -0.03 0.83 1.29 1.28 0.59 0.15 0.41 0.35 0.07 0.70 0.99 1.26 0.44 -0.11 Maximum 3.70 1.81 6.73 9.11 2.10 3.15 6.97 8.01 3.82 2.45 2.28 3.15 8.54 2.32 5.20 5.11 6.81 7.48 Minimum -6.70 -4.39 -34.68 -2.08 -11.69 -7.53 -8.37 -10.51 -8.89 -2.75 -9.93 -9.35 -7.38 -2.85 -13.94 -11.00 -14.11 -11.80 Std. Dev. 1.97 1.22 5.67 2.32 2.38 2.14 3.51 3.44 2.47 1.06 1.96 2.18 2.82 1.06 3.26 2.89 3.15 3.60 Skewness -1.31 -1.29 -4.18 0.96 -2.83 -1.59 -0.39 -0.82 -1.41 -0.41 -2.74 -1.89 0.12 -1.08 -1.73 -1.50 -2.00 -0.45 Kurtosis 5.30 5.21 24.33 3.88 12.59 6.26 2.52 3.95 5.83 3.04 13.50 8.35 3.59 4.23 7.93 6.86 9.87 3.81 Sharpe Ratio 0.18 -0.15 -0.14 0.40 -0.26 0.01 0.17 0.17 0.02 -0.08 -0.06 -0.04 0.05 0.37 0.02 0.23 -0.03 0.00 JB Statistic 29.24 27.86 1267.69 10.78 299.68 50.10 2.03 8.68 38.56 1.61 339.01 103.79 0.96 14.88 87.47 57.71 152.65 3.52 Probability 0.00 0.00 0.00 0.00 0.00 0.00 0.36 0.01 0.00 0.45 0.00 0.00 0.62 0.00 0.00 0.00 0.00 0.17 Sum 26.19 -4.45 -39.90 59.91 -29.28 7.17 40.54 39.11 9.29 1.05 -0.91 0.99 13.86 28.90 9.32 43.67 -0.37 6.54 Sum Sq. Dev. 222.37 85.67 1837.57 306.93 323.01 262.82 704.60 675.15 349.32 64.48 219.82 272.30 453.65 64.81 606.99 477.57 569.06 738.83 Observations 58 58 58 58 58 58 58 58 58 58 58 58 58 58 58 58 58 58 This table presents descriptive statistics of returns of eighteen different investable hedge fund indexes for the period January 2005 to October 2009. Data set consists of 58 observations. The critical value of JB statistic with degrees of freedom two is 5,99. Mean risk free rate is used for Sharpe ratio calculations of indexes.
33
Table 5 presents the descriptive statistics of twelve independent variables. The range of mean returns of independent variables is %-0,23-%1,14. RGSCI has the highest mean return while IHML has the lowest mean return. While half of independent variables have positive mean returns half of them have negative mean returns during studied period. All independent variables except for IHML, RBARGLOBAGG and SMB have positive median values. The range of median values is %-0,28-%1,79. RGSCI has the highest median value while SMB has the lowest median value. The range of standard deviations of independent variables is %0,82-%8,87. RMSCIEM has the highest dispersion around the mean value while RBARGLOBAGG has the lowest dispersion around the mean value.
Table 5 shows that skewness values of nine independent variables are negative. This indicates that return distributions of independent variables consist of mainly small positive returns and rarely big negative returns. Return distributions of strategies are also skewed to the left. Return distributions of independent variables display platykurtic properties since kurtosis values of independent variables are greater than normal distribution value of 3. JB statistics reveal that return distributions of nine independent variables are non normal. On the other hand, return distributions of IHML, RBARGLOBAGG, RBARUSAGG and SMB have normal distribution properties.
A look at the Sharpe ratios indicates that the range of Sharpe ratios of independent variables is -0,18-0,21. It has a narrower range than those of hedge fund
34
indexes. RJPMEMBI has the highest Sharpe ratio while IHML has the lowest Sharpe ratio. Eight of twelve independent variables have negative Sharpe ratios. Positive Sharpe ratios are also relatively low. It is interesting that RM has also negative Sharpe ratio. Like hedge fund strategies, negative Sharpe ratios can be explained by the effects of recent financial crisis on the overall financial markets.
35 Table 5
Descriptive Statistics of Independent Variables
HML IHML RBAR CORPBAA
RBAR
GLOBAGG RBARHYLD
RBAR
USAGG RF RGSCI RJPMEMBI RM RMSCIEM RMSCIXUS SMB Mean 0.17 -0.23 -0.03 -0.01 -0.21 0.01 0.10 1.14 0.72 -0.01 0.54 -0.12 0.06 Median 0.05 -0.26 0.05 -0.05 0.09 0.06 0.12 1.80 0.99 0.29 1.31 0.86 -0.28 Maximum 7.58 4.07 4.84 2.48 10.90 3.36 0.16 21.10 8.52 9.88 14.28 11.02 5.34 Minimum -9.89 -5.06 -12.68 -1.40 -19.40 -2.76 0.00 -27.77 -13.79 -18.00 -37.93 -26.38 -4.18 Std. Dev. 2.88 1.89 2.53 0.82 4.09 1.05 0.05 8.06 2.95 4.79 8.87 6.25 2.27 Skewness -0.54 -0.11 -1.85 0.52 -1.51 0.45 -0.72 -0.72 -1.96 -1.07 -1.65 -1.65 0.33 Kurtosis 5.00 3.53 12.27 3.37 10.79 4.30 1.99 4.75 12.37 5.49 7.75 7.56 2.63 SR 0.02 -0.18 -0.05 -0.14 -0.08 -0.09 0.00 0.13 0.21 -0.02 0.05 -0.04 -0.02 Jarque-Bera 12.52 0.78 240.76 2.96 168.58 6.06 7.44 12.41 249.27 26.06 80.76 76.62 1.40 Probability 0.00 0.68 0.00 0.23 0.00 0.05 0.02 0.00 0.00 0.00 0.00 0.00 0.50 Sum 9.76 -13.59 -1.54 -0.80 -11.98 0.50 5.95 66.49 41.75 -0.60 31.12 -7.07 3.67 Sum Sq. Dev. 474 204 367 38 953 63 0.19 3703 497 1311 4493 2230 295 Observations 58 58 58 58 58 58 58 58 58 58 58 58 58 This table presents descriptive statistics of returns of thirteen different independent variables for the period January 2005 to October 2009. Data set consists of 58 observations. The critical value of JB statistic with degrees of freedom two is 5,99. Mean risk free rate is used for Sharpe ratio calculations of variables.
36
Table 6 reports correlations among independent variables. There is high variability between different independent variables, ranging from 0,94 (between RBARGLOBAGG and RBARUSAGG) to -0,36 (between RGSCI and IHML). Twenty-three correlation coefficients (30%) are greater than 0,50 and nine (12%) are negative. In particular, IHML are negatively correlated with other variables. On the other hand correlation coefficients are less than 0,90. Three of the pairwise correlations are greater than 0,90. The correlation between RBARGLOBAGG and RBARUSAGG is 0,94. This is expected since the weight of US fixed income securities outweighs other fixed income securities in global fixed income asset class index. Moreover the correlation between RMSCIXUS and RMSCIEM is 0,94. The correlation between RMSCIXUS and RM is 0,90. Stepwise regression techniques are used to overcome the multicollinearity problem among independent variables.
Lastly it is necessary to test series for stationarity since data set consists of several times series data. Stationarity issue is a common concept in times series data. We test data series for stationarity by using Augmented Dickey Fuller test (by including intercept in test equation, by using Schwarz Info Criterion and test for unit root in level data) for both independent and dependent variables in E-Views. Test results are shown in Table 7. A look at the p- values indicates that hedge fund strategy indexes don‘t have unit root processes. Independent variables don‘t have unit root processes while RBARHYLD have unit root processes with a confidence level of 10%. On the other hand RBARHYLD variable is used as regressor in just one of the regression equation out of eighteen regression equations.
37 Table 6
Pairwise Correlations of Independent Variables
HML IHML RBAR
CORPBAA RBARGLOBAGG RBARHYLD RBARUSAGG RGSCI RJPMEMBI RM RMSCIEM RMSCIXUS SMB
HML 1.00 0.70 0.05 0.05 0.22 0.03 0.14 0.16 0.26 0.17 0.35 0.24 IHML 0.70 1.00 -0.08 0.20 -0.07 0.11 -0.36 -0.03 -0.08 -0.20 -0.01 -0.02 RBARCORPBAA 0.05 -0.08 1.00 0.56 0.82 0.70 0.38 0.86 0.61 0.63 0.65 0.19 RBARGLOBAGG 0.05 0.20 0.56 1.00 0.19 0.94 -0.13 0.55 0.06 0.09 0.13 0.01 RBARHYLD 0.22 -0.07 0.82 0.19 1.00 0.35 0.46 0.83 0.80 0.77 0.80 0.36 RBARUSAGG 0.03 0.11 0.70 0.94 0.35 1.00 0.02 0.68 0.22 0.27 0.31 0.00 RGSCI 0.14 -0.36 0.38 -0.13 0.46 0.02 1.00 0.33 0.44 0.62 0.59 0.01 RJPMEMBI 0.16 -0.03 0.86 0.55 0.83 0.68 0.33 1.00 0.70 0.76 0.76 0.27 RM 0.26 -0.08 0.61 0.06 0.80 0.22 0.44 0.70 1.00 0.86 0.90 0.42 RMSCIEM 0.17 -0.20 0.63 0.09 0.77 0.27 0.62 0.76 0.86 1.00 0.94 0.25 RMSCIXUS 0.35 -0.01 0.65 0.13 0.80 0.31 0.59 0.76 0.90 0.94 1.00 0.27 SMB 0.24 -0.02 0.19 0.01 0.36 0.00 0.01 0.27 0.42 0.25 0.27 1.00
This table presents pairwise simple correlations of returns of twelve different independent variables for the period January 2005 to October 2009 with the 58 observations.
38 Table 7
Unit Root Test Results For Strategies and Independent Variables
ADF test results STRATEGIES ADF test results Independent Variables
Series Prob. Lag Max Lag Obs Series Prob. Lag Max Lag Obs
HFRXAGGR 0.00 0 12 57 HML 0.00 1 12 56 HFRXAR 0.00 0 12 57 IHML 0.00 0 12 57 HFRXCA 0.01 0 12 57 RBARCORPBAA 0.00 0 12 57 HFRXCOM 0.00 0 12 57 RBARGLOBAGG 0.00 1 12 56 HFRXDS 0.01 0 12 57 RBARHYLD 0.12 2 12 55 HFRXED 0.00 0 12 57 RBARUSAGG 0.00 1 12 56 HFRXEHG 0.00 0 12 57 RGSCI 0.00 0 12 57 HFRXEHMS 0.00 0 12 57 RJPMEMBI 0.00 1 12 56 HFRXEHV 0.00 0 12 57 RM 0.00 0 12 57 HFRXEMN 0.00 0 12 57 RMSCIEM 0.00 0 12 57 HFRXEW 0.00 0 12 57 RMSCIXUS 0.00 0 12 57 HFRXGL 0.00 0 12 57 SMB 0.00 0 12 57 HFRXM 0.00 1 12 56 HFRXMA 0.00 0 12 57
HFRXMD 0.00 0 12 57 Null Hypothesis: Unit root (individual unit root process)
ADF test details are follows:
-Exogenous variables: Individual effects -User specified maximum lags
-Automatic selection of lags based on SIC: 0 to 2
HFRXMEM 0.00 0 12 57
HFRXRVA 0.02 0 12 57
HFRXSB 0.00 0 12 57
39 4.2 Regression Analysis
We first run OLS regressions by including all the independent variables of our model. We got poor results since multicollinearity problems existed among same group of asset indexes. Due to this fact, we employed stepwise regression method to eliminate multicollinearity problem among same group of asset indexes. We chose the most relevant asset classes according to each hedge fund strategy like Agarwal and Naik (1999) and Liang (1999) did.
OLS results disseminate serial correlation and heteroskedasticity patterns for the residuals. It may not be possible to obtain efficient estimates of the parameters by using weighted least squares when the form of heteroskedasticity is not known. OLS provides consistent parameter estimates in the presence of heteroskedasticity. On the other hand the usual OLS standard errors should not be used for inference since they will be incorrect. Using the White heteroskedasticity consistent or the Newey-West HAC consistent covariance estimates do not change the point estimates of the parameters. They only change the estimated standard errors. Newey and West (1987) have proposed a general covariance estimator that is consistent in the presence of both heteroskedasticity and autocorrelation of unknown form.8 HAC consistent covariances (Newey-West) are used to adjust errors for serial correlation and heteroskedasticity due to initial findings on OLS residuals.
8 EViews 4 User‘s Guide p.281-282
40
Another major problem of the data set is the non normality of return distributions. A few of authors ignored this problem. They used directly classical OLS methods in their analysis of hedge funds. On the other hand a few of them did not ignore this problem. They used alternative models such as GMM methods like Racicot and Theoret (2007, 2008).
GMM was first introduced by Hansen (1982) primarily for time series applications. GMM basically uses instrumental variable techniques. Therefore we should first define instruments for GMM estimation method. There are two basic rules to select good instruments. First chosen instruments should be highly correlated with regressors. Second they should be orthogonal to original error terms. According to Wooldridge (2001), we can obtain asymptotically efficient estimates by adding more moment conditions to moment conditions used by OLS method. This is true when the error term is heteroskedastic. He emphasizes that we must have overidentifying restrictions to get more efficient estimator than OLS and TSLS. He proposes to use lagged values of regressors as instruments. On other hand, Racicot and Theoret (2007, 2008) prefer to use lagged values of explanatory variables and higher moments of these variables up to fifth power.
We use the higher moments of lagged values of regressors up to fifth power as instruments in this study. SMB(-1), SMB(-1)^2, SMB(-1)^3, SMB(-1)^4 and SMB(-1)^5 are used as instruments for SMB variable. Iterated GMM method is used for regression analysis in E-Views. Newey-West HAC matrix is used to compute the
41
matrix of weights. Quadratic option is chosen for the kernel choice since it is smooth and is not truncated. Andrews method is used for the bandwidth option since it seems to converge more quickly towards the solution. It also assumes that the sample moments follow an autoregressive process of order one.9
4.2.1 General Results
Following tables summarize the regression results of GMM and OLS (Newey-West) methods for different investable hedge fund indexes. Detailed regression outputs are presented in Appendix C.
9 EViews 4 User‘s Guide p.281-282