PAPER
Period doubling behavior in human steady state visual evoked
potentials
Yiğit Tuncel , Toygun Başaklar and Yusuf Ziya Ider1
Electrical and Electronics Engineering Department, Bilkent University, 06800 Ankara, Turkey
1 Author to whom any correspondence should be addressed.
E-mail:[email protected],[email protected]@ee.bilkent.edu.tr
Keywords: EEG, steady state visual evoked potential, SSVEP, period doubling, sinusoidalflicker stimulation, harmonics, subharmonic
Abstract
Objective. Previous human steady state visual evoked potential
(SSVEP) experiments have yielded
different results regarding the range of stimulus frequencies in which period doubling
(PD) behavior is
observed. This study aims at obtaining experimental and statistical data regarding the frequency range
of PD generation and also investigates other characteristics of PD. Approach. In two sets of
experiments, seven subjects were presented a sinusoidal
flickering light stimulus with frequencies
varying from 15 to 42 Hz. To observe the short term variations in PD generation, another set of 5
successive experiments were performed on
five subjects with 10 min breaks in between. To obtain the
SSVEP responses,
filtering, signal averaging and power spectral density (PSD) estimation were applied
to the recorded electroencephalogram. From the PSD estimates, subharmonic occurrence rates were
calculated for each experiment and were used along with ANOVA for interpreting the outcomes of the
short term repeatability experiments. Main results. Although fundamental
(excitation frequency) and
second harmonic components appear in almost all SSVEP spectra, there is considerable inter-subject
and intra-subject variability regarding PD occurrence. PD occurs for all stimulus frequencies from 15
to 42 Hz when all subjects are considered together. Furthermore, the statistical analyses of short term
repeatability experiments suggest that in the short term, PD generation is consistent when all
frequencies are considered together but for a single frequency significant short term differences occur.
There also is considerable variation in the ratio of subharmonic amplitude to fundamental amplitude
across different frequencies for a given subject. Significance. Important results and statistical data are
obtained regarding PD generation. Our results indicate that modeling studies should attempt to
generate PD for a broader range of stimulus frequencies. It is argued that SSVEP based brain
–
computer interface applications would likely benefit from the utilization of subharmonics in
classification.
1. Introduction
Steady state visual evoked potentials (SSVEPs) are oscillatory potentials elicited in the electroencephalo-gram (EEG) by flickering light stimulation [1, 2].
SSVEPs have been widely used in engineering applica-tions such as brain–computer interfaces (BCIs) [3] and
cognitive and clinical research[4,5], however, there is
not a precise explanation about their mechanism of generation. In particular, some nonlinear resonance phenomena of SSVEPs, which have been observed by several researchers [6–9], need to be better
under-stood. These phenomena are characterized by brain
responses at harmonic and subharmonic frequencies (period doubling (PD) behavior) as well as the response to the stimulus frequency.(Throughout this manuscript,‘subharmonic frequency’ is used to refer to half of the stimulus frequency, and ‘period dou-bling’ is used to refer to the generation of subharmonic frequency.)
Crevier and Meister have investigated the PD phe-nomena under bright fullfield flickering square wave light stimulus in salamander and human [6]. For
humans, both in electroretinogram(ERG) and EEG, they reported PD regime in response to stimuli between 30 and 70 Hz[6].
RECEIVED 4 September 2017 REVISED 8 January 2018 ACCEPTED FOR PUBLICATION 15 January 2018 PUBLISHED 2 February 2018
Herrmann conducted an extensive study in which he used a square wave light source as theflickering sti-mulus to induce SSVEP responses in EEG[7]. He
var-ied the stimulus frequency from 1 to 100 Hz with 1 Hz steps and reported that subharmonic oscillations occur near alpha band. He did not state any specific range of stimulation frequencies that yields PD beha-vior. From the data and graphs presented in his paper, it is observed that PD occurs in response to roughly half of the stimulation frequencies in the range of 15–30 Hz.
Tsoneva et al have used repetitive visual stimuli in 40–60 Hz (gamma band) to study temporal and spatial properties of SSVEP and analyze the interaction between SSVEP and ongoing brain rhythms. They have used square wave light source with 2 Hz steps, excluding 50 Hz. They reported subharmonic respon-ses throughout this stimulus frequency range along with valuable spatiotemporal information regarding SSVEPs[8].
Roberts and Robinson used Robinson’s Thalamo-cortical Model [10] to simulate Herrmann’s
exper-imental procedure and the model predicted similar results[11] to Herrmann’s experimental results. They
reported PD behavior for stimulus frequencies 15–24 Hz. They have also pointed out that square wave contains harmonic components by itself and is not the best stimulus for obtaining the most accurate results. So they proceeded to apply sinusoidalflicker instead of square waveflicker to the model and came up with similar predictions[11]. They also stated that
these predictions regarding sinusoidal excitation should be experimentally verified.
Labecki et al undertook both experimental and simulation studies. They conducted an SSVEP experi-ment in which they used both square wave and sinu-soidal light sources as theflickering stimuli to induce SSVEP responses in EEG[9]. Their experiment was
rather limited in scope; they used 2 distinct frequency values for both modulation types (namely 5 and 15 Hz). They stated that in the spectrum of EEG response to 15 Hz stimulus frequency, 7.5 Hz peak was statistically significant; however it is not clearly obser-vable by the eye. They also applied their experimental procedure to Lopes da Silva’s simple cortex model [12]
to reproduce their experimental findings [9]. They
reported that subharmonic responses occur in response to stimulus frequency range of 17–21.5 Hz when the input was square wave and 15–22 Hz when the input was sinusoidal wave.
There is considerable ambiguity on the subject of PD in SSVEP experiments in the literature regarding at which stimulation frequencies PD occurs and how consistent this occurrence is. This ambiguity also holds back the investigators who aim at developing realistic cortex simulation models. Besides, an inclu-sive experiment that investigates the nonlinear beha-viors of SSVEPs induced by a purely sinusoidal stimulus is absent. Therefore, there is need for
additional experimental data to clarify the various issues related to subharmonic generation. In this study, we have conducted SSVEP experiments with such focus and have compared ourfindings with the findings of other researchers and with the predictions of the abovementioned simulation studies. We have also identified and explained various characteristics of PD behavior.
2. Materials and methods
2.1. Experimental procedure
A total of 9 healthy(no neurological or psychiatric disorders) subjects with a mean age of 22 (6 males, 3 females) participated in the experiments. All subjects have normal or corrected-to-normal vision. All sub-jects signed an informed consent form which explains the objectives of the study and thatflicker stimulation may cause epileptic seizures.
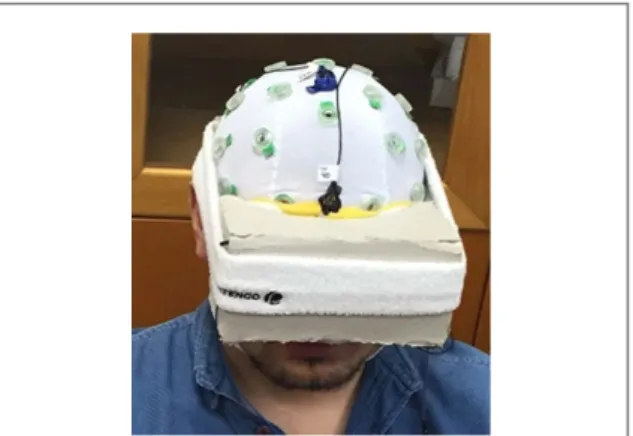
A simple Do-It-Yourself (DIY) cardboard VR headset with two, white, high gloss, 5 mm light-emit-ting diodes(LEDs) inside, where these two LEDs stay 2–3 cm in front of subjects’ eyes, was built for the pur-pose of full visualfield illumination (figure1). The
sti-mulus is modulated with a sinusoidal waveform at 100% modulation depth. The peak illuminance at 2 cm away from one of the LEDs is 410 lux as mea-sured by Trotec BF06 luxmeter.
An FPGA board (Nexys 2TM Spartan-3E FPGA Trainer Board (Digilent Inc., United States) with a 50 MHz crystal oscillator(100 ppm tolerance)) is used to generate a very accurate sinusoidal waveform(with less than 1mHz error). This digital sinusoidal wave-form was converted to a sinusoidal voltage wavewave-form by a 12 bit D/A converter (MCP4921-E/P). To con-vert the voltage waveform generated by the FPGA to light modulation, the circuit infigure 2is used. The input to this circuit has 3.3 V peak-to-peak sinusoidal wave with 1.65 V DC offset voltage. The max. current in this configuration is 3.3 V/1.2 kΩ=2.75 mA. This circuit is linear as long as the transistor is used in its
Figure 1. A photo of Do-It-Yourself(DIY) cardboard VR headset.
non-sat region. The LEDs are driven at their linear region.
To make sure that the generated sinusoidal light waveform is free of harmonics and is a‘pure’ sinusoid, the measurement circuit infigure3is used. This cir-cuit utilizes a PIN photodiode (BPW24), whose response is very linear when reverse biased [13], to
convert the light intensity into voltage waveform. The reverse current through the diode generates a voltage at the OPAMP output. The generated light had a ∼40 dB difference between the first and second harmonic.
Seven out of nine subjects participated in two dif-ferent sets of experiments. They werefirst presented a frequency range of 15–32 Hz with 1 Hz steps (experi-ment E1). On another day (within 2 weeks), they were presented a frequency range of 28–42 Hz with 1 Hz steps(experiment E2). We divided the stimulation fre-quencies into two experiments in order not to exhaust the participants and also to observe long-term differ-ences regarding PD generation. Additionally, to test the short-term repeatability of our experimental pro-cedure and also to observe the short-term variability of ourfindings, five out of nine subjects participated in 5 experiments in a row, in which they were presented a frequency range of 25–35 Hz with 1 Hz steps, keeping the same cap and electrodes in position. There was a 10 min rest period between each successive experiment.
For all experiments, at each frequency, sinusoidal light was presented for 30 s with 10 s rest in between during which constant light at a level of half of the maximum brightness(LED circuit is driven by the DC offset voltage) was applied. An experiment was over when all the frequencies were presented once to the subject. For example, for 15–32 Hz experiment, there were 18 30 s recordings during which the stimulus was presented. In the beginning of each period of the sine wave, a marker pulse was also transmitted from FPGA
to the EEG amplifier. For instance, for a 30 Hz sine wave, 900 markers were sent to the EEG amplifier dur-ing the 30 s stimulus presentation.
2.2. Data acquisition
The EEG was recorded with Brain Products V-Amp 16 channel EEG amplifier along with actiCAP, a standard 10–20 EEG cap with 32 electrode sites (Brain Products, Gilching, Germany). EEG was recorded from electro-des‘O1, Oz, O2, Pz, P3, P4’ and they were referenced to FCz electrode. The ground electrode was placed over nasion, on the forehead. BrainVision Recorder was used to record the EEG and marker pulses simultaneously. The electrodes are active and ImpBox (Brain Products, Gilching, Germany) was used to measure the impedance values of electrodes. Electrode impedances were kept below 10 kΩ. The sampling rate was 1 kS s−1. Data werefiltered with a 50 Hz Notch filter during recording.
2.3. Data analysis
The EEG recordings werefirst exported to MATLAB using BrainVision Analyzer software and were ana-lyzed in MATLAB(The MathWorks, Inc., Natick, MA, USA). For each experiment, 5–100 Hz bandpass filter was applied to each 30 s recording since fundamental frequency, its harmonics and subharmonics lie within this range and also to eliminate DC offset and slow components due to head movements. For each channel, from the 30 s recording of each frequency stimulation,fifteen non-overlapping 2 s long epochs were extracted. Epochs are chosen to be 2 s long to ensure that the subharmonic frequencies of odd stimulus frequencies have an integer number of cycles in an epoch.
SSVEPs are typically observed from frequency spectrums of EEG recordings. For each stimulation frequency and for each channel, three different types of power spectrum density (PSD) estimates were calculated:
(i) PSD estimate of the 30 s long data, Figure 2. Stimulus circuit is used to convert voltage waveform
to light waveform.
Figure 3. PIN diode circuit is used to measure the light waveform generated by the circuit infigure2.
(ii) average of PSD estimates of each epoch,
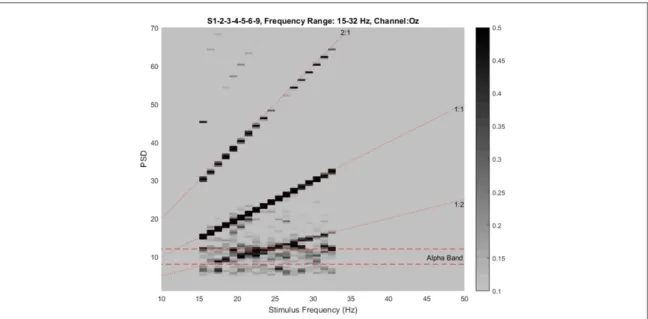
(iii) and PSD estimate of the average of fifteen epochs. For PSD estimate calculations, Welch’s method was used. In addition to the standard PSD plots, a two dimensional plot was also generated for the spectrums of the averaged epochs. In this plot, the stimulation frequencies are placed on the horizontal axis and the PSD estimate of the response to each stimulus fre-quency are grayscale coded on the vertical axis(such as infigures6and7). This plot is called PSD versus
sti-mulus frequency (PSD-SF) plot in the rest of this document for easy referral.
To determine if a subharmonic component (corresponding to period doubling) occurs or not, the PSD of half frequency component should be clearly distinguishable in amplitude (an outlier) from sur-rounding frequency components. The PSD estimate of 30 s long data was calculated with a frequency resolu-tion of 0.1 Hz. From this data, a 21-point array that holds the PSD estimates in the ’subharmonic frequency±1 Hz’ interval was extracted. For exam-ple, if the stimulation frequency was 30 Hz, this array would be composed of PSD estimates of 14–16 Hz with 0.1 Hz steps. To detect the occurrences of period doublings, MATLAB’s ‘isoutlier’ function was used on the extracted array. Outliers, which were more than three times the scaled median absolute deviation away from the median, were detected from this array. If the detected outlier was found to be at the half funda-mental frequency, then this outlier was regarded as a subharmonic occurrence and subharmonic occur-rence value was assigned the value of‘1’ (else as ‘0’). For each experiment, subharmonic occurrences were identified by using the above method for each stimulus frequency in all channels.
Subharmonic occurrence rate across channels (SORc) for any given frequency and experiment was defined as average occurrence in all the six channels that were recorded. For the case of short term repeat-ability experiments, in addition to SORc values, sub-harmonic occurrence rate across experiments(SORe) for any given frequency and channel was defined as average occurrence in all the 5 consecutive experi-ments. ANOVA was done on the SORc and SORe values of short term repeatability experiments to obtain statistical results. For both ANOVA tests, the independent variable was the stimulation frequency and the dependent variable was SOR. We have chosen to base our statistical decisions on a significance level of p=0.05.
3. Results
To illustrate the benefit of averaging in data analysis, spectrum of a raw epoch and the spectrum of the average of thefifteen epochs within a 30 s recording are compared infigure4. It can be seen that averaging
highly attenuates the alpha power (8–12 Hz) which exists in the raw recording. This happens because alpha components are not synchronous with the applied stimulus frequency and therefore they dimin-ish with averaging. In the spectrum of the averaged epoch(figure4(d)), the fundamental (32 Hz),
harmo-nic(64 Hz) and subharmonic (16 Hz) peaks are more easily observable than in the spectrum of the raw epoch(figure4(b)).
Figure 5 compares the three different PSD esti-mates that are explained in data analysis section. With a stimulation frequency of 40 Hz, in thefirst type of PSD plot(figure5(a)), there is a clear high amplitude
20 Hz signal component along with the expected 40 Hz signal component. In the second type of PSD plot (figure 5(c)), the subharmonic (20 Hz)
comp-onent is not as distinguishable from the surrounding spectral components. In the third type of PSD plot (figure 5(d)), the 20 Hz component is again more
clearly evident. Thisfigure again clearly demonstrates that signal averaging helps to suppress the alpha com-ponents and thereby enhances the appearance of the subharmonic component. Among the three types of spectrums presented in figure 5, although sub-harmonic components are observable in all three, type 3 spectrums are especially preferable to obtain PSD-SF plots because with the other two types of spectrums, the stronger alpha range and nearby spectral compo-nents preclude the clear demonstration of PD on a PSD-SF plot.
PSD-SF plot averaged across all subjects(for chan-nel Oz) for experiment E1 (with 15–32 Hz stimulation range) is given in figure6. Components on the 1:1 line, on which the fundamental frequency components line up, are clearly visible. In a similar manner, the 2:1 line, on which the second harmonic components line up, is observable. The subharmonic components, which are to be on the 1:2 line, are also visible throughout this frequency range. Figure7 presents the PSD-SF plot averaged across all subjects (for channel Oz) (data from subject S6 was discarded due to EEG artifacts for this recording) for experiment E2 (with 28–42 Hz sti-mulation range). As expected, the 1:1 and 2:1 lines (fundamental and second harmonics) are clearly visi-ble. As the excitation frequency(stimulus) is increased from 28 to 42 Hz, a distinct and significant half fre-quency component follows (1:2 line). Subharmonic responses are more clearly discernable infigure7than infigure 6 because the subharmonic frequencies in figure7do not fall in the alpha band. Subharmonic responses infigure6are still visible within the alpha band due to the existence of a frequency dependent trend. If signal averaging is not used before PSD esti-mation, this trend is not visible.
Table 1 presents at which frequencies PD is observed for each subject in the 15–32 Hz and 28–42 Hz experiments. Considering the 15–32 Hz experiments(E1), in three subjects (subjects S1, S5 and S9), PD is observed throughout nearly the whole
frequency range(for subjects S1 and S9, the observed frequencies are contiguous and for subject S5 the fre-quencies that depict PD are separate (spaced)). For subjects S2, S3 and S6, PD is observed in the second half of the stimulus frequency range(from 25 Hz and onward). For subject S4 on the other hand, PD is not observed at all. In the 28–42 Hz experiments (E2), out of the 15 stimulation frequencies, subjects S2, S9, S3, S5, S1, S4 and S6 generate subharmonic responses at 10, 10, 9, 8, 7, 5 and 5 frequencies respectively. S2, S3, S4 and S9 depict contiguous responses but the others
have spaced-out responses. Therefore, there is sub-stantial subject to subject variation regarding the fre-quencies of PD phenomena. Furthermore, for a given subject, considering the overlapping stimulation fre-quencies in both experiments (28–32 Hz), experi-ments performed in different days also may yield different results.
Table2shows the subharmonic occurrence rates across channels (SORc) for subject S3 within the 5 consecutive experiments which were performed for observing the short term repeatability of the Figure 4. Effect of averaging on the PSD estimate. Data belongs to S4(channel Pz, stimulus frequency=32 Hz). (a) An example of an epoch(between 20th and 22nd seconds), and (b) its spectrum. (c) Average of the fifteen epochs of the 30 s recording, and (d) its spectrum. The peaks on different spectrums are marked with data tips. Note that(a) has 2 times the scale of (c).
Figure 5. Comparison of the three types of PSD estimates. Data belongs to S5(channel Oz, stimulus frequency=40 Hz). (a) PSD estimate of 30 s long data(b) Average of fifteen epochs. (c) Average of PSD estimates of each epoch. (d) PSD estimate of the average of fifteen epochs shown in (b). The peaks on different spectrums are marked with data tips.
experimental procedure. From table2, SORc value, averaged across all frequencies(bottommost row) for a single experiment is observed to vary from a mini-mum of 24% to a maximini-mum of 52%. The change in this rate does not follow a trend in time(experiment number). One-way repeated measures ANOVA test [14] (which is an extension of the paired t-test)
con-cludes that, when all frequencies are considered toge-ther, the experiments do not differ significantly (F(4, 40)=1.322, p=0.2783). Similar results are obtained for the other subjects except for subject S2(see table4
for statistical details). In S2 experiments are found to be different and however, this is only due to the
difference between experiment 1 and experiment 4 revealed by a post hoc test which analyzes experiments in pairs(p=0.035). On the other hand, even between experiments which are not found to be different statis-tically when all frequencies are considered together, there are substantial individual variations in SORc values when a single frequency is considered. For example, for 31 Hz SORc value varies from 100% to 0% across experiments in table2.
For a reason explained later in the conclusions and discussion section, we have also investigated if there is significant difference between occipital channels (O1, Oz, O2) and parietal channels (P3, Pz, P4). Table3
Figure 6. Averaged PSD-SF plot across all subjects(channel Oz) for the experiment that covers the stimulus frequencies from 15 to 32 Hz. Horizontal dashed red lines visualize the alpha band(8–12 Hz interval). The dotted red lines are put for better demonstration of the trends in data. The lower limit of the colorbar is set to 0.1 to eliminate confusion due to background noise in spectrums. The upper limit is saturated at 0.5 for clear observation of subharmonic peaks.
Figure 7. Averaged PSD-SF plot across all subjects(channel Oz) (data from subject S6 was discarded due to EEG artifacts for this recording) for the experiment that covers the stimulus frequencies from 28 to 42 Hz. Horizontal dashed red lines visualize the alpha band(8–12 Hz interval). The dotted red lines are put for better demonstration of the trends in data. The lower limit of the colorbar is set to 0.1 to eliminate confusion due to background noise in spectrums. The upper limit is saturated at 0.5 for clear observation of subharmonic peaks
shows the average of subharmonic occurrence rates across experiments(SORe) of O channels and P chan-nels for subject S3. One-way ANOVA test shows that there is no significant difference between O channels and P channels(F(1, 20)=2.61, p=0.122) for S3. In fact, as shown in the second column of table4, one-way ANOVA concludes that O channels and P chan-nels do not differ significantly in all subjects (F and p values are given in table4).
We have also studied the variations of the sub-harmonic peak relative to the fundamental peak. Indeed, as shown infigure8as an example, the ratio of the amplitude at the subharmonic frequency to the fundamental component is less than one in 27–30 Hz region and larger than one at 31 and 32 Hz for subject
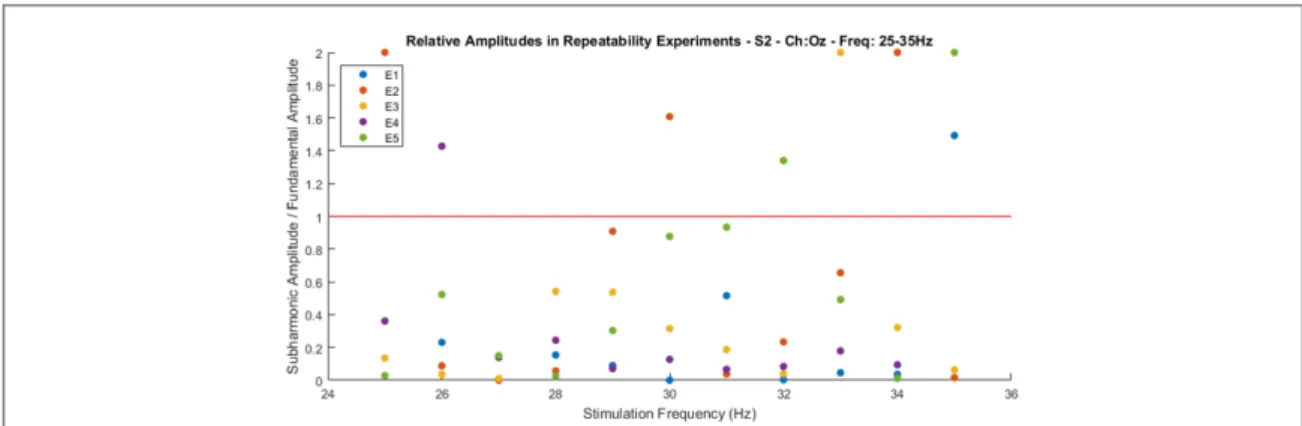
S2(channel Oz). In general, considering the observa-tions in all experiments of the study, the amplitude of the subharmonic frequency relative to the amplitude of the fundamental frequency does not follow a trend and is variable with respect to frequency. Figure 9
shows the change in relative amplitude for subject S2’s repeatability experiments. In this figure, it can be observed that relative amplitudes vary with respect to frequency for an experiment and vary with respect to experiment for a frequency. It can also be seen that although relative amplitude generally resides below 1, Table 1. Stimulus frequencies for which period doubling is observed in two different experiments(E1:stimulus frequencies 15–32 Hz and E2:stimulus frequencies 28–42 Hz) for seven subjects. Green highlight is used when period doubling behavior is present and red highlight is used when not. The presence of period doubling is determined according to SORc for each frequency(present if SORc>50%). First column lists the subject IDs. Second column lists the stimulus frequencies for which period doubling is observed for E1. Third column lists the stimulus frequencies for which period doubling is observed for E2.
Table 2. SORc values of each stimulation frequency in 5 consecutive repeatability experiments for S3. First column lists the stimulation frequencies used in all 5 experiments. Second to sixth columns list the corresponding SORc values in different experiments.
Stimulus frequency Exp1 Exp2 Exp3 Exp4 Exp5
25 Hz 0% 83% 67% 17% 17% 26 Hz 83% 0% 33% 0% 33% 27 Hz 0% 50% 50% 50% 67% 28 Hz 67% 67% 83% 50% 17% 29 Hz 67% 17% 17% 0% 33% 30 Hz 83% 83% 83% 17% 67% 31 Hz 100% 83% 33% 0% 33% 32 Hz 50% 0% 17% 67% 0% 33 Hz 83% 83% 17% 17% 33% 34 Hz 33% 0% 50% 33% 0% 35 Hz 0% 50% 50% 17% 100% Avg. 52% 47% 45% 24% 36%
Table 3. Average SORe values for each stimulation frequency in O and P channels for S3. First column lists the stimulation frequencies used in all 5 experiments. Second column lists the average of the SORe values of O1, Oz, O2 channels. Third column lists the average of the SORe values of P3, Pz, P4 channels.
Stimulus frequency Oavg Pavg
25 Hz 40% 33% 26 Hz 33% 27% 27 Hz 53% 33% 28 Hz 60% 53% 29 Hz 33% 20% 30 Hz 67% 67% 31 Hz 53% 47% 32 Hz 27% 27% 33 Hz 47% 47% 34 Hz 33% 13% 35 Hz 60% 27% Avg. 46% 36%
there are cases when subharmonic component is much larger than the fundamental component.
4. Conclusions and discussion
Our experimental results indicate that PD may occur in all stimulation frequencies (15–42 Hz) that our experiments have covered. In earlier studies, which covered a broad range of stimulation frequencies (1–100 Hz), Herrmann’s findings indicated subhar-monic generation for the stimulus range of 15–30 Hz [7], and Crevier and Meister reported subharmonic
occurrence range for stimulus frequencies between 30 and 70 Hz[6]. Additionally, Tsoneva et al have studied
the stimulus frequency range of 40–60 Hz and have observed subharmonic generation in this frequency range[8]. Therefore, considering the results of all these
studies and the current study, it is likely that sub-harmonic generation occurs in a broad range of frequencies, and as of now an exact frequency range of subharmonic generation cannot be stated. The differ-ences between the results of different studies may perhaps be explained by factors specific to the subjects included in the experiments and also specific to the experimental conditions, which however need to be identified in further studies.
The mechanisms of subharmonic frequency gen-eration is still an unresolved issue. In the 2012 study of Roberts and Robinson [11], Robinson’s
Thalamocortical model[10] was tuned to reproduce
Herrmann’s findings [7]. There, the model showed PD
behavior only in 15–24 Hz stimulus interval. Similarly, Labecki et al used Lopes da Silva’s cortical column model[12] to reproduce PD behavior in 15–22 Hz
sti-mulus interval[9]. However, our study indicates that a
model should include a broader frequency region in its PD regime. Future models should be able to provide means for tuning the subharmonic frequency range and preferably be able to relate these to physiological and environmental conditions(such as those men-tioned in the next paragraph). It is vital to adjust these models according to such factual experimental infor-mation so that model predictions, regarding other nonlinear phenomena and dynamics and physiologi-cal mechanisms, could be basis for further research.
The summarized results in table 1 suggest that there is substantial inter-subject variability and also substantial intra-subject variability among experi-ments that are conducted in different days. We have also conducted onfive subjects the so called short-term repeatability experiments in order to observe the short term effects on subharmonic generation. Although, PD generation is mostly consistently observed in consecutive experiments when all fre-quencies are considered together, there is considerable variation in the SOR values of a frequency across experiments. It may be conjectured that both long term effects(electrode placement, physiological state, psychological state, illness, hunger, etc) and short term effects(changes in gaze, attention level, fatigue, etc) may be factors that cause these variations.
The effect of attention on SSVEP fundamental peak amplitude is investigated in[15]. Mutual
influ-ence between fatigue level and SSVEP parameters have also been reported in[16]. Level of attention and
fati-gue may also be altering PD generation. In any case, it may be wise to conduct SSVEP experiments, which aim at investigating subharmonic frequency genera-tion, with random stimulus frequency order to elim-inate the doubt related to fatigue and attention. Random stimulus frequency order may also be impor-tant to circumvent possible biases due to hysteresis effects predicted by Roberts and Robinson in their simulation study[11].
From the ERG recordings of both humans and animals, PD behavior was reported[6,17,18] which
indicates that subharmonic generation can occur at the retina. Lateral geniculate nucleus takes inputs from retinal ganglion cells and projects most of its output to primary visual cortex which are then projected to other visual cortex areas[19]. The electrode sites, O1,
Oz and O2 that were used in our experiments, corre-spond to primary(Oz) and secondary visual (O1, O2) cortices[20]. Accordingly, in our repeatability
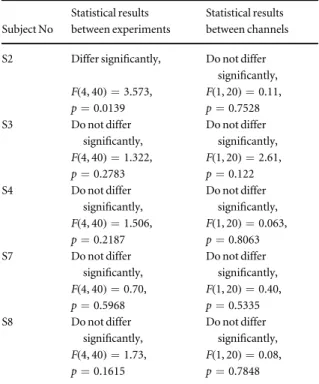
experi-ments, we argued that subharmonic occurrence rates may be consistently different between O and P chan-nels. However, the statistical analysis we have Table 4. Summary of obtained results for the 5 consecutive
repeatability experiments that are done onfive subjects for observing the short term repeatability of the experimental procedure. First column lists the subject IDs. Second column lists the statistical results(F and p values) of one-way repeated measures ANOVA for each subject to test the short term repeatability. Third column lists the statistical results(F and p values) of one-way ANOVA for each subject to compare the subharmonic occurrence in O and P channels. Subject No Statistical results between experiments Statistical results between channels S2 Differ significantly, Do not differ
significantly, F(4, 40)=3.573, F(1, 20)=0.11, p=0.0139 p=0.7528 S3 Do not differ significantly, Do not differ significantly, F(4, 40)=1.322, F(1, 20)=2.61, p=0.2783 p=0.122 S4 Do not differ significantly, Do not differ significantly, F(4, 40)=1.506, F(1, 20)=0.063, p=0.2187 p=0.8063 S7 Do not differ significantly, Do not differ significantly, F(4, 40)=0.70, F(1, 20)=0.40, p=0.5968 p=0.5335 S8 Do not differ significantly, Do not differ significantly, F(4, 40)=1.73, F(1, 20)=0.08, p=0.1615 p=0.7848
performed on the repeatability experiments yielded no difference between channels(see table4).
As shown infigure9, the ratio of subharmonic to fundamental component amplitudes varies con-siderably. In fact, there are cases where a fundamental peak may not occur at all while a subharmonic comp-onent occurs(such cases are saturated with a ratio of 2 infigure9). The amplitudes of subharmonic and
fun-damental components also change considerably from channel to channel. There may even be some extreme cases such as shown infigures10(a) and (b) where
fun-damental component is almost non-existent in chan-nel O1 whereas it is of the same order of magnitude with subharmonic component in channel Oz. These channel to channel variations may be the result of
phase differences/delays between areas in the cortex. Figure10(c) shows an example of another nonlinear
interaction that is not as commonly visible as other observed nonlinear phenomena. There is a peak at third harmonic of the subharmonic frequency( f+f/ 2, where f is the stimulation frequency) in SSVEP spec-trum. It is not clear whether such behavior is a result of nonlinear interactions of different cortical areas or maybe an inherent property of the cortex in general.
SSVEP is widely used in BCI applications due to its robustness and speed[5,21,22]. The reported
phe-nomena in the current study includes cases in which subharmonic peaks are greater in amplitude than fun-damental peaks or in which funfun-damental peaks are non-existent while subharmonic peaks are clearly Figure 8. The power spectrums of averaged epochs for 27–32 Hz stimulus frequencies. Data belongs to S2 (channel Oz). The peaks on different spectrums are marked with data tips. The ratio of the amplitude at the subharmonic frequency to the fundamental component is varying. Note that some peaks are outside the vertical range, their peak values can be seen on the corresponding data tip.
observable. In a BCI application using the SSVEP paradigm, total lack of fundamental component would likely degrade classification accuracy. Thus, it can be claimed that utilizing subharmonic peaks in addition to fundamental peaks in SSVEP responses would improve BCI performance. This requires target frequencies to be chosen for a particular subject within the frequency range where PD behavior is observed. Similarly, since the second harmonic components are consistently observed in all of our experiments,
additional use of this harmonic in SSVEP BCI applica-tions is also justified.
Acknowledgments
This work was supported by The Scientific and Technological Research Council of Turkey (TUBI-TAK) under Grant 116E153.
Figure 9. Ratio of amplitudes of subharmonic responses to the amplitudes of fundamental responses infive consecutive repeatability experiments of subject S2(channel Oz). Relative amplitude is varying in the short term for each frequency. Experiments 1–5 are color coded. Notice that ratios greater than 2 are saturated at 2 for better demonstration. The horizontal red line corresponds to the ratio of 1.
Figure 10. Other observed nonlinear characteristics of SSVEP response. Data belongs to S3.(a) Spectrum of averaged epochs in channel O1. Fundamental frequency(stimulus frequency) is 41 Hz. (b) Spectrum of averaged epochs in channel Oz. Fundamental frequency(stimulus frequency) is 41 Hz. (c) Spectrum of averaged epochs in channel Oz. Fundamental frequency is 29 Hz (denoted by f). Strong subharmonic ( f/2) and harmonic (2f ) peaks are present in the spectrum. An additional peak at 43.5 Hz ( f +f/2=3 f/ 2) is visible for this particular case. This phenomenon is actually present in many recordings, but is not always as obvious as in this case.
ORCID iDs
Yiğit Tuncel https://orcid.org/0000-0001-5943-0230
Toygun Başaklar https://orcid.org/0000-0002-9312-236X
Yusuf Ziya Ider https: //orcid.org/0000-0002-1961-6804
References
[1] Regan D 1966 Some characteristics of average steady-state and transient responses evoked by modulated light
Electroencephalogr. Clin. Neurophysiol.20 238–48
[2] Regan D 1989 Human Brain Electrophysiology: Evoked Potentials and Evoked Magnetic Fields in Science and Medicine (New York: Elsevier)
[3] Bin G, Gao X, Yan Z, Hong B and Gao S 2009 An online multi-channel SSVEP-based brain–computer interface using a canonical correlation analysis method J. Neural Eng.6 046002
[4] Ortner R, Allison B Z, Korisek G, Gaggl H and Pfurtscheller G 2011 An SSVEP BCI to control a hand orthosis for persons with Tetraplegia IEEE Trans. Neural Syst. Rehabil. Eng.19 1–5
[5] Vialatte F, Maurice M, Dauwels J and Cichocki A 2010 Steady-state visually evoked potentials: focus on essential paradigms and future perspectives Prog. Neurobiol.90 418–38
[6] Crevier D W and Markus M 1998 Synchronous period-doubling inflicker vision of salamander and man J. Neurophysiol.79 1869–78
[7] Herrmann C S 2001 Human EEG responses to 1–100 Hz flicker: resonance phenomena in visual cortex and their potential correlation to cognitive phenomena Exp. Brain Res.
137 346–53
[8] Tsoneva T, Garcia-Molina G and Desain P 2015 Neural dynamics during repetitive visual stimulation J. Neural Eng.12 066017
[9] Labecki M, Kus R, Brzozowska A, Stacewicz T,
Bhattacharya B S and Suffczynski P 2016 Nonlinear origin of
SSVEP spectra a combined experimental and modeling study Front. Comput. Neurosci.10 129
[10] Robinson P A, Rennie C J and Rowe D L 2002 Dynamics of large-scale brain activity in normal arousal states and epileptic seizures Phys. Rev. E65 041924
[11] Roberts J A and Robinson P A 2012 Quantitative theory of driven nonlinear brain dynamics NeuroImage62 1947–55
[12] Lopes da Silva F H, Hoeks A, Smits H and Zetterberg L H 1974 Model of brain rhythmic activity Kybernetik15 27–37
[13] Wang W 2011 Optical Detectors Seattle: Department of Mechanical Engineering-University of Washingtonhttp:// depts.washington.edu/mictech/optics/sensors/detector.pdf
[14] Howell D C 2012 Statistical Methods for Psychology 8th edn (Belmont: Thomson Wadsworth) pp 457–506
[15] Kim Y J, Grabowecky M, Paller K A, Muthu K and Suzuki S 2006 Attention induces synchronization-based response gain in steady-state visual evoked potentials Nat. Neurosci.10 117–25
[16] Cao T, Wan F, Wong C M, da Cruz J N and Hu Y 2014 Objective evaluation of fatigue by EEG spectral analysis in steady-state visual evoked potential-based brain–computer interfaces Biomed. Eng. Online13 28
[17] Shah M R, Alexander K R, Ripps H and Qian H 2010 Characteristics of period doubling in the rat coneflicker ERG Exp. Eye Res.90 196–202
[18] Alexander K R, Levine M W and Super B J 2005 Characteristics of period doubling in the human coneflicker
electroretinogram Vis. Neurosci.22 817–24
[19] Carandini M, Demb J B, Mante V, Tolhurst D J, Dan Y, Alshausen B A, Gallant J L and Rust N C 2005 Do we know what the early visual system does? J. Neurosci.25 10577–97
[20] Kaiser D A 2010 Cortical cartography Biofeedback38 9–12
[21] Liu Q, Chen K, Qingsong A and Quan X S 2014 Review: recent development of signal processing algorithms for SSVEP-based brain computer interfaces J. Med. Biol. Eng.34 299–309
[22] Amiri S, Rabbi A, Azinfar L and Fazel-Rezai R 2013 A review of P300, SSVEP, and hybrid P300/SSVEP brain–computer interface systems Brain–Computer Interface Systems—Recent Progress and Future Prospects(Rijeka: InTech) 10196–213