Photocatalytic Conversion of Nitric Oxide on Titanium Dioxide:
Cryotrapping of Reaction Products for Online Monitoring by Mass
Spectrometry
Weigang Lu,
†Abayomi D. Olaitan,
†Matthew R. Brantley,
†Behrooz Zekavat,
†Deniz A. Erdogan,
‡Emrah Ozensoy,
‡and Touradj Solouki
*
,††Department of Chemistry and Biochemistry, Baylor University, Waco, Texas 76798, United States ‡Department of Chemistry, Bilkent University, 06800 Bilkent, Ankara, Turkey
*
S Supporting InformationABSTRACT: Details of coupling a catalytic reaction chamber to a liquid nitrogen-cooled cryofocuser/triple quadrupole mass spectrometer for online monitoring of nitric oxide (NO) photocatalytic reaction products are presented. Cryogenic trapping of catalytic reaction products, via cryofocusing prior to mass spectrometry analysis, allows unambiguous characterization of nitrous oxide (N2O) and nitrogen oxide species (i.e., NO and nitrogen dioxide (NO2)) at low
concentrations. Results are presented, indicating that the major photocatalytic reaction product of NO in the presence of titanium dioxide (TiO2) P25 and pure
anatase catalysts when exposed to ultraviolet (UV) light (at a wavelength of 365
nm) is N2O. However, in the presence of rutile-rich TiO2catalyst and UV light, the conversion of NO to N2O was less than 5%
of that observed with the P25 or pure anatase TiO2catalysts.
1. INTRODUCTION
Photocatalytic processes utilized in the decomposition of organic and inorganic compounds as well as the removal of harmful gases are of great interest in addressing environmental issues associated with air and water pollutants.1,2 Nitric oxide (NO) and nitrogen dioxide (NO2) are among the major air
pollutants originating from fossil fuel combustion in automobile engines and industrial burners.3Various catalytic processes have been developed to convert NOxgases (i.e., NO and NO2) into
nitrogen (N2) and oxygen (O2) or into nitrates (NO3−) for
NOxabatement.4−7However, a majority of the catalysts used in converting NOx gases into harmless gaseous species (i.e., N2
and O2) contain expensive precious metals (e.g., Rh, Pt, or Pd)
and perform most efficiently at high temperatures (>200 °C).4,8 An ideal catalyst for NOxconversion is expected to convert or store NOx gases at lower temperatures (e.g., ambient
conditions during the cold start of automobile engines).9 Titanium dioxide (TiO2) is among the major photocatalysts
used for catalytic conversion of NOx gases into nitrous oxide (N2O) and N2.10,11 Previous studies have shown promising
results where TiO2catalysts were utilized for NOx conversion
in the presence of solar light.12−17
Photocatalytic efficiencies of TiO2catalysts depend on their
crystalline phases, surface morphologies, specific surface areas, electronic structures, and thermal treatments.18,19 To achieve peak catalytic performance, optimizations of these parameters are necessary.18,19 Most of the previously reported studies on conversion of NOxgases have employed various spectroscopic
(e.g., infrared (IR),20 laser absorption,21 and chemilumines-cence (CL)22) or electrochemical techniques23for detection of
NOxreaction products. The use of gas chromatography (GC)
systems equipped with electron capture detectors (ECDs)24or mass spectrometers (MS)25,26for identification of NOxreaction
products have been previously reported. In addition, biomedical applications of NO detection, by using high resolution MS27 and, indirectly, semiconducting metal oxides,28 have been reported.
Commercially available NOxanalyzers primarily use either IR or CL for the detection of NOxspecies.22NOxanalyzers based
on CL measurement systems often incorporate a heated molybdenum converter for conversion of NO2 to NO for
subsequent CL analysis29 and are limited to the indirect detection of NO2.22Therefore, conventional CL NOxanalyzers
can only be used for online monitoring of NO and NO2during
the photocatalytic conversion of NOx30,31and are not suitable for detection of other potential photocatalytic products such as N2or N2O.10−13,32−35Recently, Bahnemann et al. reported that there may be significant uncertainty in the identity of the detected NOx species as there could be other nitrogen-containing compounds such as N2O which are not detected by
CL analyzers.36,37 N2O has previously been reported as a
primary photocatalytic decomposition product of NO using temperature-programmed desorption measurements.13,32,34 Also, N2O has been shown as a byproduct of NOx reduction on metal oxides in thermal DeNOxcatalysis.38−41
Received: October 30, 2015 Revised: February 2, 2016 Published: February 25, 2016
pubs.acs.org/JPCC
Downloaded via BILKENT UNIV on December 21, 2018 at 16:23:25 (UTC).
MS allows for direct mass-to-charge ratio (m/z) analysis and hence, it can be used for molecular weight determination of NOx species and other potential NO photocatalytic prod-ucts.10−12,14,35,42,43 In addition, GC/MS systems provide a higher degree of specificity and selectivity for NOx separation prior tofinal analysis. The use of conventional open tubular GC columns for analysis of NOxgas mixtures is challenging due to poor separation of NO from N2 and O2.44 To separate NO
from N2and O2, packed GC columns made of molecular sieve polymers, such as poly(vinylbenzene), are more suitable.24 However, due to the reaction of NO2 with the vinylbenzene molecular sieves, the use of molecular sieve polymers as GC stationary phases hinders the utility of GC for separation and detection of NO2.7Moreover, NOxand N2O species are often
present in the atmosphere at low concentrations (NO: <1 ppb(v) and N2O: ∼0.32 ppm(v))45 which limit the use of
conventional GC/MS systems for comprehensive detection of NO photocatalysis products. Because of the low NOxand N2O
concentrations in air, enrichment of pollutants by cryotrapping (cooling with liquid nitrogen) is a useful method for highly sensitive detection of NOxand N2O species. Determination of NOx and N2O concentrations in air has been previously
reported using a“cryotrap enrichment” setup coupled to a GC/ MS system.45
In this report, we discuss the experimental details of detecting NO and potential NO photocatalytic reaction products using a catalysis unit equipped with mass flow controllers coupled to a liquid nitrogen (LN2)-cooled
cryofocuser/triple quadrupole mass spectrometry (CryoF/ TQMS) system. We utilized the CryoF/TQMS system for direct monitoring of catalytic reaction products from a gas stream sample containing 80 ppm of NO in simulated air (i.e., diluted in 80% N2 and 20% O2) in the presence of TiO2 catalysts and ultraviolet (UV) radiation (wavelength maximum, λmax = 365 nm). We show that the CryoF/TQMS approach
allows for detection of the photocatalytic reaction products of NO (e.g., N2O as the major product) in the presence of high concentrations of O2and N2. NO concentrations in the range
of 10 and 200 ppm have been previously employed to monitor the photocatalytic conversion of NOx gases using TiO2
catalysts;1,46,47 hence, 80 ppm of NO concentration (i.e., midrange of previous studies) was utilized to demonstrate the catalytic conversion of NO using a unique CryoF/TQMS system. Future studies will employ lower NO concentrations (e.g., <1 ppm) for targeting specific applications such as studying the air purification performance of TiO2-based
photocatalysts as filters to clean indoor NOx contaminants. P25 TiO2 catalyst has been shown to have very high
photocatalytic activity for the removal of NOx gases16,48,49 and is a benchmark catalyst for studying the photocatalytic decomposition of NO; hence, we also included P25 TiO2in our studies.
2. EXPERIMENTAL METHODS
2.1. Sample Preparation. Nitric oxide (NO) (100 ppm balanced with nitrogen (N2)), ultrahigh purity (UHP) oxygen (O2) (purity: 99.993%), UHP N2(purity: 99.999%), and UHP
helium (He) (purity: 99.999%) gases were purchased from a commercial source (Praxair, Danbury, CT). Aeroxide P25 titanium dioxide (TiO2) (average particle size: 21 nm, purity: >99.5%) was purchased from Sigma-Aldrich (Sigma-Aldrich, St. Louis, MO). Pure anatase TiO2 (Nanostructured and Amorphous Materials Inc., Houston, TX) and rutile-rich
TiO2 (Skyspring Nanomaterials, Inc., Houston, TX) were provided by Dr. Boris Lau (Baylor University, Waco, TX) and were characterized by X-ray diffraction to confirm anatase/ rutile ratios. Standard nitrous oxide (N2O) (purity: 99.99%) gas sample was purchased from Matheson (Basking Ridge, NJ). The nitrogen dioxide (NO2) standard sample was prepared by
reacting copper metal with nitric acid.50 80 ppm of NO in simulated air (80% N2and 20% O2) was prepared online by the controlled mixing of 20 sccm (standard cubic centimeter per minute) of 100 ppm of NO (balanced in N2) with 5 sccm of
UHP O2.All other gases (i.e., N2, O2, and He) discussed in this report were used“as-is” and without further refinement. Unless explicitly stated otherwise, the temperature and relative humidity of the catalytic reaction chamber (measured using a humidity sensor (model HTU21D(F), Measurement Special-ties, Hampton, VA) placed inside of the catalytic bed) were 23 ± 2 °C and 24 ± 2%, respectively. During the exposure of the TiO2catalysts to UV radiation, the temperature of the catalytic
reaction chamber increased by∼2 °C.
TiO2 catalysts used in all NO photocatalytic reactions presented in this article were used as provided (i.e., without initial UV preactivation). However, additional experiments were conducted on the photocatalytic conversion of NO in the presence of preactivated (i.e., with 15 h of UV light exposure, λmax = 365 nm) P25 and pure anatase TiO2 catalysts (nine
experimental trials were performed for each catalyst over a three-day period), but no significant changes to the NO, N2O, and NO2 trends (as compared to experiments with the
nonactivated P25 and pure anatase TiO2 catalysts) were
observed. The cryofocuser and mass spectrometer were used to continuously monitor gases released before, during, and after the exposure of the TiO2 catalyst to UV radiation (i.e., UV
pretreatment) and no released contaminants from the catalyst were detected. Hence, the TiO2catalysts utilized in this report
were utilized without any degreening/pretreatment.
2.2. Powder X-ray Diffraction (XRD). Powder X-ray diffraction (XRD) spectra of TiO2samples were obtained using
a Siemens D5000 diffractometer (formerly Siemensnow a division of Bruker Corporation, Billerica, MA) equipped with a Cu Kα radiation (λ = 1.541 84 Å, generated at 40 kV and 30 mA) source and operated in θ−2θ mode. Verification of anatase/rutile ratios for each TiO2catalyst was calculated using
the equation:51 = + − ⎛ ⎝ ⎜ ⎞ ⎠ ⎟ x I I 1 0.8 A R 1 (1)
where x is the fraction (by weight) of rutile, IA is the peak intensity for the anatase (101) peak (labeled“A” inFigure 3), and IR is the peak intensity for the rutile (110) peak (labeled
“R” inFigure 3).
2.3. Transmission Electron Microscopy (TEM). Analysis of average particle diameters was performed using transmission electron microscopy (TEM). Briefly, the pure anatase, rutile-rich, and P25 TiO2catalysts were suspended in pure ethanol
and sonicated for approximately 30 min. Concurrently, FORMVAR 15/95 (Electron Microscopy Sciences, Hatfield, PA) coated copper grids were glow discharged using an EM ACE600 (Leica Microsystems, Wetzlar, Germany) operating at 10 mA for 10 s at a working distance of 50 mm. Grids were placed for 5 min on drops of suspended titania species and air-dried.
TEM analysis was performed using a JEM-1010 (JEOL, Ltd., Tokyo, Japan) operating at 100 kV equipped with an XR16-ActiveVu camera (AMT, MA, USA) at 50000× magnification. Data processing and particle size measurements were performed using the Cell F software package equipped with the particle analysis toolkit (Olympus, Life and Material Science Europa GmbH, Hamburg, Germany).
2.4. Photocatalysis Unit. The design of the catalysis unit was similar to a previously reported photocatalyticflow reactor system equipped with a chemiluminescence NOx analyzer.31
Briefly, the catalysis unit consisted of a reaction chamber made of poly(methyl methacrylate) (length: 7.0 cm; width: 8.0 cm; height: 5.0 cm) transparent thermoplastic material (refer to Scheme 1for a simplified schematic representation of this unit).
The reaction chamber was equipped with (i) a catalyst bed (length: 4.0 cm; width: 4.0 cm; height: 0.2 cm) and (ii) a quartz window (length: 4.0 cm; width: 4.0 cm; height: 0.2 cm). The quartz window was placed on top of the catalyst bed to allow UV radiation from a UV lamp (model UVGL-25, UVP, Upland, CA) into the catalyst bed. For the experiments reported herein, the photon power density of the UV lamp positioned over the catalytic bed was 7.2 W/m2 (peak λ at 365 nm) per manufacturer’s specifications. The reaction chamber was connected to three separate gas inlets via a gas manifold. Each gas inlet was in turn connected to a dedicated gas mass flow controller (MFC) (model GM50A, MKS Instruments Inc., San Jose, CA) for controlled introduction of N2, O2, and NO gases into the reaction chamber.
2.5. Cryofocuser (CryoF) Unit. The basic design of the CryoF assembly was similar to the original design of Jacoby et al.53and our previously reported interface for GC/MS.54The CryoF assembly consisted of a capacitive discharge unit for resistive heating of the CryoF trap element (CTE). The CTE was a 10.16 cm Sulfinert stainless steel tube (inner diameter (i.d.): 0.053 cm; outer diameter (o.d.): 0.074 cm, Restek Corp., Bellefonte, PA) immersed in a Teflon (DuPont, Wilmington, DE) cup capable of holding 100 mL of liquid nitrogen (LN2). The total resistance of the CTE was 1.2Ω. Two parallel pairs of 0.1 F capacitors (i.e., a total of four capacitors) were connected in series to produce a total capacitance of 0.1 F in the discharge
unit. The capacitors within the discharge unit were electrically charged using an Agilent 500 W direct current (dc) power supply (model 6554A, Agilent Technologies, Inc., Santa Clara, CA). A dc voltage of 40 V (maximum output current of 4.0 A) was used for flash heating of the trap element. Desorption temperatures in excess of 200 °C (measured with careful calibration of the resistance change of the CTE within the LN2
bath as a function of temperature) could be achieved in the trap element during the flash heating cycle. Two brass heating blocks (length: 2.5 cm; width: 1.8 cm; height: 1.3 cm) were used on both ends of the CTE to avoid“cold spots”. The entire length of the transfer lines on both sides of the CTE was continuously heated and kept at 150 °C throughout the experiments.
During the flash heating cycle, the CTE was resistively heated by discharging the capacitors in the discharge unit onto the trap element. The capacitive discharge event was initiated upon receiving a 5 V logic level signal from the CryoF Unit microcontroller. The CryoF Unit and its associated pulse valves, flash heating cycle, and cryofocusing time were controlled using an in-house developed computer program (written in C/C++, compiled using avr-g++).55The computer program was loaded onto an Arduino Uno R3 microcontroller (Arduino, Torino, Italy) which subsequently controlled pulse valve actuations andflash heating via digitally controlled relay switches on a Relay4 Board (Microelektronika, Belgrade, Serbia).
For the experiments reported herein, various cooling periods (i.e., cryofocusing times) were utilized and the heating cycle time was held constant at 100 ms. It should be noted that heating time was governed by the time constant (τ) of the RC circuit used in the discharge unit of the CryoF, which was ∼72.8 ms (hence, a 100 ms heating cycle time was sufficient to encompass the full discharge period).
2.6. Gas Chromatography (GC). The heated transfer line from pulse valve #2 (labeled “V2” in Scheme 1) was directly connected to the injection port (kept at 100 °C) of a GC system. The GC column was a Porapak Q (length: 183 cm; i.d.: 0.21 cm; particle size: 80/100 mesh) stainless steel packed column (Restek Corp., Bellefonte, PA) housed in an SRI GC instrument (model 8610C, SRI Instruments, Las Vegas, NV). Helium (He) gas was used as the GC carrier gas with the He head pressure set to 10 psi; the GC oven temperature was isothermal at 60°C. GC effluent was directly sent into the mass spectrometer through a heated transfer line (kept at 150°C). GC was utilized only in experiments aimed at confirming the identity of N2O and thus was not included inScheme 1.
2.7. Mass Spectrometry (MS). Mass spectra were collected using a triple quadrupole (TQ) mass spectrometer (Model 1200L, formerly Varian Corp.now a division of Agilent Technologies, Inc., Santa Clara, CA) equipped with an electron ionization (EI) source operated in positive-ion mode. Electron energy was set to 70 eV. The TQMS system was operated in scan mode (i.e., Q1 → scan, Q2 and Q3 → no scan) with m/z scan range set between 14 and 100 Th (at a rate of 16 scans/s). MS instrument control and data analyses were performed using the Varian Mass Workstation software (version 6.9.1, formerly Varian Corp.now a division of Agilent Technologies, Inc., Santa Clara, CA). To ensure optimum instrument performance, standard “autotune” and instrument calibrations were performed on a daily basis prior to all MS measurements. Optimized electron multiplier voltages and standard calibration parameters (from the autotune files) Scheme 1. Simplified Schematic Representation of the
Catalysis Unit Coupled to the Cryofocuser/Triple Quadrupole MS Systema
aNote: GC is not shown in this scheme, as it was only used for
experiments confirming the identity of N2O.
were used for all subsequent data acquisitions. TQ mass spectrometer ion source and transfer line temperatures were set to 150 °C. For experiments performed without the SRI GC connected, TQ mass spectrometer ion source and main vacuum chamber pressures were generally <2.5× 10⁻³and <6.0× 10⁻⁷ Torr, respectively. Instrument, method, and sample blanks were used to identify potential chemical contaminants for back-ground correction. The ion intensities (i.e., peak areas) for the NO, N2O, and NO2species represented inFigures 1,2, and4
were corrected for ionization sensitivity (IS). Previously reported literature values of NO (i.e., 1.17) and N2O (i.e.,
1.66) were utilized for IS correction.56The IS value of 1.39 for NO2 was calculated based on the relationship between
molecular polarizability (α) and IS (i.e., IS = 0.36α + 0.30),57 usingα = 3.02 Å3for NO2.58Hence, we divided the peak areas
of NO, N2O, and NO2by 1.17, 1.66, and 1.39, respectively, to obtain their corrected peak areas.
3. RESULTS AND DISCUSSION
In the following sections, we present results from the use of a cryofocuser (CryoF)/TQ mass spectrometer coupled to a catalytic reaction unit to study nitric oxide (NO) decom-position products in either the absence or presence of TiO2 catalysts with and without UV radiation.
3.1. Catalysis Reaction Unit Coupled to a Cryofocuser/ Triple Quadrupole Mass Spectrometry System. A modular block diagram of the instrumental setup used in this study (for continuous monitoring of the products formed during the photocatalytic conversion of NO) is displayed in Scheme 1. The instrumental setup consists of three modules: (i) the catalytic reaction unit, (ii) the CryoF unit, and (iii) a triple quadrupole (TQ) mass spectrometer. The catalytic reaction unit (labeled as “Reactor” in Scheme 1) operated under continuousflow, enabling photocatalytic reactions to be performed in the presence of a preselected gas composition (via
three independent gas inlets for introduction of NO, O2, and
N2). Prior to mixing NO with N2and O2, the N2and O2flows
could be directed to bubble through or bypass a water bubbler, thus allowing control of humidity in the catalytic reaction chamber. Please note that the data presented inFigures 1, 2, and4were obtained using the experimental setup as shown in Scheme 1 and did not utilize GC which will be discussed further in subsequent sections.
In the CryoF unit, reaction products from the photoreactor were preconcentrated in the trap element. After removing most of the residual N2and O2 with a He gas purge, cryofocused
reaction products were flash-heated and introduced into the TQ mass spectrometer. Two miniature three-way pulse valves (labeled as “V1” and “V2” in Scheme 1) (Model VAC-250, Parker Hannifin Corp., Cleveland, OH) were used to control gasflow pathways during the cryofocusing and He gas purge periods. The valve “V1” operating in “normally open” mode (i.e., not actuated) allowed gas toflow from the reaction unit into the CryoF trap element (CTE) for preconcentrating reaction products; when valve “V1” was “closed” (i.e., actuated), He purge gas flowed into the CTE. The valve “V2” operating in “normally open” mode directed CTE gas flow into an exhaust vacuum pump; once valve“V2” was “closed”, the gasflow containing the desorbed preconcentrated analytes (after resistive heating of the CTE) was directed into the TQ mass spectrometer.
In the TQ mass spectrometer, the photocatalytic reaction products were detected in real time following the CryoF and subsequent He purge times. A typical sequence of events used in this study was as follows: (1) photocatalytic reaction products were transferred into the trap element for a predefined period of time (e.g., typically 60 s cryofocusing time to preconcentrate analytes), (2) “V1” was energized and He (back-pressure of 5 psi) was introduced to purge the trap element for 60 s, (3) the CTE wasflash-heated for 100 ms and
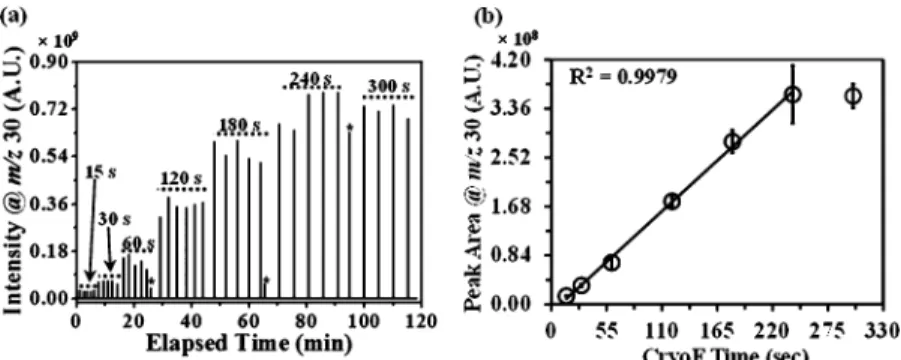
Figure 1.Representative selected ion chromatograms (SICs) for (a) NO•+(m/z 30), (b) N2O•+(m/z 44), and (c) NO2•+(m/z 46) in the absence
of TiO2catalyst and UV light. NO concentration was 80 ppm in simulated air. Insets in (b) and (c) show the expanded regions of the SIC for N2O•+
(m/z 44) and NO2•+(m/z 46), respectively.
“V2” was immediately energized to transfer the trapped compounds into TQ mass spectrometer for 100 ms, (4) TQMS data (continuous acquisition) were acquired, and (5) “V1” and “V2” were de-energized to return to step 1. These steps were repeated continuously for the entirety of each experimental run.
3.2. Detection of NO, N2O, and NO2in the Absence of
TiO2 Catalyst and UV Light. Figure 1 shows the
representative selected ion chromatograms (SICs) for (a) NO•+ (m/z 30), (b) N2O•+ (m/z 44), and (c) NO2•+(m/z
46), in the absence of TiO2 catalyst and UV light, collected after a cryofocusing time of 60 s and inlet NO concentration of 80 ppm. Results from the CryoF/TQMS showed sharp, symmetric, and reproducible MS peaks that yielded SIC peak widths of∼2 s (measured at peak base). InFigure 1a, the MS signal intensity for NO•+(m/z 30) is∼90- and ∼16-fold higher than the MS signal intensities for N2O•+(m/z 44) (Figure 1b,
inset) and NO2•+(m/z 46), respectively (Figure 1c, inset). The larger MS signal intensity for NO•+was expected, as the final gas composition was primarily NO in simulated air. Although N2and O2were still detectable by the mass spectrometer, N2 and O2signals were low compared with that of NO due to the
He purge segment of the experiment (which allowed for N2and
O2 gases to escape to the exhaust system through “V2”, as shown inScheme 1). The presence of N2O was a result of trace
N2O impurity in the NO gas composition (confirmed using
GC-MS), potentially generated in the copper59,60transfer line between the gas tank and MFC. The presence of NO2likely results from minor noncatalytic oxidation reaction of NO in the presence of oxygen.61 In order to examine the effects of cryofocusing time on the signal response of NO, we performed MS experiments measuring NO signal intensity as a function of cryofocusing time.
Figure 2a shows the SIC for NO•+(at m/z 30) at increasing cryofocusing times (from 15 to 300 s). The NO gas composition for the data shown in Figure 2was the same as that used inFigure 1. A linear increase in signal intensity for NO•+ was observed as the cryofocusing time was increased (e.g., an∼4-fold increase in NO•+signal intensity was observed when the cryofocusing time was increased from 30 to 120 s). It is important to note that theflash heating temperature must be sufficient to desorb all trapped analytes at each cryofocusing cycle. For the experiments reported here, we utilized an optimized flash heating time of 100 ms to ensure complete desorption of all NOxand N2O species. No significant changes
in NO•+signal intensity was observed after 240 s cryofocusing time (i.e., the NO•+ signal intensities at 240 and 300 s cryofocusing time are similar) due to the saturation of the EM
detector. The peaks denoted with asterisks inFigure 2a were of lower intensity (due to a system reset upon changing cryofocusing time that resulted in premature analyte release from the CTE) and were not used for the calculations inFigure 2b.
Figure 2b shows the calibration line for NO•+signal intensity (measured as the chromatographic peak area for m/z 30) detected as a function of cryofocusing time using data from Figure 2a. Each data point (denoted with empty circles) in Figure 2b corresponds to an average offive experimental trials with error bars reported at the 95% confidence level. The R-squared (R2) value (0.9979) was obtained using the linear
regression function in Microsoft Excel (Microsoft Office 7, Microsoft Corporation, Redmond, WA) for data acquired over a cryofocusing time range of 15−240 s (deemed to be the “linear range”62
for this setup). MS Data at 300 s cryofocusing time was not utilized for determining the R2value because the NO•+signal intensity was outside the linear range of the MS detection system. In the absence of analyte standards, internal calibrants can be used to calculate unknown concentrations. To estimate the concentrations of N2O and NO2, we used NO as the internal calibrant and corrected for detector response factor (i.e., IS differences between NO, N2O (1.66), and NO2
(1.39)).56,57 Because the freezing points for NO, N2O, and NO2 are all above liquid nitrogen temperature (i.e., >77 K),
cryofocusing efficiencies for these analytes were assumed to be similar.
3.3. Compositional and Structural Analysis of TiO2
Catalysts. TiO2 crystals have three naturally occurring
polymorphisms including anatase (tetragonal), rutile (tetrago-nal), and brookite (orthorhombic).63 Anatase and rutile structured TiO2 are the primary constituents of the P25
catalyst.64 To verify the purity and characterize the TiO2
catalysts (i.e., P25, “pure anatase”, and “rutile-rich”) utilized in this work, we analyzed each catalyst using powder XRD. In Figure 3, normalized intensities from the P25, pure anatase, and rutile-rich TiO2 catalysts are plotted against scattering angle. Based on the XRD data (calculations usingeq 1),51anatase and rutile compositions (by mass) were obtained for P25 (Figure 3a) as 85.9% anatase/14.1% rutile, for pure anatase (Figure 3b) as 96.9% anatase/3.1% rutile, and for rutile-rich (Figure 3c) as 25.2% anatase/74.8% rutile. The XRD data were insufficient to determine 100% compositional purity for the pure anatase catalyst sample due to signal-to-noise limitations. No rutile peaks were observed in the XRD spectra; hence, we presumed the sample to be“pure” anatase. Additionally, calcination of the pure anatase TiO2, using the procedure outlined by Li et al.,65 did not result in any significant change in the appearance of
Figure 2.(a) Selected ion chromatogram (SIC) for NO•+(m/z 30) at varied cryofocusing times (15−300 s). (b) Plot of average peak area as a function of cryofocusing time at 80 ppm of NO concentration. Error bars are reported at the 95% confidence level for n = 5 experimental trials.
XRD spectra or photocatalytic reactivity, supporting the assumption that any rutile fraction was minimal. Commercially available P25 titania photocatalyst composition has been previously reported as 78 wt % anatase, 14 wt % rutile, and 8 wt % amorphous phases.49Amorphicity of the pure anatase and rutile-rich catalysts is unknown at this time.
TEM images of pure anatase particles (Figure S1a) showed homogeneous short rod-shaped nanoparticles (average diame-ter: 28.14 ± 13.16 nm, n = 400). Rutile-rich nanoparticles (Figure S1b), however, showed three distinct particle size distributions (average diameter: 81.09± 51.53 nm, n = 400) possibly representing the separate anatase, rutile, and amorphous components. P25 nanoparticles (Figure S1c), despite also being a biphasic mixture like the rutile-rich nanoparticles, were observed to be mostly spherical and of uniform size (average diameter: 26.04± 8.68 nm, n = 400).
3.4. Photocatalytic Reaction of NO in the Presence of TiO2. We used the instrumental setup depicted inScheme 1to
analyze the products of the previously reported photocatalytic reaction of NO in the presence of P25, pure anatase, and rutile-rich TiO2 photocatalysts when exposed to UV radiation.31 When TiO2is exposed to incident UV radiation at 365 nm, an
electron is excited to yield an electron−hole (e−−h+) pair. This
excited electron can relax back (i.e., recombination) into the unoccupied molecular orbitals of the adsorbed species on the TiO2’s surface.66However, if this electron−hole pair is localized
at the surface, it can also act as an individual electron donor and electron acceptor and impact NO decomposition.31 In this study, the conventionally used standard photocatalyst, P25 TiO2, was investigated for its ability to catalyze the reduction of
NO into N2O. P25 TiO2used in this experiment was a biphasic mixture of anatase and rutile nanoparticles (Figure 3a) with an average diameter of 21 nm.64Furthermore, the photocatalytic efficiency of pure anatase TiO2 and rutile-rich TiO2 were
compared with that of the P25 TiO2catalyst. It is believed that the electron−hole pairs from the excited TiO2form primarily
on the anatase nanoparticles and the smaller rutile nano-particles function to facilitate charge transfer to the anatase nanoparticles and slow down the electron−hole recombina-tion.67 The efficient electron−hole separation with lower recombination rates observed in P25 TiO2(possessing mixed anatase−rutile phase ratios) has made P25 TiO2a benchmark
for photocatalytic reaction studies.67 However, the increased photoactivity of P25, due to proximal rutile and anatase particles, has been argued against.49
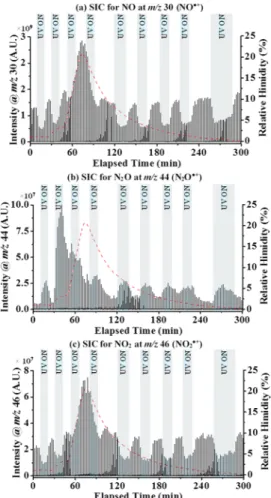
Figure 4 shows the temporal plots of normalized ion intensities for the NO, N2O, and NO2species at 80 ppm of NO (in simulated air) and a cryofocusing time of 60 s in the
presence/absence of UV light and TiO2catalysts. InFigure 4,
symbols denoted by empty triangles, empty circles, and solid circles represent NO, N2O, and NO2 ion intensities,
respectively. The plots shown in dashed and short dashed lines inFigures 4b and 4c correspond to the normalized ion intensities of NO and N2O corrected for NO•+fragment ion contribution from EI fragmentation of N2O•+, respectively.
Normalized ion intensities for the NO, N2O, and NO2species were obtained by dividing the total ion intensity of each NO, N2O, and NO2species by the sum of the total ion intensities from NO, N2O, and NO2species at each time (or data) point.
UV radiation was applied (indicated by the arrow symbol and UV“On”) at an elapsed time of 17 min and stopped (indicated by the arrow symbol and UV“Off”) at an elapsed time of 42 min. Hence, the catalytic reaction chamber was exposed to UV radiation for 25 min and was manually covered with aluminum foil to keep the chamber dark outside the UV exposure period. In Figure 4a, the normalized ion intensities for NO, N2O, and NO2 were obtained without any TiO2 catalyst in the
reaction chamber to determine the variation of the NO, N2O, and NO2 species as a result of UV radiation (control). The
temporal plot in Figure 4a shows that ion intensities for the NO, N2O, and NO2 species do not change significantly
throughout the duration of the experiment and are independent of UV radiation exposure. As expected, NO ion intensities were consistently higher than N2O and NO2ion intensities, and the observed ion intensity trends for the NO, N2O, and NO2
species corroborate with the results observed inFigure 1. The lack of any significant change (i.e., >5%) in ion intensities for the NO, N2O, and NO2species suggests that in the absence of the TiO2catalyst UV radiation does not play an important role
in the conversion of NO.
To examine the effects of the TiO2catalyst on the conversion
of NO to N2O and NO2, ∼0.50 g of P25, pure anatase, or rutile-rich TiO2photocatalysts was individually loaded into the
Figure 3.XRD spectra of (a) P25, (b) pure anatase, and (c) rutile-rich TiO2 catalysts. Letters“A” and “R” represent the anatase and rutile
peaks utilized in the catalyst composition calculations, respectively.
Figure 4. Temporal plots of normalized ion intensities (i.e., peak areas) for NO, N2O, and NO2 (a) without TiO2 catalyst, (b) with
TiO2(P25), (c) with TiO2(pure anatase), and (d) with TiO2
(rutile-rich) catalysts. NO concentration was 80 ppm in simulated air. Dashed and short dashed lines represent NO and N2O normalized ion
intensities, respectively, corrected for the NO•+ fragment ion contribution from the parent N2O•+ ion as a result of EI
fragmentation.
reaction chamber. Figures 4b−d show the normalized ion intensities for the NO, N2O, and NO2species in the presence
of the P25, pure anatase, and rutile-rich TiO2catalysts during
separate experiments. As shown inFigure 4b, the normalized ion intensities of NO, N2O, and NO2, prior to the application
of UV radiation (from elapsed time of 0 to 17 min), were stable and followed a similar trend to that observed without the catalyst (as in Figure 4a). Upon exposure of the P25 TiO2 catalyst to UV radiation (starting at an elapsed time of 17 min), a significant (i.e., >5%) decrease in NO ion intensities and an associated increase in N2O ion intensities were observed. However, when the exposure of P25 TiO2photocatalyst to UV
radiation was terminated or turned “off” (at 42 min elapsed time), NO and N2O ion intensities returned to their initial
levels after a 5−10 min delay (i.e., comparable to their respective ion intensities prior to exposure to UV radiation).
The notable changes in NO and N2O ion intensities, in
response to the P25 TiO2 photocatalysts exposure to UV radiation, suggest that N2O was the major photocatalytic
product of NO. No significant (i.e., >5%) changes were observed in NO2ion intensity in either the presence or absence
of P25 TiO2photocatalyst exposed to UV radiation.
The pure anatase TiO2photocatalyst showed trends similar
to the P25 TiO2photocatalyst for variations in NO, N2O, and
NO2 ion intensities during the UV radiation “on” period. In Figure 4c, ion intensity for NO decreased and ion intensity for N2O increased when NO was exposed to the pure anatase TiO2 photocatalyst in the presence of UV radiation, and no significant (i.e., >5%) change in NO2 ion intensity was observed.
Photocatalytic activity of the rutile-rich TiO2 catalyst was considered insignificant (∼2% decrease in NO ion intensity), in comparison to the P25 (∼32% decrease in NO ion intensity) and pure anatase TiO2(∼31% decrease in NO ion intensity) catalysts, for the conversion of NO to N2O. For example, in
Figure 4d only minor (i.e., <5%) changes were seen for the ion intensities of NO and N2O during the exposure of NO to UV
radiation in the presence of the rutile-rich TiO2photocatalyst.
Low photocatalytic activity of rutile TiO2 catalyst for
conversion of NO to N2O in the presence of UV radiation
has been previously reported.67
It is known that NO2 dimerizes to dinitrogen tetroxide
(N2O4) at lower temperatures (i.e., <−10 °C), but at temperatures >140 °C, N2O4 converts back to NO2 gas.68,69
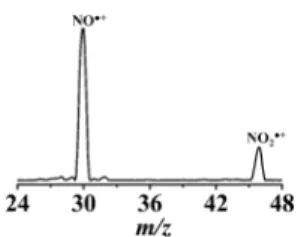
To verify if NO2is detected intact (i.e., not partially lost due to
degradation or dimerization) in the mass spectrometer after trapping (at∼−196 °C, i.e., LN2temperature) and desorption
(at >150°C), we performed cryofocusing experiments utilizing pure NO2 samples to monitor the effects of cryofocusing on
NO2. Under identical experimental conditions (i.e., He purge period, cryofocusing duration, flash heating duration and temperature, and mass spectrometry parameters) to other photocatalytic experiments reported in the article, the standard NO2 sample was detected in the mass spectrometer with no
detectable NO2degradation products other than its fragment ions (e.g., ion at m/z 30 from fragmentation of NO2 and
potential residual NO (seeFigure 5)).
Also, N2O4•+(the ionized dimer of NO2at m/z 92) was not
detected (at either 70 or 20 eV electron energies) by the mass spectrometer during any of the experiments involving the photocatalytic reaction of NO.
Summation of NO and N2O signals was higher during UV radiation exposure in the presence of TiO2 (Figures 4b and
Figure 4c) than in the absence of TiO2(Figure 4a). It might initially be expected that the summation of NO and N2O ion
intensities should in fact be less during photocatalytic conversion as the stoichiometry of NO → N2O is 2:1,
respectively. However, it should be noted that NO•+ is a commonly observed fragment ion of N2O (in the EI mass
spectrum)70 and will contribute to the overall NO•+ signal intensity. To correct for the contribution of NO•+ resulting from the fragmentation of N2O•+during EI (at 70 eV) to the overall NO•+ signal intensity, we performed EI experiments using a standard N2O sample under similar experimental (i.e., CryoF and MS) conditions as the data presented inFigure 4. The calculated NO•+ to N2O•+ ratio (i.e., 0.474) from the standard N2O was used to obtain the ion intensity contribution
of NO•+from N2O•+fragmentation. The calculated intensity of NO•+from N2O•+fragmentation was then subtracted from the
total NO•+ signal intensity (data shown in dashed lines in Figures 4b and 4c) and added to the total ion intensity for N2O•+(data shown in short dashed lines inFigures 4b and4c). Another potential method to eliminate the contribution of NO•+ from the fragmentation of N2O•+ to the overall ion intensity of NO•+ is to perform EI experiments at lower electron energies (e.g., <24 eV) and avoid NO•+fragment ion formation. Conducting EI at lower electron energy minimizes fragmentation but results in an overall reduction in sensitivity.71 We conducted EI experiments at 20 eV (the lowest electron energy available on our MS system) on the standard N2O sample and continued to observe NO•+ signal from the fragmentation of N2O•+ but with approximately 1 order of magnitude loss in sensitivity. Thus, we utilized the calculated NO•+to N2O•+ratio (obtained with EI at electron energy of 70 eV) to correct for the contribution of NO•+(resulting from the fragmentation of N2O•+) to the overall NO•+signal intensity.
In a separate experiment, a GC system was used to confirm the identity of the N2O produced during the catalytic decomposition of NO. A transfer line was inserted from valve 2 (“V2” inScheme 1) into a GC injection port to introduce the cryogenically trapped catalysis reaction products into the GC before MS detection. The GC effluent was then introduced into the MS system for m/z analysis. Retention time of the N2O
generated during photocatalysis was then compared to the retention time of a standard N2O gas sample. The standard
N2O gas sample was placed into a sealed 40 mL glass vial and transferred to the CTE element of the CryoF Unit (using a transfer line connected to valve#1 (labeled as “V1” inScheme 1)) for cryofocusing and subsequent desorption and introduction into the GC injection port. No other experimental parameters for the catalysis unit, CryoF, or mass spectrometer were modified for the aforementioned GC experiments.
The GC retention time of N2O (from the photocatalysis of
NO in the presence of P25 TiO2and UV light) was 2.004 ± 0.004 min (at 95% confidence level; n = 3) (seeFigure 6). The
Figure 5.EI (at 70 eV) mass spectrum for standard NO2(at m/z 46)
showing its major fragment ion at m/z 30.
GC retention time of the standard N2O sample was 2.002 ±
0.005 min (at 95% confidence level; n = 3) (see Figure 6). Under the same GC/MS conditions, retention time for CO2
(which also generates an ion at m/z 44) was 1.488± 0.035 min (at 95% confidence level; n = 3). The retention time for the N2O product of the photocatalytic reaction of NO statistically
matched with the retention time of the standard N2O (based
on student t test at 95% confidence level) and, combined with its mass spectral pattern, allowed us to confirm the identity of the N2O photocatalytic product.
Additional sets of experiments were performed (to deduce the role of O2gas), where only NO and N2(i.e., no O2) were
introduced into the photocatalytic reaction chamber; similar trends for NO and NO2profiles (i.e., decrease in both NO•+
and NO2•+ intensities) were observed in the presence and
absence of O2gas. However, we did not observe any conversion
of NO to N2O in the absence of O2.
Figure 7shows the ion intensities for the NO, N2O, and NO2
species in the presence of the P25 TiO2catalyst and nitrogen
gas (i.e., without any O2gas). Upon exposure of the P25 TiO2
catalyst to UV radiation (indicated by UV“on” and the dashed closed arrow symbol at an elapsed time of 16 to 47 min), a significant (i.e., >5%) decrease in NO and NO2ion intensities
was observed and no change in N2O ion intensity was detected. When the exposure of P25 TiO2photocatalyst to UV radiation
was terminated (indicated by UV“off” and the dashed closed arrow symbol at initial elapsed time of 47 min), NO and NO2
ion intensities returned to their initial levels and N2O ion intensity remained unchanged. It is possible that NO is being converted into N2 species though we did not notice any significant increase in N2•+ intensity. N2 is still a potential
product from the photocatalytic decomposition of NO in the absence of O2, but results remain inconclusive due to the
inherent limitations of trapping N2gas using a LN2cryofocuser. Future experiments with the use of NO gas balanced in helium will be performed to verify this hypothesis.
One of the major features of the TiO2 photocatalyst is the
availability of oxygen vacancies on its surface. Two Ti3+sites are
present at each oxygen vacancy, which are the primary locations for NO adsorption. Based on a previously reported mechanism,2,12 the photocatalytic conversion of NO to N2O
on Ti3+ might potentially involve the following suggested
reaction steps:
+hv→ −+ +
TiO2 e h (step 1)
+ +→ • + +
H O2 (ads) h OH(ads) H (step 2)
+ −→ + −
NO(ads) e N(ads) O(ads) (step 3)
+ −→ −
O2(ads) e O2 (ads) (step 4)
+ − → −
NO(ads) O2 (ads) NO3 (ads) (step 5)
+ • →
NO2(ads) OH(ads) HNO3(ads) (step 6)
+ →
NO(ads) N(ads) N O2 (ads) (step 7)
+ → +
− + + −
O(ads) Ti3 Ti4 O2 (lattice) (step 8)
→ +
− −
O2 (ads) O(ads) O(ads) (step 9)
→ +
− −
O(ads) O(ads) e (step 10)
+ →
2N(ads) O(ads) N O2 (ads) (step 11) →
N O2 (ads) N O2 (gas) (step 12) Briefly, the photocatalytic conversion of NO to N2O involves the adsorption of gas-phase NO molecules to the oxygen vacancies on the TiO2surface to form adsorbed NO molecules (i.e., NO(ads)). Oxygen (O2) and water (H2O) molecules also
adsorb to the surface of TiO2 to form O2(ads) and H2O(ads), respectively. An electron generated from TiO2’s exposure to
incident UV radiation (step 1) cleaves the N−O and O−O bonds in NO(ads) and O2(ads) to form an adsorbed nitrogen
atom (i.e., N(ads)) and an adsorbed oxygen anion (i.e., O−(ads)) (step 3) and O2−(ads)(step 4), respectively. The electron hole
(i.e., h+) generated in step 1 reacts with H
2O(ads)molecules to
form adsorbed hydroxyl radical (OH•(ads)) and hydrogen ion
(H+) (step 2). OH•can also form when hydroxyl anion (i.e.,
OH−) reacts with h+ (i.e., OH−(ads) + h+ → OH•(ads)). The
oxygen anion (i.e., O2−(ads)) may react with NO(ads)or NO2(ads) to form NO3−(ads) which stays bound to the surface of TiO2
(step 5).2Adsorbed NO2(i.e., NO2(ads)) reacts with OH•(ads)to form HNO3•(ads)which remains on the TiO2surface (step 6).2
An additional NO(ads)reacts with N(ads)to form adsorbed N2O (i.e., N2O(ads)) (step 7) which can in turn lose its oxygen atom
Figure 6.Selected ion chromatograms (SICs) of (a) standard N2O
sample at m/z 44 (N2O•+) and (b) NO photocatalysis product at m/z
44 (N2O•+) obtained from GC/MS analyses. The values on top of the
peaks are the average retention times (RTs) for the SIC peak maxima at m/z 44 from triplicate experiments (the error at 95% CL is included in parentheses for each value).
Figure 7.Representative selected ion chromatograms (SICs) for (a) NO•+(m/z 30), (b) N2O•+(m/z 44), and (c) NO2•+(m/z 46) in the
presence of P25 TiO2catalyst and UV light. NO concentration was 80
ppm in nitrogen environment. Arrows indicating UV“off” and “on” durations are placed on top of the SICs.
and diffuse as N2gas (i.e., N2O(g)+ e−→ N2(g)+ O−(ads)). In addition, the oxygen anion (i.e., O−(ads)) generated from NO dissociation (step 3) remains in the filled oxygen vacancy as O2−(lattice)(step 8). The adsorbed superoxide, O2−(ads)(formed
in step 4), dissociates to form adsorbed peroxide (O−)(ads)and
adsorbed atomic oxygen (O)(ads) (step 9). Adsorbed peroxide
(O−)(ads) loses its electron (e−) to form adsorbed atomic oxygen (O)(ads)(step 10). Consequently, the adsorbed oxygen atom (O)(ads) reacts with two adsorbed nitrogen atoms
(2N)(ads)to form adsorbed N2O(ads) according to the reaction
mechanism proposed by Larson et al.72 Steps 7−9, while speculative, provide a potential explanation for the notable lack of observable N2O formation in the absence of O2 gas.
However, the loss of an oxygen atom requires a sufficiently long N2O residence time at an oxygen vacancy; otherwise, it can desorb as N2O(gas) (step 12). Kim et al.14reported that N2O
does not dissociate on TiO2 surface to form N2 and O.
Moreover, it has been reported that N2O molecules are only
weakly bound to the TiO2surface with an adsorption energy of
7.73 kcal/mol;13 thus, it is likely that in this photocatalyzed reaction most of the N2O(ads)were desorbed as N2O(gas)to yield the observed MS signal at m/z 44.
The importance of water in the photocatalytic decom-position of NO in the presence of TiO2catalysts has previously
been demonstrated.2,73To explore the role of H2O in the NO
photocatalysis mechanism, we conducted experiments identical to the aforementioned experiments (i.e., the photocatalytic conversion of NO using P25 TiO2catalyst) in the absence of
water (i.e., 0% relative humidity) and in the presence of varying concentrations of water (0−23% relative humidity) (Figure 8). Initial experiments (as shown inFigure 8) displayed an increase in signal intensities for NO•+, NO2•+, and N2O•+as humidity was increased. More notably, the increase in N2O•+(Figure 8b) signal intensity occurred separately (i.e.,∼40 min prior) from the increases in signal intensity for NO•+ (Figure 8a) and NO2•+ (Figure 8c). However, after the exposure of the P25
TiO2 catalyst to 80 ppm of NO and UV radiation in the
absence of humidity (i.e., 0% relative humidity), the subsequent introduction of humidity resulted in similar releases of NO•+, NO2•+, and N2O•+ (even in the absence of UV radiation). Thus, the trends observed in Figure 8 are due to an initial increase in humidity facilitating the release of already formed N2O (from TiO2 surface) and followed by further humidity
increases releasing bound NO and NO2from the TiO2surface.
In the presence of high concentrations of H2O (i.e., at 70± 2% relative humidity), we observed similar trends (i.e., decrease in NO•+and NO2•+and increase in N2O•+intensities) to the
results obtained at lower relative humidity (i.e., at 24 ± 2%, data shown in Figure 4b) during the photocatalytic decomposition of NO in the presence of P25 TiO2 catalyst
but with a 15% lower overall NO conversion efficiency (shown inFigure S2). Although it is known that H2O provides hydroxyl radicals (HO•) which play a key role in the photocatalytic oxidization of NO (formation of NO2 and HNO3), some
reports have also stated that increases in humidity levels reduce the catalytic conversion efficiency of NO in the presence of P25 TiO2photocatalysts.
74,75
For example, Ao et al. reported that H2O vapor competes with NO adsorption sites on the TiO2 surface; thus, increasing the H2O vapor pressure reduces the availability of TiO2 active sites for NO photocatalysis.74,75
Hence, we surmise that the reduction in overall NO conversion efficiency observed in our experiments (in the presence of high
H2O vapor pressure) is because of the competition between
H2O and NO for adsorption sites on the TiO2surface.
4. CONCLUSION
We designed and constructed a novel photocatalytic reaction chamber coupled to a custom-built liquid nitrogen cryofocusing unit for mass spectrometry analysis and monitoring of nitrogen oxide species. Results from the detection of NO in the absence of TiO2catalyst indicate that NO ion intensity increases linearly
with cryofocusing time. We also showed that the major photocatalytic reaction product of the decomposition of NO in the presence of P25 TiO2and pure anatase TiO2is N2O. We anticipate the use of the cryofocusing/mass spectrometry unit coupled to the photocatalytic reaction chamber for further examination of the photocatalytic decomposition of NO in the presence of different photocatalysts and with varying experimental conditions.
■
ASSOCIATED CONTENT*
S Supporting InformationThe Supporting Information is available free of charge on the ACS Publications websiteat DOI:10.1021/acs.jpcc.5b10631.
Figure S1: representative TEM images of (a) pure anatase, (b) rutile-rich, and (c) P25 TiO2nanoparticles
Figure 8.Representative selected ion chromatograms (SICs) for (a) NO•+(m/z 30), (b) N2O•+(m/z 44), and (c) NO2•+(m/z 46) in the
presence of P25 TiO2 catalyst, UV light (shown in blue-colored
rectangular boxes and “UV ON”), and increasing relative humidity (0−23%). NO concentration was 80 ppm in simulated air. The red dotted lines overlaid on the SIC represent the relative humidity (%) of the catalytic reaction chamber during the experiment.
used in this study; Figure S2: temporal plots of normalized ion intensities for NO, N2O, and NO2with
P25 TiO2catalyst at 70± 2% relative humidity (PDF)
■
AUTHOR INFORMATIONCorresponding Author
*Tel 254-710-2678, e-mail [email protected] (T.S.).
Present Address
B.Z.: Agilent Technologies, Inc., Santa Clara, CA 95051. Notes
The authors declare no competingfinancial interest.
■
ACKNOWLEDGMENTSThe authors acknowledge thefinancial support provided by the National Science Foundation (NSF) (grant award#s 1346596 and 1455668). Any opinions, findings, conclusions, or recommendations expressed in this material are those of the authors’ and do not necessarily reflect the views of the NSF. D.A.E. and E.O. acknowledge the financial support from the Scientific and Technological Research Council of Turkey (TUBITAK) (Project Code: 113Z543). The authors also thank Mr. David LeBrecque (University of Maine, Orono, ME) for constructing the capacitor bank used in these experiments, Dr. Boris Lau (Baylor University, Waco, TX) for providing the pure anatase and rutile-rich TiO2catalysts, and Dr. Murugaeson
R. Kumar (Baylor University, Waco, TX) for preparing and providing the standard NO2 sample utilized in this study.
Thanks to Mr. Joe McCulloch of the machine shop at Baylor Sciences Building (Baylor University, Waco, TX) for assisting in construction of the catalytic reaction chamber. The authors thank Dr. Bernd Zechmann (Center for Microscopy and Imaging, Baylor University, Waco, TX) for technical support during microscopy and image analysis.
■
REFERENCES(1) Dalton, J. S.; Janes, P. A.; Jones, N. G.; Nicholson, J. A.; Hallam, K. R.; Allen, G. C. Photocatalytic Oxidation of NO Gases Using TiO2:
A Surface Spectroscopic Approach. Environ. Pollut. 2002, 120, 415− 422.
(2) Lasek, J.; Yu, Y.-H.; Wu, J. C. S. Removal of NOx by
Photocatalytic Processes. J. Photochem. Photobiol., C 2013, 14, 29−52. (3) Bowman, C. T. Control of Combustion-Generated Nitrogen Oxide Emissions: Technology Driven by Regulation. Symp. (Int.) Combust., [Proc.] 1992, 24, 859−878.
(4) Newton, M. A.; Dent, A. J.; Diaz-Moreno, S.; Fiddy, S. G.; Evans, J. Rapid Phase Fluxionality as the Determining Factor in Activity and Selectivity of Highly Dispersed, Rh/Al2O3in DeNOxCatalysis. Angew.
Chem., Int. Ed. 2002, 41, 2587−2589.
(5) Savara, A.; Sachtler, W. M. H.; Weitz, E. TPD of NO2−and NO3−
from Na-Y: The Relative Stabilities of Nitrates and Nitrites in Low Temperature DeNOxCatalysis. Appl. Catal., B 2009, 90, 120−125.
(6) Heiredal, M. L.; Jensen, A. D.; Thogersen, J. R.; Frandsen, F. J.; Friemann, J.-U. Pilot-Scale Investigation and Cfd Modeling of Particle Deposition in Low-Dust Monolithic SCR DeNOxCatalysts. AIChE J.
2013, 59, 1919−1933.
(7) Dettmer, K.; Engewald, W. Practical Gas Chromatography: A Comprehensive Reference; Springer: New York, 2014; p 1410.
(8) Haj, K. O.; Schneider, S.; Maire, G.; Zyade, S.; Ziyad, M.; Garin, F. Influence of Alumina-Supported M-Pt Catalysts in DeNOx
Reactions with M = Pd or Ir or Ru. Top. Catal. 2001, 16/17, 205−208. (9) Trichard, J. M. Chapter 7 Current Tasks and Challenges for Exhaust after-Treatment Research: An Industrial Viewpoint. Stud. Surf. Sci. Catal. 2007, 171, 211−233.
(10) Yamashita, H.; Ichihashi, Y.; Anpo, M.; Hashimoto, M.; Louis, C.; Che, M. Photocatalytic Decomposition of NO at 275 K on Titanium Oxides Included within Y-Zeolite Cavities: The Structure and Role of the Active Sites. J. Phys. Chem. 1996, 100, 16041−16044. (11) Yamashita, H.; Ichihashi, Y.; Zhang, S. G.; Matsumura, Y.; Souma, Y.; Tatsumi, T.; Anpo, M. Photocatalytic Decomposition of NO at 275 K on Titanium Oxide Catalysts Anchored within Zeolite Cavities and Framework. Appl. Surf. Sci. 1997, 121/122, 305−309.
(12) Lu, G.; Linsebigler, A.; Yates, J. J. T. Ti3+Defect Sites on TiO 2
(110): Production and Chemical Detection of Active Sites. J. Phys. Chem. 1994, 98, 11733−11738.
(13) Sorescu, D. C.; Rusu, C. N.; Yates, J. J. T. Adsorption of NO on the TiO2(110) Surface: An Experimental and Theoretical Study. J.
Phys. Chem. B 2000, 104, 4408−4417.
(14) Kim, B.; Li, Z.; Kay, B. D.; Dohnalek, Z.; Kim, Y. K. Unexpected Nondissociative Binding of N2O on Oxygen Vacancies on a Rutile
TiO2(110)-1× 1. J. Phys. Chem. C 2012, 116, 1145−1150.
(15) Dupart, Y.; Fine, L.; D’Anna, B.; George, C. Heterogeneous Uptake of NO2 on Arizona Test Dust under Uv-a Irradiation: An
Aerosol Flow Tube Study. Aeolian Res. 2014, 15, 45−51.
(16) Todorova, N.; Giannakopoulou, T.; Karapati, S.; Petridis, D.; Vaimakis, T.; Trapalis, C. Composite TiO2/Clays Materials for
Photocatalytic NOxOxidation. Appl. Surf. Sci. 2014, 319, 113−120.
(17) Polat, M.; Soylu, A. M.; Erdogan, D. A.; Erguven, H.; Vovk, E. I.; Ozensoy, E. Influence of the Sol-Gel Preparation Method on the Photocatalytic NO Oxidation Performance of TiO2/Al2O3 Binary
Oxides. Catal. Today 2015, 241, 25−32.
(18) Chen, X.; Selloni, A. Introduction: Titanium Dioxide (TiO2)
Nanomaterials. Chem. Rev. 2014, 114, 9281−9282.
(19) Schneider, J.; Matsuoka, M.; Takeuchi, M.; Zhang, J.; Horiuchi, Y.; Anpo, M.; Bahnemann, D. W. Understanding TiO2Photocatalysis:
Mechanisms and Materials. Chem. Rev. 2014, 114, 9919−9986. (20) Tuazon, E. C.; Winer, A. M.; Graham, R. A.; Schmid, J. P.; Pitts, J. J. N. Fourier-Transform Infrared Detection of Nitramines in Irradiated Amine-NOxSystems. Environ. Sci. Technol. 1978, 12, 954−
958.
(21) Wojtas, J.; Bielecki, Z.; Stacewicz, T.; Mikolajczyk, J.; Medrzycki, R.; Rutecka, B. Application of Quantum Cascade Lasers in Nitric Oxide and Nitrous Oxide Detection. Acta Phys. Polym., A 2011, 120, 794−797.
(22) McClenny, W. A.; Williams, E. J.; Cohen, R. C.; Stutz, J. Preparing to Measure the Effects of the NOxSip Call- Methods for
Ambient Air Monitoring of NO, NO2, NOy, and Individual NOz
Species. J. Air Waste Manage. Assoc. 2002, 52, 542−562.
(23) Pijolat, C.; Pupier, C.; Testud, C.; Lalauze, R.; Montanaro, L.; Negro, A.; Malvicino, C. Electrochemical Sensors for CO/NOx
Detection in Automotive Applications. J. Electroceram. 1998, 2, 181− 191.
(24) Kipping, P. J.; Jeffery, P. G. Detection of Nitric Oxide by Gas-Chromatography. Nature 1963, 200, 1314−1314.
(25) Topsoe, N. Y.; Topsoe, H.; Dumesic, J. A. Vanadian/Titania Catalyst for Selective Catalytic Reduction (SCR) of Nitric Oxide by Ammonia: I. Combined Temperature-Programmed in-Situ Ftir and on-Line Mass Spectroscopy Studies. J. Catal. 1995, 151, 226−240.
(26) Kinoue, T.; Asai, S.; Ishii, Y.; Ishikawa, K.; Fujii, M.; Nakano, K.; Hasumi, K. Direct Determination of Trace Nitrogen Dioxide by Atmospheric Pressure Lonization Mass Spectrometry (APIMS) without Conversion to Nitric Oxide. Environ. Health Prev. Med. 2000, 5, 97−102.
(27) Houtman, N.; Solouki, T.; Lad, R. J.; Freeman, C. A Breath of ...: Doctors Could One Day Check Your Health by Analyzing Your Breath. Chem. Br. 2003, 39, 28−31.
(28) Fredrick, G.; Solouki, T.; Riker, R.; Lad, R. J. In Breath Diagnostic Sensors as a Triage Tool for Pathogen Exposure, AVS Topical Conference on Understanding and Operating in Threat Environments, Monterey, CA, 2002.
(29) Down, R. D.; Lehr, J. H. Environmental Instrumentation and Analysis Handbook; Wiley-Interscience: Hoboken, NJ, 2005; p 1068.
(30) Zhang, J.; Ayusawa, T.; Minagawa, M.; Kinugawa, K.; Yamashita, H.; Matsuoka, M.; Anpo, M. Investigations of TiO2Photocatalysts for
the Decomposition of NO in the Flow System - the Role of Pretreatment and Reaction Conditions in the Photocatalytic Efficiency. J. Catal. 2001, 198, 1−8.
(31) Soylu, A. M.; Polat, M.; Erdogan, D. A.; Say, Z.; Yildirim, C.; Birer, O.; Ozensoy, E. TiO2-Al2O3 Binary Mixed Oxide Surfaces for
Photocatalytic NOxAbatement. Appl. Surf. Sci. 2014, 318, 142−149.
(32) Courbon, H.; Pichat, P. Room-Temperature Interaction of N18O with Ultraviolet-Illuminated Titanium Dioxide. J. Chem. Soc.,
Faraday Trans. 1 1984, 80, 3175−3185.
(33) Hu, S.; Apple, T. M.15n NMR Study of the Adsorption of NO
and NH3on Titania-Supported Vanadia Catalysts. J. Catal. 1996, 158,
199−204.
(34) Rusu, C. N.; Yates, J. J. T. Photochemistry of NO Chemisorbed on TiO2(110) and TiO2Powders. J. Phys. Chem. B 2000, 104, 1729−
1737.
(35) Henderson, M. A.; Szanyi, J.; Peden, C. H. F. Conversion of N2O to N2on TiO2(110). Catal. Today 2003, 85, 251−266.
(36) Freitag, J.; Dominguez, A.; Niehaus, T. A.; Hulsewig, A.; Dillert, R.; Frauenheim, T.; Bahnemann, D. W. Nitrogen (Ii) Oxide Charge Transfer Complexes on TiO2: A New Source for Visible-Light Activity.
J. Phys. Chem. C 2015, 119, 4488−4501.
(37) Kisch, H.; Bahnemann, D. Best Practice in Photocatalysis: Comparing Rates or Apparent Quantum Yields? J. Phys. Chem. Lett. 2015, 6, 1907−1910.
(38) Howitt, C.; Pitchon, V.; Maire, G. Influence of Oxygen on the Performance of a Three-Way Catalyst. J. Catal. 1995, 154, 47−55.
(39) Cant, N. W.; Angove, D. E.; Chambers, D. C. Nitrous Oxide Formation During the Reaction of Simulated Exhaust Streams over Rhodium, Platinum and Palladium Catalysts. Appl. Catal., B 1998, 17, 63−73.
(40) Mejia-Centeno, I.; Martinez-Hernandez, A.; Fuentes, G. A. Effect of Low-Sulfur Fuels Upon Nh3 and N2O Emission During
Operation of Commercial Three-Way Catalytic Converters. Top. Catal. 2007, 42−43, 381−385.
(41) Granger, P.; Parvulescu, V. I. Catalytic NOxAbatement Systems
for Mobile Sources: From Three-Way to Lean Burn after-Treatment Technologies. Chem. Rev. 2011, 111, 3155−3207.
(42) Ozensoy, E.; Peden, C. H. F.; Szanyi, J. NO2 Adsorption on
UltrathinΘ-Al2O3Films: Formation of Nitrite and Nitrate Species. J.
Phys. Chem. B 2005, 109, 15977−15984.
(43) Mikhaylov, R. V.; Lisachenko, A. A.; Shelimov, B. N.; Kazansky, V. B.; Martra, G.; Alberto, G.; Coluccia, S. FTIR and TPD Analysis of Surface Species on a TiO2Photocatalyst Exposed to NO CO, and
NO-CO Mixtures: Effect of Uv-Vis Light Irradiation. J. Phys. Chem. C 2009, 113, 20381−20387.
(44) de Zeeuw, J. Can I Analyze NO, N2O and NO2via GC;http://
Blog.Restek.Com/?P=4583, last accessed April 28, 2015.
(45) Sich, I.; Russow, R.15n Analysis of Nitric Oxide and Nitrous
Oxide by Cryotrap Enrichment Using a Gas Chromatograph Quadrupole Mass Spectrometer and Its Application to 15n-Tracer
Investigations of NO/N2O Formation in Soil. Rapid Commun. Mass
Spectrom. 1999, 13, 1325−1328.
(46) Lim, T. H.; Jeong, S. M.; Kim, S. D.; Gyenis, J. Photocatalytic Decomposition of NO by TiO2Particles. J. Photochem. Photobiol., A
2000, 134, 209−217.
(47) Heo, I.; Kim, M. K.; Sung, S.; Nam, I.-S.; Cho, B. K.; Olson, K. L.; Li, W. Combination of Photocatalysis and HC/SCR for Improved Activity and Durability of DeNOx Catalysts. Environ. Sci. Technol.
2013, 47, 3657−3664.
(48) Ao, C. H.; Lee, S. C. Enhancement Effect of TiO2Immobilized
on Activated Carbon Filter for the Photodegradation of Pollutants at Typical Indoor Air Level. Appl. Catal., B 2003, 44, 191−205.
(49) Ohtani, B.; Prieto-Mahaney, O. O.; Li, D.; Abe, R. What Is Degussa (Evonik) P25? Crystalline Composition Analysis, Recon-struction from Isolated Pure Particles and Photocatalytic Activity Test. J. Photochem. Photobiol., A 2010, 216, 179−182.
(50) Petrusevski, V. M.; Taseska, M.; Monkovic, M. Reaction of Copper with Fuming Nitric Acid: A Novel Lecture Experiment in Passivation. Chem. Educ. 2005, 10, 208−210.
(51) Bakardjieva, S.; Subrt, J.; Stengl, V.; Dianez, M. J.; Sayagues, M. J. Photoactivity of Anatase-Rutile TiO2 Nanocrystalline Mixtures
Obtained by Heat Treatment of Homogeneously Precipitated Anatase. Appl. Catal., B 2005, 58, 193−202.
(52) Sabyrov, K.; Burrows, N. D.; Penn, R. L. Size-Dependent Anatase to Rutile Phase Transformation and Particle Growth. Chem. Mater. 2013, 25, 1408−1415.
(53) Jacoby, C. B.; Remple, D. L.; Gross, M. L. In A Cold Trap/ Pulsed Valve GC/FTMS Interface: Ultra-Trace Analysis, Proceeding of the 38th ASMS Conference on Mass Spectrometry and Allied Topics, Tucson, AZ, 1990; pp 840−841.
(54) Luo, Z.; Heffner, C.; Solouki, T. Multidimensional GC-Fourier Transform Ion Cyclotron Resonance MS Analyses: Utilizing Gas-Phase Basicities to Characterize Multicomponent Gasoline Samples. J. Chromatogr. Sci. 2009, 47, 75−82.
(55) Banzi, M. Getting Started with Arduino; O’Reilly Media, Inc.: 2009.
(56) Nakao, F. Determination of the Ionization Guage Sensitivity Using the Relative Ionization Cross-Section. Vacuum 1975, 25, 431− 435.
(57) Bartmess, J. E.; Georgiadis, R. M. Empirical Methods for Determination of Ionization Gauge Relative Sensitivities for Different Gases. Vacuum 1983, 33, 149−153.
(58) Miller, T. M. Atomic and Molecular Polarizabilities. In CRC Handbook of Chemistry and Physics, 95th ed.; Lide, D. R., Frederikse, H. P. R., Eds.; CRC Press Inc.: Baton Rouge, LA, 2014; pp 193−202.
(59) Brown, W. A.; Sharma, R. K.; King, D. A.; Hag, S. Adsorption and Reactivity of NO and N2O on Cu{110}: Combined Rairs and
Molecular Beam Studies. J. Phys. Chem. 1996, 100, 12559−12568. (60) Dumas, P.; Suhren, M.; Chabal, Y. J.; Hirschmugl, C. J.; Williams, G. P. Adsorption and Reactivity of NO on Cu(111): A Synchrotron Infrared Reflection Absorption Spectroscopic Study. Surf. Sci. 1997, 371, 200−212.
(61) Wiberg, E.; Wiberg, N.; Holleman, A. F. Inorganic Chemistry; Academic Press: San Diego, 2001; Vol. 1 p 1884.
(62) Harris, D. C. Quantitative Chemical Analysis, 8th ed.; W.H. Freeman and Company: New York, 2010; Chapter 4, pp 68−95.
(63) Diebold, U. The Surface Science of Titanium Dioxide. Surf. Sci. Rep. 2003, 48, 53−229.
(64) Sigma-Aldrich, Titanium(IV) Oxide;http://Www.Sigmaaldrich. Com/Catalog/Product/Aldrich/718467?Lang=En&Region=Us, last accessed June 30, 2015.
(65) Li, G.; Li, L.; Boerio-Goates, J.; Woodfield, B. F. High Purity Anatase TiO2 Nanocrystals: Near Room-Temperature Synthesis,
Grain Growth Kinetics, and Surface Hydration Chemistry. J. Am. Chem. Soc. 2005, 127, 8659−8666.
(66) Shapovalov, V.; Stefanovich, E. V.; Truong, T. N. Nature of the Excited States of the Rutile TiO2(110) Surface with Adsorbed Water.
Surf. Sci. 2002, 498, L103−L108.
(67) Hurum, D. C.; Agrios, A. G.; Gray, K. A.; Rajh, T.; Thurnauer, M. C. Explaining the Enhanced Photocatalytic Activity of Degussa P25 Mixed-Phase TiO2Using Epr. J. Phys. Chem. B 2003, 107, 4545−4549.
(68) Yu, Q.; Gao, H. A Simple Determination of the NO2
Dimerization Equilibrium Constant. J. Chem. Educ. 1997, 74, 233− 234.
(69) Leenson, I. A. Approaching Equilibrium in the N2O4-NO2
System: A Common Mistake in Textbooks. J. Chem. Educ. 2000, 77, 1652−1655.
(70) Southan, G. J.; Srinivasan, A. Nitrogen Oxides and Hydroxyguanidines: Formation of Donors of Nitric and Nitrous Oxides and Possible Relevance to Nitrous Oxide Formation by Nitric Oxide Synthase. Nitric Oxide 1998, 2, 270−286.
(71) Vekey, K. Internal Energy Effects in Mass Spectrometry. J. Mass Spectrom. 1996, 31, 445−463.
(72) Larson, R. S.; Pihl, J. A.; Chakravarthy, V. K.; Toops, T. J.; Daw, C. S. Microkinetic Modeling of Lean NOx Trap Chemistry under
Reducing Conditions. Catal. Today 2008, 136, 104−120.
(73) Devahasdin, S.; Fan, C.; Li, K. J.; Chen, D. H. TiO2
Photocatalytic Oxidation of Nitric Oxide: Transient Behavior and Reaction Kinetics. J. Photochem. Photobiol., A 2003, 156, 161−170.
(74) Ao, C. H.; Lee, S. C.; Mak, C. L.; Chan, L. Y. Photodegradation of Volatile Organic Compounds (VOCs) and NO for Indoor Air Purification Using TiO2: Promotion Versus Inhibition Effect of NO.
Appl. Catal., B 2003, 42, 119−129.
(75) Ao, C. H.; Lee, S. C.; Yu, J. C. Photocatalyst TiO2Supported on
Glass Fiber for Indoor Air Purification: Effect of NO on the Photodegradation of CO and NO2. J. Photochem. Photobiol., A 2003,
156, 171−177.