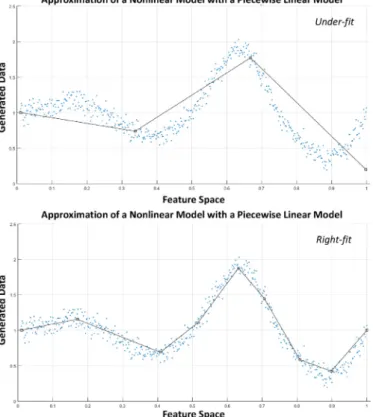
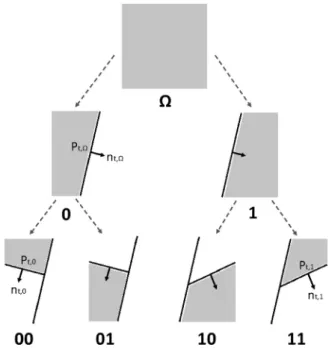
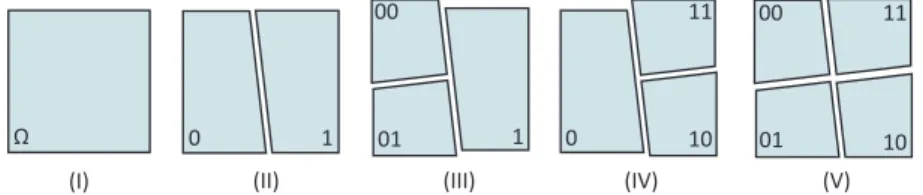
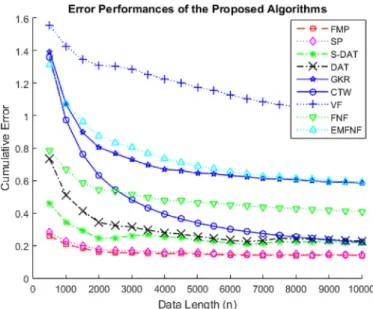
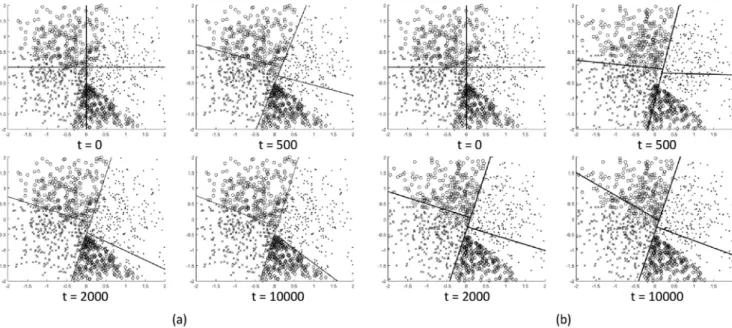
Highly efficient hierarchical online nonlinear regression using second order methods
Tam metin
Şekil

Benzer Belgeler
3-Görme olayı ile ilgili eski tarihlerden günümüze kadar birçok bilim adamı çalışmalar yapmıştır. Aristo cisimlerden çıkan ışık sayesinde
H 0 (13) : Uygulama öncesinde öğrencilerin bilgisayar tutumları ile ön-test başarı puanları arasında istatistiksel olarak anlamlı bir fark yoktur.. H 0 (14) : Deney ve
In this paper, we have studied the positioning problem in cooperative network using the hybrid two-way time of arrival and time difference of arrival in the presence of an
In binary mode the source node starts with L copies of the message; any node A (source or relay) that carries n > 1 message copies, and meets another node B which does not have
The decline in formal employment in recent years, with all the consequences this has in terms of social security coverage, the financial position of funds and social ex- clusion,
1941’den 1951’e kadar ‹ktisat Fakültesinde doçentlik kadrosunda görev yapan Ülgener, bu y›lda fakülte dekanl›€›na müracaatla “‹ktisat ve Maliye
The state aid practices provided during the preparation phase are UR-GE (Supporting the Development of International Competitiveness) Support and Supporting Market Entry
Fatih İstanbulu fethettikten sonra, I- talyadan getirttiği Bellini Türk resim sanatı üzerinde büyük tesirler yapmış; bundan sonradır ki, Osmanlı resimleri
