HF
1585,4
A THESIS PRESENTED BY FATMA COŞAR TO
TO THE INSTITUTE OF
ECONOMICS AND SOCIAL SCIENCES
IN PARTIAL FULFILLMENT OF THE REQUIREMENTS FOR THE DEGREE OF MASTER OF ARTS
IN THE SUBJECT OF INTERNATIONAL RELATIONS
BILKENT UNIVERSITY JUNE, 1993
n
■
І Э 5 3
thesis for the degree of Master of Arts in International Relations.
\/l t
As s t . Prof . Dr . Giilgiin Tuna
I certify that I have read this thesis and in my opinion it is fully adequate, in scope and in quality, as a
thesis for the degree of Master of Arts in International Relations.
aJ UK
Dr. Nur Bilge Criss
I certify that I have read this thesis and in my opinion it is fully adequate, in scope and in quality, as a
thesis for the degree of Master of Arts in International Relations.
Dr. Serdar Giiner
Approved by the Institute of Economics and Social Sciences.
I . INTRODUCTION... 1
II. PART I: Export Promotion In Theory... 4
a. Protectionism... 6
b. Export Promotion...9
c . Characteristics of an EP Strategy.... 10
II. PART II: Export Promotion In Practice: The NIC Performance... 18
a . Statistical Success... 19 b.Hong Kong... 32 c . Singapore...37 d . Taiwan...42 e. South Korea... 48 f. Toward an Explanation...53
III. PART III: Export Promotion In Practice: The Turkish Performance... 66
a. Reforms of the 1980s...73
b. Reform Policies in Detail...75
c. The results of Reforms...80
d. Toward an Explanation... 103
IV. CONCLUSIONS... 114
economically dynamic part of the Third World. Small countries with little in the way of domestic markets or natural resources, such as Taiwan, South Korea, Hong Kong, and Singapore, experienced rapid economic growth with improved quality of life indicators based on export- oriented production of manufactured goods under the Export Promotion (EP) trade strategy.
When these four countries prospered beyond expectations, questions arose in the field of international political economy : What were the specific conditions that made possible the success of an EP strategy in these ’'newly industrializing countries (NIGs)”? Do other developing countries have a similar chance of success with the EP model ?
During the 1980s Turkey employed a similar strategy of trade liberalization with economic reforms of stabilization. However, although high export levels and economic growth rates were acquired, the implementation of the EP strategy in Turkey failed to control inflation and unemployment and to correct the unequitable distribution of income.
The relatively less impressive success of the Turkish economy under the EP strategy raises questions such as : What are the reasons for the differences in the performances of Turkey and the NICs ?
questions. Part I is designed as a brief review of the literature on the EP strategy in an effort to provide a theoretical basis for the topic. Part II, ’’Export Promotion in practice : the NIC performance” assesses the success of the NICs under the EP strategy by examining the implementation of the strategy in NICs, together with the economic background, government policies and the statistical measures of the performances of the four countries in question. This part also attempts to provide an explanation for the success of NICs through an analysis of factors unique to these countries and examines the possible consequences of the adoption of EP by other developing countries.
Part III analyzes the implementation of the same strategy in Turkey. To better understand the roots of Turkish foreign trade policies, Part III provides a brief overview of the economic and political background of the Turkish economic structure and also includes an extensive description of the reforms of the 1980s. After an examination of the indicators of economic performance in Turkey under these reforms. Part III also includes an attempt to explain the reasons for the relatively lower success rates of Turkey under the EP strategy in comparison with the NICs.
The conclusion of the study draws the results of this comparative analysis and discusses possible prospects for the Turkish economy.
I.EXPORT PROMOTION IN THEORY
In the 1950s many developing countries, especially Latin American countries such as Argentina, Uruguay, and others which became part of the world international trade as primary product producers-exporters, implemented inward-oriented trade policies with high trade barriers, tariffs and regulations, trying to foster industrialization through import-substitution in an effort to raise growth rates and living standards, and to reduce ’dependence” on the international division of labor .
These efforts and policies were mostly based on the rejection of the doctrine of comparative advantage and were also associated with the policy prescription that developing countries should specialize in the production and export of primary commodities in exchange of manufactures,
However, in the 1960s, after a period of experimentation with inward-oriented trade policies, most of these countries switched to export promotion (EP) and displayed varying rates of economic growth and success. Although, in the late 20th century export promotion has itself become a major strategy used to acquire foreign exchange (for imports) and to promote economic growth, it is beneficial to examine first the Liberal theory of international trade as the basis of the export promotion strategy and then analyze export promotion itself.
The Liberal international trade theory rests
ultimately upon the belief that economic specialization produces gains in productive efficiency and national income. In The Wealth of Nations (1776) Adam Smith argued that the key to national wealth and power was the division of labor dependent upon the scale of the market.
Building on Smith's ideas, Ricardo established the law of comparative advantage and demonstrated that international trade is mutually beneficial. According to Ricardo, countries will tend to specialize in those commodities whose costs are comparatively lowest. Even though a nation may have an absolute advantage in the production of every good, specialization in those goods with the lowest comparative costs, leaving the production of other goods to other countries, enables all to gain more from trade.
The neoclassical reformulation of the liberal theory has become known as the Heckscher-Ohlin-Samuelson (H-O) model of international trade and was the standard liberal position of the 1980s. The theory maintains that a nation’s comparative advantage is determined by the relative abundance and most profitable combination of its several factors of production, such as capital, labor, resources, management, and technology.
The above mentioned formulations on international trade from Ricardo to H-0 represent the classical and neoclassical theories and examine a world economy of the past. Unlike these, newer theories attempt to account
for a world in which capital is highly mobile and
products are exchanged at every step of the process, from technological knowledge to the final product itself (Gilpin 1987, 177).
In this new economic environment the rise of Japan and the NICs has led to an important change in the status of the concept of comparative advantage. This fundamental principle of liberal trade theory has lost some of its relevance and predictive power (Corden 1984, a). Thus, classical liberalism’s explanation of trade patterns, based on the intensity and abundance of the factors of production, is of declining relevance to a world of intra-industry trade and rapid technological diffusion. Now comparative advantage is regarded as a dynamic product of corporate and state policies (Gilpin 1987, 178).
PROTECTIONISM
While examining liberal trade policy as a basis for export promotion, economic protectionism and its main arguments against free trade should also be analyzed in an effort to understand why most countries adopt protectionist policies and to acknowledge the limitations of the liberal trade theory.
Liberals believe that protectionism is a test to see whether a nation really does have an inherent comparative advantage in a particular industry. They regard protectionism as a necessary but temporary venture and a
stepping stone to a system of free trade (Gilpin 1987, 185) .
Economic nationalists, on the other hand, tend to regard protectionism as an end itself. Their foremost objective, in the short run, is state building and industrial power. The fundamental purpose of a tariff is to establish particular industries.
a) The Infant Industry Argument:
According to this argument, when a difference exists between marginal social and marginal private costs, free trade may not allow a country's true comparative advantage situation to develop. In such a situation, trade, according to this view, should be temporarily protected during its initial high cost period, until a stable pattern of international specialization is established (Tuna 1988, 9).
The basis for the infant industry argument is the lowering of production costs through an educative
process. To be able to compete with foreign producers on equal terms, the infant industry should grow in size and become mature through a process of ’’learning by doing.” Only through this way can an infant industry lower its costs and overcome the disadvantages of being an ’’infant . ”
Against this argument free trade advocates claim that when all infant industries receive protection, none of them receive a special benefit and thus, a devaluation or
deflation is more preferable to protection in the form of tariffs and subsidies (Tuna 1988, 10). According to advocates of the export promotion policy, there exists no
justifiable point in the infant industry argument that indicates that import substitution, or more generally protection, is preferable to an unbiased or export- oriented strategy for trade and growth (Krueger 1984, 148) .
b) The Optimum Tariff Argument:
In order to improve their terms of trade, Less Developed Countries (LDCs) are inclined to use tariff restrictions. However, for most LDCs such a policy argument tends to be irrelevant since very few of them possess monopoly or monopsony power to maintain income transfer through an improvement of terms of trade.
c) Balance of Payments Argument:
In an effort to reduce their balance of payments deficit, both Developed Countries (DCs) and LDCs use tariffs from time to time. Such a policy may seem to be optimal in the short run, however, in general, a reduction in the expenditure or a devaluation is considered to be more preferable.
d) Distortions In the Factor Markets :
In the presence of large unskilled unemployed labor in most LDCs with high industry wages and low
agricultural wages, a tariff on importable industry is sometimes advocated as an offset against high cost of labor. However, given the imperfections of the labor
market in the LDCs, a tariff leads to an inefficient resource allocation and can never be an optimal policy. Subsidies should be preferred instead of tariffs (Tuna 1988, 11).
EXPORT PROMOTION :
Export Promotion (EP) or Export-Led Growth model emphasizes the importance of an outward-oriented trade strategy for the economic growth of developing countries. A trade policy based on Export Promotion is the one in which there is no bias of the incentive structure toward favoring production of import substitutes. Under Export Promotion some industries may be encouraged by special incentives. However, those incentives would be at least as great for the production of exports than for production for sale in domestic markets. An export- oriented policy entails less of a departure from free trade and equalized incentives than the Import Substitution strategy (Krueger 1984, 140).
According to this model, export earnings enable developing countries to import capital goods and the intermediate inputs necessary for investment and production at full potential. Exports have been a significant factor in overcoming external debt problems and also in achieving high levels of growth. Postwar
experience has shown that countries that attained high export levels have also achieved high economic growth
some LDCs with external debt problems to make orderly payments on their debt from 1973 to 1983 (Cline 1983,
1 2 0
) .The EP strategy can also be considered as the 1970s version of the '’engine of growth" approach. This approach differs from the orthodox-free-trade argument in that, it emphasizes resource allocation and structural adjustment, and hence, considers short- as well as long-term problems of development.
The supply effects expected from the liberalization of the external sector of the economy stemmed from the belief that export promotion would lead to an improvement in the balance of payments that, in turn, would favorably affect the imports of capital goods, raw materials, and other inputs, expanding the supply capacity of the economy (Khan 1987, 48).
CHARACTERISTICS OF AN EXPORT PROMOTION STRATEGY :
In an Export Promotion strategy exporters (also importers) are permitted ready access to intermediate and capital goods. Under such a strategy, exchange rates are fairly realistic and there exist equal incentives to sell abroad as well as to sell domestically, with the consequence that most firms base their capacity on expected domestic and foreign sales.
Under EP most incentives are structured in such a way that they apply to all exporters and are based on either the dollar value of export sales or the value
added in export sales. This results in a uniformity in the incentives confronting producers of different products, at least in the export markets.
In addition, export oriented policies generally avoid the use of tariffs and the quantitative restrictions in an effort to ease exporters' access to international market at international prices.
According to Krueger, contrary to the inherent view in the Import Substitution strategy, becoming a part of the international market through free trade reduces dependence on the international economy. Under Export Promotion strategy dependence on the international economy is reduced since foreign exchange earnings necessary for the purchase of imported inputs and capital goods grow rapidly, markets become increasingly diversified and the economy more flexible (Krueger 1984, 142) .
An export-oriented strategy permits a developing country to establish economically efficient sizes of plants and to maintain long production runs, regardless of the size of its domestic market. Thus, a developing country can overcome the limitations of a small domestic market, at least for traded goods under an EP strategy. Moreover, in such an economy specialized products that are not produced domestically can be obtained at internationally competitive prices.
Usually, unskilled labor constitutes the basis of the resource endowment of developing countries. It is
widely recognized that the rate of human and physical formation together with the abundant unskilled labor forms a constraint on expanding the industrial sector in most LDCs .
According to Nas , when factor proportions differ significantly among industrial sectors, Export Promotion strategy leads to a more rapid growth of value added and employment of unskilled labor in industry for the same rate of human and capital formation under other strategies. Especially when there exists a wide range of factor intensities for industrial processes, countries whose economies are outward-oriented (toward
international market) will experience fairly rapid expansion of the relatively unski11ed-1abor-using industries (Nas 1988, 30).
Another characteristic of the Export Promotion strategy is that, under such a liberal trade regime, exporters have access to international markets for their intermediate inputs. They are able to reduce production costs, since their freedom of choice under the EP strategy permits them access to the cheapest source. Thus, exporters have the opportunity to consider quality, delivery date, reliability and other advantages while purchasing intermediate goods.
Under the Export Promotion strategy the economic behavior of businessmen, investors, entrepreneurs and engineers also follow a different path, due to the competitive environment. In Import Substitution, the
absence of competition probably reduces the concern of entrepreneurs about economic efficiency. High-cost firms lose their market share and low-cost firms expand more slowly. Low-cost firms can expand at a desired rate unconstrained by raw material availability or the price elasticity of domestic demand for the firm’s product (Lee 1992, 190).
Factors To Be Considered Under Export Promotion:
The economic and trade policies that countries follow usually reflect themselves in the export performance of those countries. The policies of high protection and the overvaluation of exchange rates followed by many developing countries in the 1950s and 1960s caused poor export performance for many developing count r i e s .
Therefore, the trend has shifted to outward-oriented trade policies based on EP strategy instead of placing emphasis on IS. However, according to some analysts, while adopting an Export Promotion policy, certain factors should be taken into consideration in order to reach high export growth levels and also to benefit from the efficiency-stimulating influence of international compe t i tion.
According to Meier, if the export sector is to be a propelling force in development, it should not remain separated from the rest of the economy ; instead it should be an ’’integrated sector.” An integrated process should be established, diffusing stimuli from the export
sector and creating responses elsewhere in the economy (Meier 1989, 389). Hence, in the ”integrative-process” different export commodities should provide different stimuli according to the technological characteristics of their production.
In other words, the developments and the production in the export sector should have linkage effects which also benefit the other sectors in the economy. For example, more favorable linkages may stem from exports that require skilled labor than from those using unskilled labor through the movement of educated, skilled workers to other sectors (Meier 1989, 390).
Apart from the linkages that originate from the export sector, under EP the nature of the production of the export commodity also constitutes an influence on the overall economy by determining the distribution of income and in turn , the pattern of local demand and employment. The use of different factor combinations affect the relative shares of profit, wages, interests, and rent according to the labor or capital intensity of the export production and the nature of its organization.
However, for the Export Promotion strategy to be effective in stimulating the growth of the economy, certain conditions such as ; a developed infrastructure for the economy, well established market institutions, extensive human resources, limited price distortions that affect resource allocations, and a capacity to bear risks are necessary (Meier 1989, 392).
Policy Effects :
The commitment to an export-oriented development strategy implies a fairly liberal trade regime which would prevent paperwork, delays, bureaucratic regulation, and other costs that can arise under more protectionist regimes.
Gilpin points out that the most important lesson to be drawn from Japan and the NICs (successful employers of the Export Promotion policy as a trade strategy) relates to the changing conception of comparative advantage. These countries have demonstrated that comparative advantage in a macro sense can be created through appropriate national policies that facilitate the accumulation of the factors of production (Gilpin 1987, 214) .
The trade policy of a country, containing restrictions/incentives, regulations, discriminations, and so on, greatly influences the trade performance, industrial growth and the overall success of the economy.
The government policy instruments that seek to regulate and control through negative means are less likely to achieve the intended results than those that create incentives for individuals to carry out desired courses of activity.
For example, if exchange rate is permitted to become overvalued, lagging exports are more visible under Export Promotion than are the rising premiums by Import Substitution. Similarly, under highly restrictive
quantitative restrictions, the reward for evading them is substantial and the enforcement is possible only with detailed scrunity of all incoming goods.
According to Krueger, in Export Promotion unrealistic exchange rates can be maintained only if export subsidies continue to make exporting profitable . However, when overvaluation of the currency increases, the cost of subsidies also grows and these costs provide feedback and incentives for officials to support moves toward a realistic exchange-rate (Krueger 1984, 151).
By its nature, an Export Promotion policy rewards exporters and is nondiscriminatory among exportables. Moreover, under such a strategy misrepresentation of performance is smaller since the surrender of foreign exchange proceeds is sufficient proof of exports. In any case, a fairly realistic exchange rate under Export Promotion provides little incentive for misrepresenting performance.
On the other hand, an important aspect of the EP strategy is the realization that it is a policy that requires long-term perspective which forsees the elimination of barriers on all present and future goods.
The implication of this requirement is that a long term political commitment is needed for the success of EP strategy. Here, the dilemma is that the probable adverse effects of liberalization on employment and income distribution under the EP strategy in the short-run may render it politically unacceptable and may lead
to an "on and off" approach to liberalization and hence to its failure (Calvo 1987, 15).
Thus, if implemented with a long-term perspective and total commitment, the EP strategy, with its positive means of trade regulation and incentives may lead to rapid economic growth through increased volume of exports. The following chapters include descriptions of the NIC and Turkish performance under the EP strategy in an effort to provide an insight on the reasons for the difference in the results of the strategy.
II· EXPORT PROMOTION IN PRACTICE : THE NIC PERFORMANCE
In 1973 a dozen countries accounted for 84 % of the exports of manufactured goods from developing countries : Argentina, Brazil, Chile, Colombia, Hong Kong, Singapore, Taiwan, and Yugoslavia. By 1976 developing countries that exported manufactures on a global scale had narrowed down to South Korea, Hong Kong, Taiwan, and Singapore from East Asia, India from South Asia and Brazil, Mexico and Argentina from Latin America. Together these eight countries accounted for over three quarters of the manufactured exports from the developing world in 1976
(Turner 1982 , 10) .
The East Asian NICs have continued to be the most dynamic exporters of manufactures and they are the largest in volume. The Export Promotion (EP) strategy and export-led growth, through making the best use of comparative advantage (based on skilled labor) has become the hallmark of the four East Asian NICs and they are of the greatest interest in understanding the NIC phenomenon and how EP leads to economic success in certain count r i es .
After providing the background information and statistical data on these countries this chapter will examine the implementation of the EP strategy in four East Asian NICs and will question the reasons for their success, through questions such as: Why were they able to export large volumes of manufactured goods and achieve
high growth rates under the EP strategy? Which factors inherent in these countries' culture, political and social environment and in their implementation of the EP strategy have led to higher economic growth when compared with other LDCs that used the same strategy?
INDICATORS OF SUCCESS : THE STATISTICS
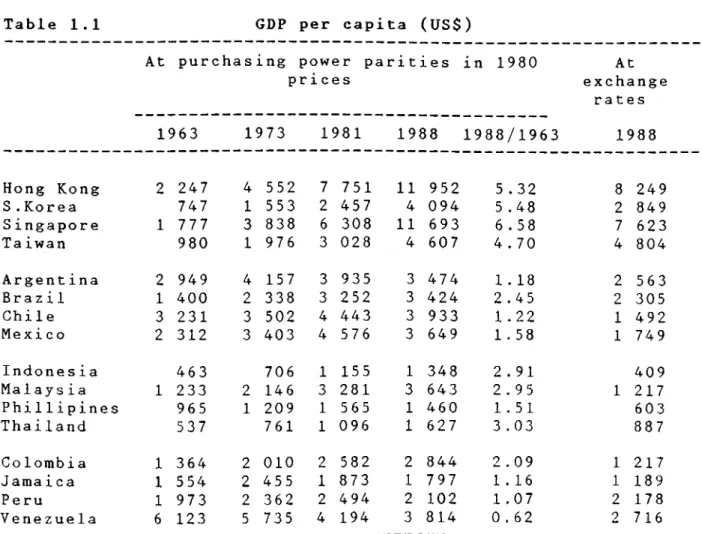
In 1963, Pacific Area developing countries had relatively low income levels. Apart from Hong Kong and Singapore they had lower per capita incomes than many of the Latin American countries. The situation changed dramatically in the following 25 years. By 1988, all four of the East Asian NICs surpassed the per capita incomes of every Latin American country. During the 1963- 1988 period, the per capita incomes of the four East Asian NICs increased between four and a half and six times (Balassa 1991, 1). [ See Table 1.1 for data and explanation]
Exports
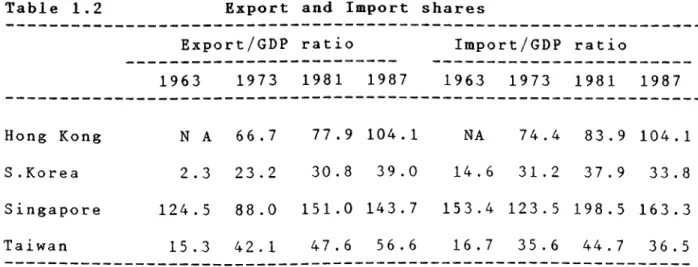
The East Asian NICs attained high rates of economic growth in an open economy as shown by their high export- GDP ratios [See Table 1.2 ]. In South Korea and Taiwan, the export-GDP ratio increased greatly between 1963 and 1987, indicating the leading role of exports in the growth process. This was also the case in Hong Kong and Singapore which already had high export-GDP ratios at the beginning of the period.
Table 1.1 GDP per capita (US$)
At purchasing power parities prices in 1980 At exchange rates 1988 1963 1973 1981 1988 1988/1963 Hong Kong 2 247 4 552 7 751 11 952 5.32 8 249 S.Korea 747 1 553 2 457 4 094 5.48 2 849 Singapore 1 777 3 838 6 308 11 693 6.58 7 623 Taiwan 980 1 976 3 028 4 607 4.70 4 804 Argentina 2 949 4 157 3 935 3 474 1 . 18 2 563 Brazil 1 400 2 338 3 252 3 424 2.45 2 305 Chile 3 231 3 502 4 443 3 933 1.22 1 492 Mexico 2 312 3 403 4 576 3 649 1 . 58 1 749 Indones ia 463 706 1 155 1 348 2.91 409 Malaysia 1 233 2 146 3 281 3 643 2.95 1 217 Phillipines 965 1 209 1 565 1 460 1.51 603 Thai land 537 761 1 096 1 627 3.03 887 Colombia 1 364 2 010 2 582 2 844 2.09 1 217 Jamaica 1 554 2 455 1 873 1 797 1.16 1 189 Peru 1 973 2 362 2 494 2 102 1.07 2 178 Venezuela 6 123 5 735 4 194 3 814 0.62 2 716
Source : World Bank , World Development Report, 1989
Explanation : Table 1.1 provides the data for the benchmark years of the 1963-73 period of the world economic boom, the 1973-81 period of two oil shocks, and the 1981-88 period of the debt crisis.
Table 1.2 Export and Import shares
Export/GDP ratio Import/GDP ratio
1963 1973 1981 1987 1963 1973 1981 1987
Hong Kong N A 66.7 77 . 9 104.1 NA 74.4 83.9 104.1
S.Korea 2.3 23.2 30.8 39.0 14.6 31.2 37.9 33.8
Singapore 124.5 88.0 151.0 143.7 153.4 123.5 198.5 163.3 Taiwan 15 .3 42.1 47.6 56.6 16.7 35 . 6 44.7 36.5
Sources : GDP and exchange rate data are from the International Monetary Fund (IMF), International Financial
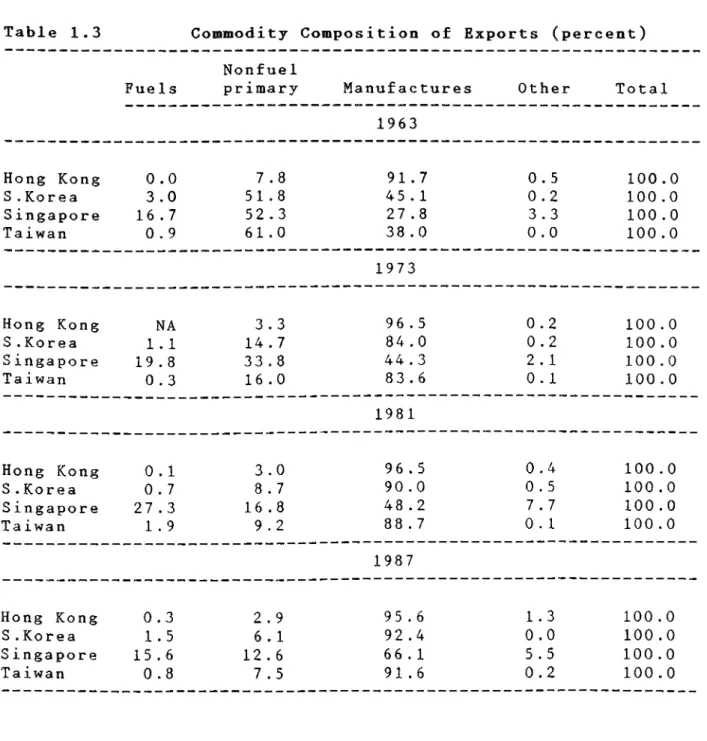
Export expansion in the NICs involved an increasing shift towards manufactured exports. In Taiwan, the share of manufactured goods in total exports rose from 38 % in 1963 to 91 % in 1987 \ in South Korea, the corresponding figures were 45 % and 92 % [ see Table 1.3 ]. Smaller changes occurred in Hong Kong, which already had a 92 % manufactured export share in 1963, and in Singapore, where entrepot trade in primary products was of importance (Balassa 1991, 6).
Data on manufactured exports shares are affected by the availability of natural resources, especially oil. Per capita manufactured exports provides an indication of a country's success in these products. Table 1.4 shows rapid expansion of manufactured exports in the NICs. In 1963, these were negligible in South Korea and Taiwan but reached $ 1035 per head and $ 2457 per head for the latter in 1987. The rate of expansion for Hong Kong and Singapore which started from a higher base was smaller.
Savings and Investment
All East Asian NICs increased their domestic savings in the 1973-81 period. These increases were smaller and declined in others in the same period. At the same time NICs maintained higher levels of investment efficiency which is measured (however imperfectly by incremental capita 1-output ratios (iCORs) [see Table 1.5].
Table 1.3 Commodity Composition of Exports (percent) Nonfuel
Fuels primary Manufactures Other Total
1963 Hong Kong 0.0 7 . 8 91.7 0.5 100.0 S.Korea 3.0 51.8 45.1 0.2 100.0 Singapore 16.7 52.3 27.8 3.3 100.0 Taiwan 0.9 61.0 38.0 0.0 100.0 1973 Hong Kong NA 3.3 96 . 5 0.2 100.0 S.Korea 1 . 1 14.7 84.0 0.2 100.0 S ingapore 19.8 33.8 44.3 2.1 100.0 Taiwan 0.3 16.0 83.6 0.1 100.0 1981 Hong Kong 0.1 3.0 96 . 5 0.4 100.0 S.Korea 0.7 8.7 90.0 0.5 100.0 Singapore 27.3 16.8 48.2 7 . 7 100.0 Taiwan 1 . 9 9 . 2 88 . 7 0.1 100.0 1987 Hong Kong 0.3 2.9 95.6 1.3 100.0 S.Korea 1.5 6 . 1 92.4 0.0 100.0 S ingapore 15.6 12.6 66 . 1 5 . 5 100.0 Taiwan 0.8 7 , 5 91.6 0.2 100.0
Table 1.4
Per capita exports of manufactured goods (US$, current)
1963 1973 1981 1985 1986 1987
Hong Kong 179.7 866.9 2664.7 2891.9 3414.6 4273.1
S.Korea 1 . 5 79.2 492.8 673.4 767.3 1035.3
Singapore 175.0 730.0 4139.0 4563.7 5136.2 7243.0
Taiwan 10.8 237.7 1110.8 1444.9 1848.5 2456.8
GDP growth rates, domestic savings ratios, and the IGOR Table 1.5 Country GDP growth rate Domesti c saving ratio IGOR 1963-73 Hong Kong 8.9 24.3 3.6 S . Ko r e a 9.3 13.0 2.1 Singapore 10.3 16.5 3.1 Taiwan 11 . 1 24.4 1 . 9 1973-81 Hong Kong 9 . 1 29.0 3.4 S.Korea 7 . 8 23.6 4.2 Singapore 7.8 32.8 5.0 Taiwan 8.0 32.8 3.7 1981-87 Hong Kong 7.2 28.3 4.0 S.Korea 8.9 29.8 3.5 Singapore 5.3 42.0 8.4 Taiwan 7 . 6 33.7 2 . 9
Social Indicators
Data on social indicators should be used
complementary to the information on economic growth rates to view the overall success of a country under a specific strategy.
a . Employment :
Data on employment are scarce. But Table 1.6 shows that manufacturing employment increased approximately fivefold in South Korea and Taiwan between 1963 and 1986, leading to a decline in the unemployment rate by
approximately one half (International Labor Office, Yearbook of Labor Statistics).
By 1986 the rate of unemployment was 6.5 % in Singapore, 2.8 % in Hong Kong, 3,8 % in South Korea and 2.7 7o in Taiwan .
b . Health :
Between 1965-87, life expectancy among NICs increased mostly in Hong Kong and South Korea, By 1987 the life expectancy was highest in Hong Kong (76 years), followed by Singapore and Taiwan (73 years). Infant mortality rates were most favorable in Taiwan (7/1000), followed by Hong Kong (8/1000) and Singapore (9/1000) having declined by two thirds during the preceding two decades. On the other hand, differences in the number of people per physician are considerable among the NICs [see Table 1.7 ] ( World Bank Development Report 1989 )
c . Education I
Table 1.6
Employment and Unemployment
Index of manufacturing employment (1975=100) 1963 1973 1981 1986 Hong Kong NA 85.8 133.4 135.5 S.Korea 28.6 80.5 130.2 181.0 Singapore NA 87.1 155.0 133.0 Taiwan 36.3 93.5 141.4 172.2 Unemployment rate (nonagricultural employment) 1963 1973 1981 1986 Hong Kong NA NA 4.6 2.8 S .Ko r e a 8.1 4.0 4.5 3.8 S ingapore NA 4.5 2.9 6 . 5 Taiwan 4.3 1.3 1.4 2.7
Source t International Labor Office, Yearbook of Labor Statistics, various issues
important determinants of the success of a population in manufacturing and industrialization. The literacy rate and secondary school enrollment thus is of importance for training of technical and highly skilled labor. By 1986, the secondary school enrollment rate in South Korea was 95 % , in Hong Kong 69 % , in Singapore 71 % and in Taiwan 88 % [for secondary school enrollment rates and literacy rates see Table 1.8].
International Trade Indicators :
Superior economic performance of the NICs is also apparent in their trends of exports and imports. Between 1963 and 1988, the share of the Pacific Area developing countries in the total exports of the LDCs rose from 11.8 % to 41.8 % (IMF, Direction of Trade Statistics). The share of imports of this group experienced a decline during the same period from 26.7 7o to 15.4 % .
Within the Pacific total, the NICs had a large expansion in their share of 8.1 % in world exports and 7.3 7o in world imports by 1988 compared with an export share of 1.6 % and import share of 2.2 % in 1963 when EP strategy was not implemented [see Table 1.9 and Table 1.10].
According to the data analysis, by 1988 the GNP growth rates of the NICs were as follows *. Hong Kong 7,4 % , Singapore 11.0 % , Taiwan 7.3 % , and South Korea 1 1 . 3 % .
Table 1.7 Health Indicators Life expectancy Infant mortality Population per physician 1965 1987 1965 1987 1965 1984 Hong Kong 66 76 28 8 2 460 1 070 S.Korea 57 69 63 25 2 700 1 170 Singapore 66 73 26 9 1 900 1 310 Taiwan 67 73 24 7 1 819 1 260
Sources : World Bank, World Development Report, 1989. Taiwanese data also from World Bank sources.
Table 1.8
Educational Indicators
EnrolIment EnrolIment Literacy in secondary in higher
rate s chools educa t ion
(percent) (percent) (percent)
I960 1980 1965 1985 1965 1986
Hong Kong 70.4 77.3 29 69 5 13
S.Korea 70.6 87 . 6 35 95 6 33
Singapore 49.8 82.9 45 71 10 12
Taiwan 72.9 89.7 44 88 7 21
Sources : School enrollment data from World Bank, World Development Report, 1989. Literacy rates from UNESCO, Statistical Yearbook, various issues.
Table 1.9
Country composition of world exports (percent)
1963 1973 1981 1988
Developed Countries 64.7 76.2 63.8 71.1
- United States 15.0 13.5 12.2 11.6
- Western Europe 39.7 48.3 38.4 44.2
- Japan 3.5 7.0 7.9 9.6
- Canada, Australia, New Zealand 6.5 7.3 5.2 5.7
Developing Countries 22.8 22.6 31.0 24.9 Pacific Countries 2.7 4.9 7.1 10.4 - Hong Kong 0.6 1.0 1.1 2.3 - S.Korea 0.1 0.6 1.1 2.2 - Singapore 0.7 0.7 1.1 1.4 - Taiwan 0.2 0.8 1.2 2.2 ~ Indonesia - Malaysia ~ Philippines - Thailand - China
Other Developing Countries - Other Asia - Africa - Europe - Middle East - Latin America 0.4 NA 0.5 0.3 0.9 19 3 4 0 3 7.0 0 .6 0.6 0.4 0.3 0.8 16 0 4 0 6 5 1 . 2 0.6 0.3 0.4 1 . 1 22.8 1.0 4.0 0.8 11.2 5.8 0 .7
0
.8
0.3 0 .6 1 . 712. 8
1. 2
2
1
3 4Sources : International Monetary Fund, Trade Statistics, various issues .
Table 1.10
Percentage of NIC imports in world imports
1963 1973 1981 1988
Hong Kong 0.8 1.0 1.2 2.2
S.Korea 0.3 0.8 1.3 1 . 8
Singapore 0.8 1.0 1.4 1 . 5
Taiwan 0.2 0.7 1 . 1 1 . 7
East Asian NICs 2.2 3.5 5.0 7.3
Source I International Monetary Fund, Trade Statistics, various
domestic savings and investment, and social indicators it is apparent that during the period between 1963 and 1988, the NICs have achieved a high economic performance under the EP strategy. How did they manage to reach such high levels of economic performance, not only in income terms, but also in terms of social indicators ? In order to answer this question, the historical, social and political features unique to each of these four NICs should be examined with special emphasis on the policies applied and the way of implementation of the EP strategy.
HONG KONG
Hong Kong has a population of 5.6 million and an area of 1052 km square . Before the Second World War it depended entirely on the entrepot trade. After the Japanese occupation and a further severe shock in mid- 1951 when China entered the Korean War and the UN imposed an embargo on trade with China, the uncertainties in the political and economic environment led Hong Kong to undertake new activities in the manufacturing sector (Balassa 1991, 30).
Together with the entrepreneurial and technical skills and the labor force brought with the new arrivals from China, Hong Kong's manufacturing sector began to flourish. The existence of trade ties and the availability of an efficient network of transportation, communication, and banking facilities benefitted Hong Kong's manufacturing sector and it became an
1970s .
Under a laissez-faire economy with free trade and free capital movements, the manufacturing activities further developed. But governmental policies also played an important role in providing political stability and economic conditions that have permitted market forces to stimulate late growth of manufacturing production and trade .
Government Policies :
Although Hong Kong's economy traditionally operates under a laissez-faire system, this orientation was a result of a deliberate choice. The government's actions supported the growth of manufacturing industries in the 1960s, the Hong Kong Trade Development Council in 1966, the Hong Kong Productivity Council in 1967, and the Hong Kong Credit Insurance Corporation in 1968 (Turner 1982, 18). The growth in manufactured exports was thus a deliberate national development strategy adopted by both the government and the private sector.
The Hong Kong government owns no manufacturing establishments, it does not subsidize exports, it applies no tariffs or import restrictions, and it does not attempt to influence the manufacturing sector's activities. Firms are established freely with few regulations on their operations. In addition, there exists no minimum wage legislation and while the trade unions are free to.operate, their influence has been
limited : only 7 % of industrial workers are unionized. Taxes are low, income taxes range from 5 to 25 percent, corporate income taxes are at a total of 16.5 percent. While there exist reduced depreciation allowances for new investment, the government provides physical and social infrastructure for businesses. It has been involved in land reclamation, enlarged ports, built roads and highways. The government has also provided low-rent housing to about two fifths of the population. and subsidized education until 15 years of age (Balassa 1991, 32) .
In Hong Kong, international financial transactions are completely free, contributing to the emergence of Hong Kong as a financial center. Restrictions are not imposed on foreign direct investment abroad by Hong Kong. There exists no Central Bank in Hong Kong.
The foundation of the operation of Hong Kong economy is composed of property rights and the contractual rights which are efficiently provided by the legal system of Hong Kong. The Former Attorney General of Hong Kong has noted :
" It is the predictability and continuity of the economic and financial environment taken together with the commercial and social stability given by strict adherence to the Rule of Law which have been essential elements in creating the climate of
government thus played upon an important role in four main areas : 1) controlling the monetary policy (largely ineffectual in practice) ; 2) regulating the financial sector (on minimal basis) ; 3) providing basic social services ; 4) establishing industrial and economic advisory boards (Baiassa 1991, 32).
Thus, Hong Kong's governmental policies aided greatly in creating a suitable environment for its economic growth and for the success of its EP strategy. Economic Growth :
Between 1963 and 1987 Hong Kong’s per capita income growth averaged 6.3 % . In 1988 it reached $ 8000 [see Tables 1.1 and 2.1]. Growth originated in the manufacturing sector and increasingly in services both of which were oriented towards exports, with exports of goods and services rising over 11 ^ a year between 1963 and 1987 ( World Bank ) .
Economic growth was also supported by a high rate of investment [see Table 2.2] which rose to 36 % in the 1980s financed largely by domestic savings. Foreign savings assumed importance in the late 1970s and early 1980s when investment activity was at its peak. In the mean time, the rapid rise in exports helped correct the trade deficit of Hong Kong especially after the establishment of a fixed exchange rate in 1985 which gave Hong Kong a competitive edge.
Table 2.1
Economic performance indicators of Hong Kong
Growth rates 1963-73 1973-81 1981-7 1963-87 GDP 8.9 9 . 1 7.2 8.5 Population 2.1 2.6 1.3 2.1 GDP per capita 6.7 6.3 5 . 8 6.3 Inves tment 4.1 12.0 2.1 6 . 1 Manufac. production “ “ Agricul. production * Exports 11 . 1 10.5 13.4 11.5 Impo r t s 9.8 11.8 11.7 11.0
Source : World Bank, World Development Report, 1987,
Table 2.2
Savings and investment ratios of Hong Kong (percent of GDP)
1973 1975 1977 1979 Private savings Domestic savings Foreign savings Domestic investment Private savings Domestic savings Foreign savings Domestic investment
2 6 . 4
2 5 . 3
3 0 . 3
3 1 . 1
- 2
,5
-1 . 0
-2 . 3
2
.9
2 4 . 0
2 4 . 2
2 7 . 9
3 4 . 0
1 9 8 1
1 9 8 3
1 9 8 5
1 9 8 7
3 0 . 4
2 5 . 1
2 7 . 3
3 0 . 7
5
.6
2 . 0
- 5
.7
-5 . 4
3 6 . 0
27
.1
2 1 . 7
2 5 . 3
a small domestic market Hong Kong has thus made a deliberate choice of implementing the EP strategy and aiding the manufacturing sector for the production of export goods necessary to earn foreign exchange to import their needs.
SINGAPORE
Within an area of 618 km square , Singapore has a population of 2.6 million. After becoming independent in 1959, Singapore joined the Federation of Malaysia in 1963 for two years (Balassa 1991, 73). Before independence, the economy was dominated by entrepot trade. The financial skills, communications and distributional skills associated with entrepot functions made Singapore alert to the developments in the world economy.
After an initial period of Import Substitution (IS) with high protection, due to the small domestic market's inability to lead to high standards of" living under protection, exports were given priority. In contrast to other NICs foreign direct investment played an important role in Singapore's industrial development. Foreign direct investment was encouraged by incentives while domestic capital concentrated on trading and finance.
Government Policies :
After the Second World War, due to a decline in the entrepot trade (importing minerals, lumber, and rubber
from Malaysia and Indonesia for re-export after processing), and the consequent rise in unemployment , industrialization became Singapore's primary objective.
According to People’s Action Party's (PAP) Manifesto in 1959, Singapore had advantages that could be useful in industrialization, such as : hardworking, resourceful, enterprising people ; favorable geographical position and sea communications ; large amount of capital accumulated by local enterprise and public authotities ; and markets available in the region (People's Action Party, 1958).
After separation from the Malaysian Federation,
the government implemented a policy of IS, but in 1965 when Malaysia reimposed tariffs and quotas on Singapore's manufactured goods, Singapore adopted a conscious policy of Export Promotion. Specific measures were taken to liberalize restrictions and duties on imported inputs for export production and to attract foreign investment and technology.
Export subsidies were introduced and tax measures were adopted to favor profits and expenses associated with manufacturing exports. Company tax rates on profits earned from exports, tax on royalties, licences, technical assistance fees were reduced. Tax allowances were provided for the development of markets abroad ( Tuna 1989 , 32) .
To complement the manufacturing sector and to aid in industrialization efforts, the Singapore government established a Technical Education Department in 1968
placing emphasis on technical education and providing overseas training. In 1975, the Export Credit Insurance Corporation was established with 50 % government participation to insure exports against defaults on commercial and political grounds (Chen 1983, 35).
In 1978, the government launched a program termed "Second Industrial Revolution" to increase the relative importance of high technology industries through incentives for investment in Research & Development with a policy of raising wages, educational, training facilities (Rodan 1985, 40).
Economic Growth :
With the contribution of the policies applied, under the EP strategy, Singapore experienced rapid economic growth. Between 1963 and 1988 per capita income rose by a factor of 6.65 reaching $ 7623 a year [see Table 1.1]. Later on, however there was a slowdown in economic growth over time [see Table 3.1].
Economic growth was concentrated in the manufacturing and financial sectors. ,.The share of manufacturing in GDP rose from 12.6 % in 1963 to 28.6 % in 1987. Exports rose parallel to the increase in the share of manufacturing in GDP.
Investment I
In Singapore investment was supported by the government, public institutions, and directly by foreign sources [see Table 3.2].
Table 3.1
Economic performance indicators of Singapore (percent)
Growth rates 1963-73 1973-81 1981-7 1963-87 GDP 10.3 7.8 5.3 8.2 Populat ion 2.0 1.4 1 . 1 1.6 GDP per capita 8.1 6.4 4.1 6 .5 Inves tment 15.6 8.7 3.4 10.1 Manufac.product ion 15.8 8.3 3.8 10.2 Agr icul.production 4.3 0.8 -5 . 1 0.7 Exports Imports
Source : World Bank, World Development Report, 1988 .
Table I 3.2
Savings and investment ratios of Singapore (percent of GDP)
1973 1975 1977 1979 Private savings 28.8 28.4 31.8 33.7 Domestic savings 28 . 7 29.3 32.9 36.0 Foreign savings 10.0 10.5 2.6 7.0 Domestic investment 38.7 39.8 35.4 42.9 1981 1983 1985 1987 Private savings 40.4 43.8 38.2 Domestic savings 41.1 45.6 40.3 40.1 Foreign savings 5.6 1.8 2.4 -0.4 Domestic investment 46.7 47.4 42.8 39.7
The Development Bank of Singapore was established with 49 % government participation in order to finance development . In addition, by 1984, the public sector accounted for 33.4 Z of gross capital formation and generated 69 % of gross national savings (cited in Krause 1987, 110).
Beside governmental efforts to raise investment, foreign direct investment also had a major role in making funds available for industrialization. The promotion of direct foreign investment was initially undertaken to increase employment which was 46,000 in 1958 (Balassa 1991, 58). The major policy instrument designed to attract foreign direct investment was tax incentives. The provision of industrial finance and the establishment of industrial estates further attracted foreign investment. Most importantly, there exist in Singapore free repatriation of profits, dividends and capital and no disincentives for foreign direct investment which is concentrated in the manufacturing sector.
Thus, with the support of governmental policies and domestic and foreign investment Singapore made a successful transition into industrialization, increased its volume of manufactured exports, and with the outward- oriented Export Promotion strategy Singapore achieved high growth rates.
TAIWAN
With an area of 36.000 km square and a population of 19.5 million, Taiwan has few mineral resources and insufficient arable land compared with its population. After the Second World War when Chiang Kai-Shek withdrew to Taiwan, Taiwan benefited from American aid which supported its IS program.
In the early 1960s Taiwan adopted an outward- oriented EP strategy for development as the IS strategy ran into difficulties due to the limitations of small domestic market. The EP strategy in Taiwan involved providing export incentives and liberalizing imports in order to remove discrimination against exports from the economic system.
Between 1965 and 1975 Taiwan experienced a real GDP growth of 10.6 Z ; no deterioration of income distribution; and improvement in literacy and life expectancy higher than most other developing countries. There were increases in real manufacturing earnings of 15 % a year from 1960 to 1979 ; and unemployment at less than 2 % since 1970 (Wade 1988 , 30).
According to Balassa, in Taiwan growth has been accompanied with EQUITY. Taiwan had one of the most equitable distribution of income among LDCs following the land reform of the late 1940s and 1950s which further improved after the adoption of an outward-oriented development strategy (Balassa 1991, 96).
without balance of payments problems, rapid inflation and without high levels of foreign borrowing. According to Wade, this is not a case of easy natural resource exploitation but of labor-intensive manufacturing. In 1973 the share of manufacturing in GDP was 36 %, which is high even by the standards of industrialized countries. With a small domestic market, a large part of the manufactured production has been exported (Wade 1988,30).
Government Policies :
Many leaders doubted that Taiwan’s light industries could become internationally competitive while adopting the EP strategy. Moreover, the EP strategy challenged the interests of the military who wanted to develop heavy industries, and of bureaucrats who were forced to yield much of their direct power over the economy (Clark 1989, 174) .
The Republic of China (R.O.C.), thus, adopted several policies in the late 1950s and early 1960s aiming at promoting exports, domestic investment and industrialization. This new policy package provided a variety of incentives for exporting, such as : a) more realistic exchange rates ( the dual exchange rate was abolished, the currency was depreciated ), b) cheap credit and rebates on imported components and raw materials, c) tax reform and decreased regulation
industrial components, and e) reduction in tariffs and other import restrictions (Clark 1989, 175).
In addition to the above mantioned incentives, a large package of selective fiscal incentives for both domestic and foreign investors was established. On the other hand, the industrial parks established by the government provided infrastructural facilities and enabled investors to rent rather than to buy land and buildings (Wade 1988, 34).
Thus, between 1966 and 1976 , the number of manufacturing firms increased by 150 % in Taiwan and the industrial production rose by 18 % a year over the 1963- 73 period (Clark 1989 175).
Apart from the industrial policies, the government's educational efforts also contributed to the industrial development of Taiwan by enhancing the skill level of the labor force. In 1940 Taiwan's literacy rate was Z 21. After the Second World War, illiteracy was eradicated and secondary school enrollment rate became 88 Z (Balassa 1991, 104).
Reforms on the financial sector in the 1960s also contributed to economic growth and development. The reform involved setting high interest rates with a view to evening out the demand for and the supply of funds. This policy had a favorable influence on savings as well as on the allocation of savings among alternative investment.
Economic Growth :
In 1963, Taiwan’s per capita income was lower than Brazil’s and it was less than one third of that of Chile and Argentina. By 1988, however, Taiwan surpassed all these countries by a considerable margin [see Table 1.1]. Per capita income growth averaged 6.8 % in the 1963-87 period and 6.1 % a year between 1981 and 1987 [see Table 4.1] .
The stimulus for the economic growth was provided by exports which increased 17.4 % a year between 1963 and 1987. As a result the share of export goods and services reached 60.7 Z of the GDP in 1987 compared with 17.8 Z in 1963 (World Bank). The economic growth was concentrated in the manufacturing sector.
Investment :
In the early part of the period between 1963 and 1973, domestic investment increased very rapidly by 17,4 Z a year. However, after 1981, investment increased very little and the share of investment in GDP tell to 20 Z in 1987 [see Table 4.2]. Savings that originate in the private sector financed the investment.
Foreign Aid :
Some scholars attribute Taiwan’s success to foreign aid (Jacoby 1966, 45). However, during the 1950s foreign aid in Taiwan accounted for 5-7 Z of GNP and financed a substantial proportion of imports (Balassa 1991, 104). During 1960s the effects of foreign aid declined. Overall direct foreign investment never contributed more
Table 4.1
Economic performance indicators of Taiwan (percent)
Growth rates 1963-73 1973-81 1981- 7 1963-87 GDP 11.1 8.0 7.6 9.2 Population 2.8 2.0 1.4 2.2 GDP per caita 8.1 5.9 6 .1 6.8 Investment 17.4 9.6 1 . 7 10.7 Manufac.production 18 . 6 9.3 9 . 1 13.1 Agricul.production 3.8 1.4 1.3 2.4 Exports 25 . 5 10.4 13.9 17.4 Imports 21.4 9.4 10.1 14.4
Source : World Bank, World Development Report , 1987,1988.
Table 4.2
Savings and investment ratios of Taiwan (percent of GDP)
1973 1975 1977 1979 Private savings . 28.4 25.9 32.7 Domestic savings 34.6 27.3 33.3 34.5 Foreign savings -5.3 3.3 -4.9 -1 . 1 Domestic investment 29.3 30.6 28.4 33.3 1981 1983 1985 1987 Private savings 32.6 33.1 32.3 38.5 Domestic savings 32.4 32.0 32.3 38.8 Foreign savings -2.1 -9.0 -14.5 -19.2 Domestic investment 30.3 23.0 17.9 19.6
the uncertain political and economic status of the island, foreign investment did not begin to flow into Taiwan until early 1960s. By that time domestic industrialization was well underway and the denationalization and foreign domination had became difficult to achieve. In addition , the regime with its memories of foreign enclaves was quite sensitive to the need of controlling the MNCs (Clark 1989, 185 ). Nevertheless, MNCs made a major contribution to the upgrading of some industries such as microelectronics and in the marketing of Taiwan's exports.
Use of The Comparative Advantage :
The fact that the labor-intensive industries displayed the fastest growth implies that Taiwan had been able to find a place in the global economy based on its comparative advantage based on low-cost labor. However, despite this general emphasis on low-cost production, in the 1960s small and medium industries became more capital intensive as entrepreneurs upgraded their production techniques.
In addition, during the EP boom of 1963-73, the state exercised its considerable power actively to promote its chosen pattern of expansion which included development of heavy and chemical industries as well as the export sector (Wade 1988, 45 ). Here, the aim was to change Taiwan's comparative advantage in the anticipation of changing market conditions , and thus to permit a
steadily more differentiated range of export products.
SOUTH KOREA
South Korea with a population of 42 million and an area of 98.000 km square, has a mountainous terrain unsuitable for agriculture (Balassa 1991, 46). In the late 1950s and early 1960s South Korean industrialization first emphasized Import Substitution. But policymakers changed the strategy as they realized the limits imposed by the small market size and the lack of natural resources (Tuna 1989, 32).
Following the election of Chung Нее Park in 1964, major policy changes were undertaken as a part of an export-oriented growth strategy. Reforms included unrestricted access to intermediate and capital goods imports, a uniform exchange rate, tax exemptions for exporters, reduced prices on inputs and access to credit for investment.
As a result exports rose to 45 % of the GDP in 1987 from that of 3 % of GDP in 1960. Investment also increased from 11 % of GDP in 1960 to 30 % .of GDP in 1987 [see Tables 1.1, 5.1 and 5.2].
Government Policies :
Reforms of 1964 thus involved devaluation, unification of exchange rates, import liberalization, and increased incentives for exports. In 1965, these incentives were extended to indirect exports and exporters were also given increased credit preferences.
Table 5.1
Economic performance indicators of South Korea (percent)
Growth rates 1973-63 1973-81 1981-7 1963-87 GDP 9.3 7.8 8.9 8.7 Population 2.4 1.6 1.4 1.9 GDP per capita 6.8 6.1 7.4 6.7 Inves tment 14.4 11.2 10.2 12.3 Manufac.product ion 19.8 13.0 11.5 15.4 Agricul.production 4.1 2.3 2.4 3.1 Exports 33.6 14.3 13.8 21.8 Impo r t s 18.8 12.2 9 . 9 14.3
Source : World Bank, World Development Report, 1987 .
Table 5.2
Savings and investment ratios of South Korea (Percent of GDP)
1973 1975 1977 1979 1980
Private savings 22.2 20.4 29.0 29.8 25 . 5
Domestic savings 21.7 18.5 27.2 28.1 23.3
Foreign savings 2.7 8.5 -0.2 7 . 2 7 . 8
Domestic investment 24.6 27.0 27.0 35.3 31.1
Apart from the price incentives, the government sponsored Korea Trade Promotion Association (KOTRA) was founded in 1964 to promote Korean exports and to carry out market research abroad (Balassa 1991, 48).
Adoption of the EP strategy was accompanied by the reform of financial system. Interest rates were raised to increase financial savings. In the subsequent years as policy changes occurred in favor of capital intensive industries producing intermediate goods and heavy machinery, these industries were given priority in the allocation of domestic credit.
Until 1966 Korean policy discouraged foreign investment and borrowing. But as a result of decreased aid flows, the government reversed its stance and began to encourage private inflows, which were still carefully controlled.
In all these efforts the export drive was central. President Park chaired joint meetings of government officials and businessmen each month, in which export performance was reviewed industry by industry (Krueger 1987, 190). In addition, the systematic nature of the Korean government's reforms and its commitment to the EP strategy provided the necessary assurance to exporters to take risks associated with exporting (Turner 1982, 19).
During the oil crisis of 1973-74 Korea modified its strategy and policies. The real exchange rate was adjusted promptly together with adjustments in the
groups (Krueger 1987, 192).
Assassination of President Park led to further policy changes in 1980. The consequent Fifth Five Year Plan and Sixth Five Year Plan ( 1987-91) contributed to the process of import liberalization together with financial liberalization measures such as denationalization of commercial banks and abolition of credit ceilings.
Education :
An important factor in Korea’s ability to exploit the advantages of the EP strategy has been education. The promotion of technology was given priority. Several institutions has been established to train scientists, engineers and to conduct research. With the introduction of compulsory education after the war, there occurred considerable expansion in secondary and higher education. While in 1965 35 % of population was enrolled in the secondary school, by 1985 this figure reached to 95 % (Balassa 1991, 55).
Government-Business Relationship :
The government-business relationship in South Korea also contributed greatly to economic growth and development. The government together with large private enterprises constituted an internal organization, named QUASI-INTERNAL ORGANIZATION (Lee 1992, 187). This organization not only helped in effectively allocating resources and credit but also made it possible for the government to implement its developmental policies
effectively. For example, enterprises would be favored with preferential loans as long as they achieved the export targets assigned by the government.
Another distinguishing characteristic of the Korean industry has been the importance of conglomerates, the CHAEBOL. The largest fifty-five firms account for more than one-third of industrial output (Balassa 1991, 49). Industrial concentration was helpful in providing the economies of scale in production and in foreign sales as well as name recognition abroad. In addition, the comparatively small number of conglomerates made it easier for the government to impose its will on firms. Economic Growth :
The governmental policies applied under the EP strategy led to rapid economic growth in Korea, Between 1963 and 1988, per capita incomes increased fivefold reaching $ 2849 per head [see Table 1.1]. As a result Korea now ranks among the higher middle-income countries.
Between 1963 and 1973 GDP increased at a rate of 9.3 % , 8.2 % between 1973-81 and 8.9 % between 1981-87 [see Table 5.1] Economic growth was concentrated in the manufacturing sector and was promoted by the rapid expansion of exports and investment supported by domestic savings [see Tables 5.2 ]
TOWARD AN EXPLANATION :
After adopting the EP strategy and implementing outward-looking development policies accordingly, the East Asian NICs (Hong Kong, Singapore, Taiwan and South Korea) have reached high economic growth levels and have continued to be the most dynamic exporters of manufactures. These four countries and the way they implemented the EP strategy provide a good example for understanding how a trade policy can lead a country towards economic growth. Here, the questions to be asked are : Why were the NICs able to export manufactured goods in large volumes and to achieve remarkably high growth rates while other countries who also adopted the same trade strategy could not ? Will other LDCs who adopt the same trade strategy also become important exporters of manufactures in the world trade as they begin to industrialize ?
One explanatory view is that the industrialization process is a historical spread in which the NICs are a part of the changing world economic structure parallel to the shifts in the international division of labor. Therefore, the number of NICs are expected to increase as industrialized countries vacate intermediate sectors in industrial production and advanced developing countries move into these sectors. In turn, advanced developing countries would vacate more basic industrial sectors in which the next tier of developing countries have a relative advantage (Tuna 1989, 30).