U. Ü. ZİRAAT FAKÜLTESİ DERGİSİ, 2015, Cilt 29, Sayı 1, 11-18 (Journal of Agricultural Faculty of Uludag University)
The Effects of Feeding Frequency on Growth Performance
and Proximate Composition of Young Nile Tilapia
(Oreochromis niloticus L.)
Gülderen KURT KAYA
1Murat BİLGÜVEN
*21Tunceli University, Aquaculture and Fisheries Faculty, Department of Fisheries, Tunceli, TURKEY *2
Mersin University, Aquaculture and Fisheries Faculty, Department of Aquaculture. Mersin, TURKEY
*e-posta: [email protected]
Geliş Tarihi: 22.12.2014; Kabul Tarihi: 16.03.2015
Abstract: In this study, the effects of four different feeding frequency (once (I), twice (II), three (III),
or six (VI) meals a day) on the growth performance, feed consumption, feed conversion ratio and proximate composition of Nile Tilapia (Oreochromis niloticus) were investigated. The average live weight of 420 Nile tilapia used in this experiment were 9.39 ± 0.19 g. Four trial groups were tested in triplicate for 10 weeks and 35 fish were stocked in each tank. The fish were fed with the feed (35% CP; 11.7 MJ DE/kg) taken from a commercial feed company. At the end of the study, it was observed that there were important differences among the groups in terms of average live weight, live weight gain, feed consumption, feed conversion ratio (FCR), protein efficiency ratio (PER) and specific growth ratio (SGR) were found statistically significant (P<0.05). Moreover, the difference in the composition of carcass among the groups is found statistically significant (P< 0.05).Consequently, it is understood that feeding frequency has an important effect on growth rate: there is a linear correlation in young fish, and there is a non- linear correlation in adult fish.
Key Words: Nile tilapia, feeding frequency, growth performance, feed consumption, proximate
composition.
Yavru Nil Tilapyalarında (Orerochromis niloticus L.) Büyüme
Performansı ve Vücut Bileşimi Üzerinde Yemleme Sıklığının Etkisi
Özet: Bu çalışmada Nil Tilapyalarının büyüme performansı, ortalama yem tüketimi, yemdenyararlanma oranı ile toplam vücut ve karkas kompozisyonu üzerinde yemleme sıklılığının (günde 1, 2, 3 ve 6 öğün) etkisi araştırılmıştır. Denemede, ortalama ağırlığı 9.39±0.19 g olan 420 adet Nil Tilapyası kullanılmıştır. Bu amaçla her biri 3 paralelden oluşan 4 grup oluşturulmuş ve çalışma 10 hafta sürmüş olup, her bir tanka 35 adet balık stoklanmıştır. Çalışmada % 35 ham protein (HP) ve 11.7 MJ/kg sindirilebilir enerji (SE) içeren ticari bir yem kullanılmıştır. Deneme sonunda, ortalama canlı ağırlık, canlı ağırlık artışı, yem tüketimi, yemden yararlanma oranı, proteinden yararlanma oranı
ve özel büyüme oranı bakımından gruplar arasında önemli fark bulunmuştur (P<0.05). Bununla beraber, gruplar arasında karkas bileşimi bakımından gözlenen farkın da önemli olduğu gözlenmiştir (P<0.05).
Sonuç olarak, büyüme oranı üzerinde yemleme sıklığının yavru balıklarda önemli bir etkisinin olduğu ancak büyümeyle birlikte bu etkinin azaldığı söylenebilir.
Anahtar Kelimeler: Nil tilapyası, yemleme sıklığı, büyüme performansı, yem tüketimi, vücut
bileşimi.
Introduction
Tilapias have become well-known among fish farmers because of the advantages of rapid growth, rusticity and easy industrialization due to their lack of lateral musculature spines. These qualities make tilapias the most adequate species for extensive and highly intensive cultivation, as the growing market has shown all over the world. Correct diet handling is absolutely necessary for fish growing performance without any sanitary risk. Besides metabolic-digestive alterations, excessive diet causes water quality deterioration and deficient diet results at a low growth rate and with great variations among individuals. Thus, the diet amount of feeding each time or feeding frequency may influence diet utilization (Sanches and Hayashi, 2001). Uneaten feed that dissolves in water causes poor water quality and increases the feed conversion ratio (FCR). Since the main aim is that juvenile uptake a high daily diet ratio to meet their nutrition requirement and thus ingest adequate hormonal amounts, and since high feeding frequency results in high daily diet intake ratio and small amounts of diet per feeding (Meer and ark., 1997), a higher frequency may be the most adequate.
Riche and ark. (2004) evaluated the consumption, growth, and feed utilization of juvenile Nile Tilapias fed with a commercial diet once, twice, three, or five times a day. No significant differences in growth, feed efficiency, or protein utilization among the fish fed 2, 3, or 5 times daily, but all were significantly better than fish fed once only.
Siraj and ark. (1988) compared five separate groups which were fed with 10 % ratio of their body weights and with the periods of 3 meals (R1), 2 meals (R2), 1 meal (R3) a day, 1
meal (R4) in 2 days and 5 meals (R5) a day ad libitum respectively. They determined that
the best feeding was achieved with 2 meals (R2) a day feeding.
Tung and Shiau (1990) stated that FCR, protein and energy accumulation, like in the live weight gain, resulted better in the groups which are fed 6 meals (vs. 2 meals) a day.
Yousif (2004) has carried out to study the effects of feeding frequency on growth performance and feed utilization efficiency of Nile tilapia juveniles. Significantly higher (P<0.05) live weight gain, FCR, protein efficiency ratio (PER) were achieved by receiving either 3 or 4 meals a day.
The objective of this study was to investigate the effects of feeding frequency on live weight gain, FCR, feed consumption, PER and body composition of juvenile Nile Tilapia.
Material and Method
Fish and diet
This study was performed in application unit of Aquaculture and Fishery Faculty, Mersin University with a total of 420 Nile tilapia (Oreochromis niloticus L.). Fish were obtained from Çukurova University. They were counted, weighted and stocked randomly chosen into tanks at a rate of 35 fish per tank with 3 repetitions for each feeding frequency. Triplicate groups of juvenile (9.39 ± 0.19 g) were fed with a commercial diet (no 3 granule, 35%CP, 11.7 MJ DE/kg) once (I), twice (II), three (III), or six (VI) meals a day for 70 days. Table 1 shows nutritional composition of the feed.
Table 1. Feed nutrition composition a, b, c.
Item Diet (% as fed basis)
Dry matter 91.0
Crude protein 35.0
Crude oil 7.0
Crude fibre 3.0
Ash 1.0
Digestible Energy, MJ DE/kg 11.7
a
Vitamin premix (mg/kg dry feed): Vitamin A 3.6 mg, Vitamin D3 0.45 mg, Vitamin E 0.015 mg,
Vitamin K 10 mg, Vitamin C 70 mg, Thiamine 10 mg, Vitamin B2 20 mg, Pantothenic acid 10 mg,
Pyridoxine 5 mg, Vitamin B12 20 mg, Niacine 100 mg, Biotine 0.25 mg, Folic acid 2 mg, Inositol
100 mg, Choline 1000 mg.
b Mineral premix (g//kgof dry feed): Calcium 25 g, Sodium 10 g, Phosphorus 6 g, Zinc 70 mg,
Manganese 25 mg, Magnesium 25 mg, Ferrum 2 mg, Iodin 0.7 mg, Copper 1 mg, Cobalt 0.2 mg, Selenium 0.03 mg.
c
Essential amino acids (g/.kgdry feed): L-Lysine 20 mg, DL-Methionine 10 mg, +Cystine 6 mg.
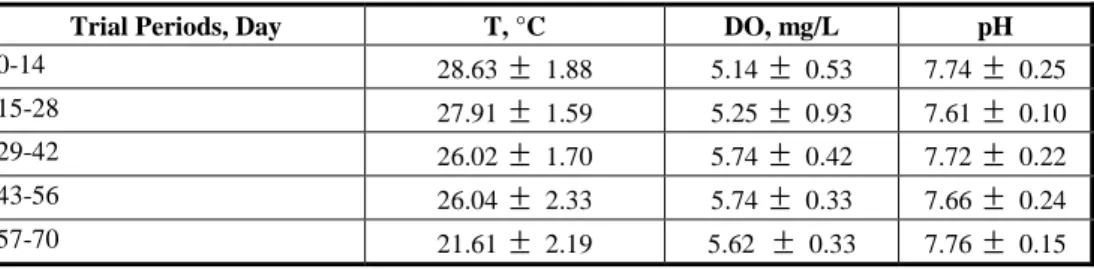
The research was conducted in plastic tanks sized 200×50×60 cm. Water was distributed with PVC pipes for each tank. The water flow rate was fixed at 0.088 L/.min.for all treatments, thus 25% of total water volume was changed with fresh water daily. Values of pH (Hanna HI 8314), dissolved oxygen and water temperature (Schott Gerate CG 867) measured periodically, are presented in Table 2.
Table 2. Mean values of pH, dissolved oxygen (DO) and water temperature (T) which is
measured several times during trial periods.
Trial Periods, Day T, °C DO, mg/L pH
0-14 28.63
±
1.88 5.14±
0.53 7.74±
0.25 15-28 27.91±
1.59 5.25±
0.93 7.61±
0.10 29-42 26.02±
1.70 5.74±
0.42 7.72±
0.22 43-56 26.04±
2.33 5.74±
0.33 7.66±
0.24 57-70 21.61±
2.19 5.62±
0.33 7.76±
0.15Feeding trial
Fish in all treatments were fed at a rate of 6% body weight per day during the first 2 weeks. This feeding level was reduced to 4% body weight per day during the rest of the study because of uneaten feeds. The same amount of feed was distributed among the group as 1, 2, 3 and 6 meals per day in the trial. All of fish starved for 24 h before sampling them from each tank for weight measurement and daily feed was adjusted according to the mean live weight. It is supposed that all given feed was consumed by the fish. The amount of consumed feed was calculated by given total feeds.
At the end of experiment, fish weight gain, FCR, PER and SGR* were estimated. Live weight gain was determined by the fish final weight - initial weight; the feed conversion ratio was calculated as feed consumed/weight gain. No mortality was observed during the trial.
At the end of the experiment seven fish from each treatment were sacrificed and pooled for total body and carcass composition analyses. The chemical compositions of total body, carcass and feed were measured following by AOAC methods (Anonymous, 1995).
Statistical Analyses
Random block experimental design was used to evaluate the differences between treatments. The mean final body weights in each treatment were subjected to statistical comparisons using ANOVA. All statistical analyses were carried out using the SPSS program (SPSS v7.5 Inc. 1997). Results and Mean differences between treatments were tested for significance (P<0.05) by the help of Tukey’s multiple range test. Results presented in Tables 3 and 4 are reported as means ± SD (n=3 and n=5 respectively).
Results
Performance of fish in feeding trial
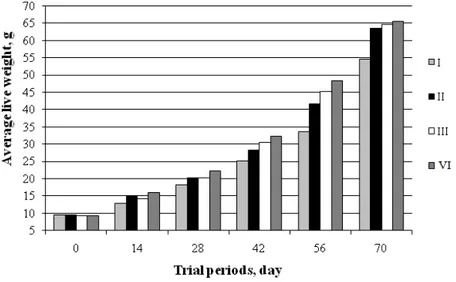
Live weight, live weight gain, feed consumption, FCR, PER, SGR and survival rate data from different feeding frequencies over the experimental period are shown in Table 3. The differences among VI, III, II and I groups in terms of final live weights were found statistically significant (P<0.05) at the end of the trial (Figure 1).
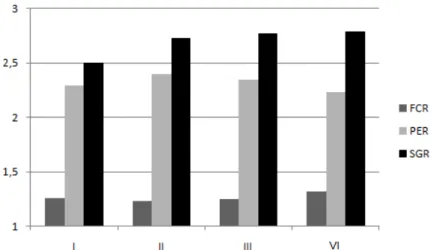
The best live weight gain and SGR were obtained in VI and significant differences for these features between I and II, III, VI were observed. The most feed was consumed by VI and the differences among I and II, III, VI; II, III and VI were found statistically significant (P<0.05). In the present study the best FCR was obtained by II during the trial. There were significant differences among I and II, VI; II, III and VI in terms of FCR (P<0.05). The best
*
×100 (Wilson 1989)
PER value was obtained in II and the differences among all groups were found statistically significant (p<0.05).
Table 3. Growth performances and feed efficiency of Nile tilapia with different feeding
frequencies.* Item Test Groups I X S X± II X S X± III X S X± VI X S X± Trial period, day 70 70 70 70 Total fish number 105 105 105 105 Initial weight, g 9.52 ± 0.19 9.40 ± 0.19 9.30 ± 0.19 9.26 ± 0.19 Final weight, g 54.89 ± 0.84 a 63.62 ± 0.84 b 64.67 ± 0.84 b 65.48 ± 0.84b Average live weight gain, g 45.37 ± 0.81 a 54.21 ± 0.81 b 55.36 ± 0.81 b 56.22 ± 0.81 b Average feed consumption, g 58.38 1.39a 66.49 1.39b 69.42 ± 1.39b 74.19 1.39c Feed conversion rate (FCR) 1.26 ± 0.01a 1.23 ± 0.01 b 1.25 ± 0.01 ab 1.32 ± 0.01 c Protein efficiency rate (PER) 2.29 ± 0.02a 2.40 ± 0.02b 2.35 ± 0.02c 2.23 ± 0.02d Specific growth rate (SGR) 2.50 ± 0.03a 2.73 ± 0.03b 2.77 ± 0.03b 2.79 ± 0.03b Survival rate, % 100 100 100 100
All data are expressed as mean values ± S.D. (n = 3).
*Within the same rows, values with different superscripts are significantly different (P < 0.05).
Total Body and Carcass Composition
The effect of different feeding frequencies on growth performances and carcass compositions of juvenile Nile Tilapias at the end of trial are given in table 4.
VI has the highest total body and carcass moisture content, and the differences among I and II, III, VI; II, III and VI were remarkably important (P<0.05). As the feeding frequency increases, an average protein values decreases as opposed to average lipid values in total body and carcass samples (Table 4, P<0.05). However, it was also evident that as the feeding frequency increased, average protein values increased whilst the average lipid values decreased in carcass samples (Table 4, P<0.05).
Table 4. Proximate composition of total body and carcass at the end of experiment*
Item
Test Groups (%)
I II III VI
Final Total Body
Moisture 69.7 ± 3.17a 70.8 ± 3.17b 70.5± 3.17b 71.2 ± 3.17c Crude protein 17.3 ± 2.41a 16.2 ± 2.41b 15.8 ± 2.41c 15.7 ± 2.41c Fat 6.5 ± 7.00a 7.7 ± 7.00ab 8.6 ± 7.00bc 9.5 ± 7.00c Ash 4.2 ± 4.21a 4.3 ± 4.21a 3.5 ± 4.21a 2.5 ± 4.21b Final Carcass Moisture 75.5 ± 3.03a 74.5 ± 3.03b 74.7 ± 3.03b 76.2 ± 3.03c Crude protein 17.0 ± 2.27a 17.7 ± 2.27b 18.4 ± 2.27c 18.5 ± 2.27c Fat 4.7 ± 3.67a 3.4 ± 3.67b 3.2 ± 3.67b 2.8 ± 3.67b Ash 2.6 ± 3.24 2.9 ± 3.24 2.9 ± 3.24 2.7 ± 3.24
All data are expressed as mean values ± S.D. (n = 5).
*Within the same rows, values with different superscripts are significantly different (P < 0.05).
Figure 2. The relationship between FCR and diets. Differences are not significant for same
Discussion
In this study, growth was positively affected by increasing feeding frequency. The best feeding frequency was found as 6 times per day for final live weight, live weight gain or SGR. But there is no significant difference among II, III and VI in these points. Extra feeding causes more labor and cost. Because of that tilapia farmers should be taken into consideration the labors and costs when applying high feeding frequency such as 6 times a day.
Present study indicates that the highest weight gain obtained by 6 times feeding per day confirmed with results obtained by Tung and Shiau (1990). The results of the current study are also supported with the results of Kubaryk (1980), Siraj ve ark. (1988), Yousif (2004), Ferrari and Hayashi (2001) and Lovell (1998) indicated that live weight gain was positively affected by increase feeding frequency.
It appears that as the feeding frequency increased, feed consumption was also increased. There is a non-linear relationship between FCR and feeding frequency, and highest FCR was obtained in VI trial group. This result can be explained more feed pass through digestive track with decreasing digestibility.
The present study was supported by Siraj and ark. (1988) found out that the best FCR results were achieved when they were fed 2 meals per day. On the other hand, Tung and Shiau (1990) stated that the best FCR was achieved with 6 meals per day feeding, which is not supported by the current study.
When total body and carcass compositions are taken into account, lipid accumulation was occurred in the body cavities and around the viscera in contrast to carcass, while protein accumulation was found especially in carcass due to the increasing feeding frequency.
Many factors can affect the feed consumption in fish such as amount of feed, feeding frequency, size of fish, water temperature, growth and feed quality. Feeding frequency and amount of feed are basic principles in fish rearing and should be performed regularly. Excessive feeding causes uneaten feed in culture media and after dissociation of uneaten feed affects water quality negatively. Feed losses and poor water quality decrease the feed efficiency.
Recording to the results of the study; it is understood that the effect of feeding frequency on tilapia culture is important. So, while feeding frequency shows parallelism with the growth in larval period, it is deduced that the mentioned relationship is in negative correlation when they were adult. In the regions where especially labour cost is very expensive, the gradual decrease in feeding frequency can provide economic benefit.
References
Anonymous. (1995) Association of official analytical chemists, Official methods of analysis. 16 th Ed. AOAC, Arlington, USA.
Ferrari L.E.S and Hayashi C. (2001) Effect of feeding frequency on Nile tilapia, Oreochromis
niloticus (L.) fries performance during sex reversal in hapas, Acta Scientiarum, Maringá, 23,
871-876.
Kubaryk J.M. (1980) Effect of diet, feeding schedule and sex on food consumption, Growth and retention of protein and energy by tilapia. Ph.D. Diss. Auburn University, AL.
Lovell R. T. (1998) Nutrition and feeding of Fish. 2nd Edn, Kluwer Academic Publishers, pp. 267, London, UK.
Meer M.B., H. Herwaarden and M.C.J. Verdegem. (1997) Effect of number of meals and frequency of feeding on voluntary feed intake of Colossoma macropomum (Cuvier). Oxford, Aquac. Res., 28, 419-432.
Riche M., M. Oetker, D.I. Haley, T. Smith, and D.L. Garling, (2004) Effect of feeding frequency on consumption, growth, and efficiency in juvenile tilapia (Oreochromis niloticus). The Israeli Journal of Aquaculture – Bamidgeh, 56, 247-255.
Sanches L.E.F. and C.Hayashi. (2001) Effect of feeding frequency on Nile tilapia, Oreochromis
niloticus (L.) fries performance during sex reversal in hapas. Maringá, 23, 871-876.
Siraj S.S., M.K.A. Kamaruddin and M.S. Kamarudin. (1988) Effects on feeding frequency on growth, food conversion and survival of red tilapia (Oreochromis mossambicus×O. niloticus) hybrit fry. In: The Second International Symposium on Tilapia in Aquaculture (Eds. Pullin, R.S.V., Bhukaswan, T., Tonguthai, K. & Maclean, J.L.), pp. 383-386. Manila, Philippines.
SPSS Inc. (1997) SPSS Base 7.5 for Window. SPSS Inc.,Chicago.
Tung P.H. and S.Y. Shiau. (1990) Effects of meal frequncy on growth performance of hybrit tilapia,
Oreochromis niloticus x O.aureus, Feed different carbohydrate diets. Aquaculture, 92, 343-350.
Wilson R.P. (1989) Amino acids and proteins. In: Fish Nutrition (Halver, J.E. ed.), 2nd edn, Vol. 1, pp. 119-147. Academic Press Inc., San Diego, CA, USA.
Yousif O. M. (2004) Apparent nutrient digestibility, Growth performance and feed utilization of juvenile Nile tilapia, Oreochromis niloticus L., as influenced by stocking density and feeding frequency. Emir. J. Agric. Sci., 16, 27-38.