African Journal of Marine Science 2020, 42(1): 43–51 Printed in South Africa — All rights reserved
African Journal of Marine Science is co-published by NISC (Pty) Ltd and Informa UK Limited (trading as Taylor & Francis Group) Copyright © NISC (Pty) Ltd AFRICAN JOURNAL OF
MARINE SCIENCE ISSN 1814-232X EISSN 1814-2338
https://doi.org/10.2989/1814232X.2020.1727953
Coastal regions globally are known to be dynamic, fragile and economically important areas that need continuous monitoring and protection since they are prone to climate- and non-climate forcing activities. The dominant climate-forcing threat to coastal areas is sea-level rise through climate change as a result of the release of greenhouse gases, largely from anthropogenic sources (Zhang et al. 2004). However, non-climate forcing, which results from poor economic and infrastructural development, increases erosion by making coastal areas more vulnerable to sea-level rise (Moser et al. 2012; Church et al. 2013; Slangen et al. 2016). These activities have compelled government agencies and bodies such as the Intergovernmental Panel on Climate Change (IPCC) to give attention to issues faced by coastal regions, through both public programmes and research (IPCC 2014; Nicholls 2018). Hence, coastal erosion is receiving increased attention as one such issue. To contain the erosion along coastal regions, various countries have employed diverse measures, including but not limited to coastal monitoring,
the construction of breakwaters and seawalls, and land reclamation (Glaser et al. 1991; Allersma and Tilmans 1993; Adger et al. 2005; Beatley 2012; Zhang et al. 2017; Lincke and Hinkel 2018).
With the advent of remote-sensing satellites, remote sensing has proven to be an effective means of analysing satellite images and data (Morain 1998; Zhao et al. 2018). Several methods have been developed to interpret Landsat images, for example, such as the normalised difference water index (NDWI), modified normalised difference water index (MNDWI) and automated water extraction index (AWEI). The NDWI is a method used for the extraction of water in Landsat images, proposed by McFeeters (1996), and incorporates the combination of the green band (TM2) and near infrared band (TM4), where NDWI = (TM2 – TM4)/ (TM2 + TM4). In this way, water features are improved, with a threshold of 1, and all other features are repressed, with a threshold of 0 (McFeeters 1996). However, in certain regions some land features are also improved, thereby appearing
Response of the barrier island coastal region of southwestern Nigeria to
climate and non-climate forcing
IB Danladi1* , M Gül1 and E Ateş2
1 Department of Geological Engineering, Muğla Sıtkı Koçman University, Mugla, Turkey 2 Vocational School of Ayaş, Ankara University, Ankara, Turkey
* Corresponding author, e-mail: [email protected]
Despite threats emanating from the influence of climate and non-climate forcing on the barrier island coastal region of southwestern Nigeria, the extent of the coastal erosion is poorly understood. We report evidence of coastal erosion and sediment accumulation in the region over a 34-year period (1973–2017), using Landsat imagery at intervals of approximately six years. Landsat image corrections and various water-extraction algorithms were used to systematically delineate coastal erosion and accumulation in the area. The region was subdivided into western and eastern subregions separated by Lagos Harbour. In the west, erosion took place during the periods 1973–1979, 1979–1984, 1990–1999 and 2005–2011, whereas in the east, erosion occurred during 1973–1979, 1990–1999 and 1999–2005. Coastal sediment accumulation occurred in the east during 1979–1984, 1984–1990, 2005–2011 and 2011–2017, whereas gains in the west occurred during 1984–1990, 1999–2005 and 2011–2017. The study revealed substantial net erosion of 1 228.1 ha in the region as a whole, over the full period. Sediment accumulation accompanying the coastal erosion appears to be linked to longshore drift. Erosion between 1973 and 2011 was probably attributable to climate change (storms and tidal conditions), longshore drift, the inflow and outflow of water at Lagos Harbour, coastal morphology and, possibly, human impacts. However, the coastal changes between 2011 and 2017 were more obviously associated with human activities, such as development of the Eko Atlantic construction project. Coastal surveillance, together with the use of environmentally sensitive protective measures, could possibly help to reduce coastal erosion in the region. Careful coastal management practices, including artificial nourishing and the installation of resilient structures (e.g. seawalls), should be undertaken to protect human settlements that are already at risk from sea-level rise.
Keywords: coastal erosion, Eko Atlantic project, Gulf of Guinea,human impacts, Landsat imagery, longshore drift, sediment accumulation, water extraction indices
Online supplementary material: Annotated satellite images showing changes in the barrier island coastal region of southwestern Nigeria are provided in Supplementary Figure S1, available at https://doi.org/10.2989/1814232X.2020.1727953.
Introduction
as water. Therefore, Xu (2006) suggested a modified version of the NDWI such that the average digital number of the middle infrared band (TM5) is much larger than that of TM4, and, if substituted for TM4 in the NDWI formula, the problem might be addressed, whereby MNDWI = (TM2 – TM5)/(TM2 + TM5). Ouma and Tateishi (2006) proposed a different combination of Landsat bands for estimating NDWI. Feyisa et al. (2014) suggested the AWEI as another method for water extraction, on the basis that the previous water-extraction methods could not differentiate between water and shadowed surfaces. Subject to the availability of suitable Landsat images, these methods are used widely for purposes such as risk assessments (e.g. Gu et al. 2008) and bathymetry estimation (e.g. Leal Alves et al. 2018). Recent studies have also demonstrated successful utilisation of the water extraction indices in delineating shoreline changes (e.g. Choung and Jo 2016; Do et al. 2018).
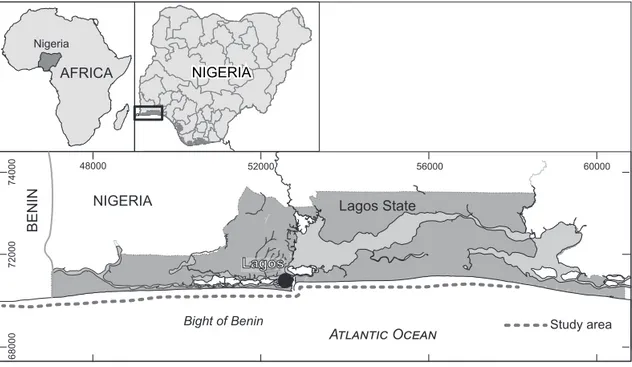
The barrier island coastal region of southwestern Nigeria (Figure 1), which is part of the sandy coastal region of the Gulf of Guinea in West Africa, is reported to be highly susceptible to climate change and human activities (French et al. 1995; Braimoh and Onishi 2007; Odunuga et al. 2014; Danladi et al. 2017). The region is characterised predominantly by two seasons: a wet and warm season between April and September, and a dry and warm season between October and March (Olaniyan and Afiesimama 2002). These seasons are characterised by a strong wave–climate relationship, with an increase (decrease) in wave height (with height ranging from 0.3 to 2.8 m) at the beginning (end) of the wet season. The wet–dry seasonal variations have been linked to maritime tropical air masses (Olaniyan and Afiesimama 2002). The region experiences predominantly southwesterly winds which are strong during the wet season. Owing to the physical characteristics of the region, including that it is low-lying, and given the nature
of its coastal materials, it has been reported to be affected by both climate-forcing (e.g. changes in seasonal wave direction) and non-climate forcing (including anthropogenic pressures such as construction and mining of beach sand) (see van Bentum et al. 2012). Previous studies have raised concerns with regard to coastal erosion, the ineffectiveness of structures protecting harbours, and the building of other structures (Ibe 1988; French et al. 1995; Awosika et al. 2000; van Bentum et al. 2012; Danladi et al. 2017). For example, a modelling study by van Bentum et al. (2012) suggested that the development of the Eko Atlantic construction project (a planned city built on reclaimed land, with an area of ~9 km2),
which began in 2008, would cause a shift in erosion to other regions. Most of these studies did not use more than two Landsat images to assess the erosion. This makes it difficult to capture the extent of coastal change caused by built structures such as the Eko Atlantic construction project and breakwaters. Hence, there is a need for monitoring and for erosion-mitigation strategies in this coastal region.
In the present study, using the NDWI, MNDWI and AWEI indices and single Landsat images taken every 6 years from 1973 to 2017 (but with a 9-year interval between 1990 and 1999, because of a lack of suitable images), we systematically documented the coastal erosion and sediment accumulation that occurred in the barrier island coastal region, giving particular attention to the Eko Atlantic project and associated breakwaters. Consideration was also given to the likely influence of longshore drift, rising sea levels and human activities.
Materials and methods
Study area
The barrier island coastal region of southwestern Nigeria, otherwise known as the Barrier Island Coast (as named by
NIGERIA NIGERIA NIGERIA Nigeria AFRICA Lagos State ATLANTIC OCEAN Bight of Benin Lagos BENIN NIGERIA Study area 48000 52000 56000 60000 72000 68000 74000
African Journal of Marine Science 2020, 42(1): 43–51 45
French et al. [1995]), comprises the coastal area of Lagos State, located between 6°22′34.4′′ N and 6°25′34.0′′ N, and between 2°42′43.0′′ E and 3°59′52.2′′ E. The area is bordered to the east by the Niger Delta and to the west by the Republic of Benin. The study area is approximately 171 km long and encompasses various lagoons and creeks (Pugh 1954; Sexton and Murday 1994), as well as the coastline of Lagos, the economically most important city in southwestern Nigeria (Figure 1). The Barrier Island Coast
is the most densely populated coastal region in Africa.1
The United Nations estimated the population of Lagos State to be about 11.2 million in 2011, and predicted that
it would reach 18.9 million by 2025.2 However, as of 2016,
the National Population Commission of Nigeria reported
a population of 21 million in Lagos State,3 indicating a
remarkable population growth rate that is likely to result in coastal stress in this part of Nigeria.
The region has a tropical savannah climate, according to
Koppen’s classification.3 The mean maximum temperature
is 30° C and the maximum annual rainfall is 1 800 mm, with humidity usually between 80 and 100% (Braimoh and Onishi 2007). The tidal range has been variously reported as between 1.22 and 1.3 m, and the wave height varies between 0.64 and 0.8 m (NEDECO 1961; RPI 1985; Oyegun 1988, 1990). The area is covered mainly by Quaternary deposits of sands, silts and clays (Geological Survey of Nigeria 1984).
Processing of Landsat images
Landsat images of the Barrier Island Coast, covering the years 1973 to 2017, but at intervals of 6 years, were downloaded from http://earthexplorer.usgs.gov. Prior to downloading, images from single days with little cloud cover were selected. Images were downloaded for 1973, 1979, 1984, 1990, 1999, 2005, 2011 and 2017, with the 9-year interval from 1990 to 1999 the consequence of a lack of suitable images.
As a first step, the Landsat images were corrected geometrically (Toutin 2004) because the images had been captured using a variety of sensors. This was followed by radiometric correction to eliminate noise, which is a major problem for Landsat images, as has been reported previously (Schowengerdt 2006). Finally, the images were corrected atmospherically (Liang et al. 2001). All the correction processes were performed using the software Envi 5.3. The NDWI, MNDWI and AWEI water extraction methods were each applied to the Landsat images and the algorithm that yielded the best result for each image was selected. Based on this, and taking note of Landsat bands, the NDWI of Ouma and Tateishi (2006) was adopted for images between 1973 and 1979, the NDWI of McFeeters (1996) was adopted for the image of 1984, and, owing to cloud and band differences, the AWEI was used for the years 1990 and 1999. The MNDWI of Xu (2006) was used to extract water in the Landsat images of 2005, 2011 and
2017. All these image-processing activities were performed in Envi 5.3. Table 1 presents details of the satellite images used and the algorithms applied.
After extracting the water regions using Envi 5.3, all Landsat images were transferred to ArcGIS 10.2 for the calculation of eroded and/or gained coastal area. The coastal line of the 1979 image of a given location, for example, was compared with the coastal line of the 1973 image. The numbers of eroded and gained areas were then counted, and eroded areas were evaluated as negative, and gained areas as positive. Accordingly, the counts provided an understanding of the number of coastal regions experiencing erosion or gain. The areas of maximum erosion and gain were also computed. Total coastal variation was calculated as the sum of all gained and eroded areas, and the average was obtained by dividing total coastal variation by the total count. A similar process was applied to pairs of images from: 1984 and 1979, 1990 and 1984, 1999 and 1990, 2005 and 1999, 2011 and 2005, and 2017 and 2011.
Results
A summary of changes that occurred on the Barrier Island Coast as a whole, in the various periods under study, are presented in Table 2. The coast was then divided into two subregions, to the west and east of Lagos Harbour (Table 3). The Landsat images were grouped into 23 sections to facilitate visualisation of erosion and gain (Figure 2; Supplementary Figure S1). A representative section of the coast, incorporating Lagos Harbour, is illustrated in Figure 3, showing variation in erosion and gain over the study period.
A summary of coastal changes per period, based on the information presented in Table 3 and Supplementary Figure S1, is as follows:
• 1973–1979. Generally, coastal loss was recorded in the eastern subregion, whereas areas of coastal gain and erosion were interspersed in the western subregion. • 1979–1984. This period marked the start of general
coastal erosion in the western subregion. The sediments lost to erosion appeared to be transported by longshore currents and deposited to the east of Lagos Harbour. • 1984–1990. During this period there was sediment
accumulation in both the western and eastern subregions. • 1990–1999. A marked loss in coastal areas was observed
in both subregions during this period.
• 1999–2005. In the western subregion there was mainly coastal sediment accumulation although with some erosion. • 2005–2011. In the western subregion there were
alternating areas of erosion and accumulation. In the east there was also both sediment accumulation and erosion. • 2011–2017. During this period there was sediment
accumulation in the western subregion, and erosion was observed in the east.
Discussion
The study identified coastal erosion and sediment accumulation in a number of coastal areas in the eastern and western subregions of the Barrier Island Coast of
1See https://data.worldbank.org/indicator/EN.POP.
DNST?contextual=max&locations=ZG-8S-Z4-NG
2See https://www.un.org/en/development/desa/population/publications/
pdf/urbanization/WUP2011_Report.pdf
Nigeria (Supplementary Figure S1), with an example of both erosion and coastal accumulation evident in the vicinity of Lagos Harbour (Figure 3). Identification of the mechanisms causing coastal erosion and accumulation is critical in facilitating hazard prevention, the stabilisation of shorelines,
and the development of coastal management practices (Adger et al. 2005; Pomeroy et al. 2006; Beatley 2012; Tay et al. 2018). Based on our results and published literature pertaining to the Barrier Island Coast (Olaniyan and Afiesimama 2002; van Bentum et al. 2012; Danladi et al. 2017), we argue below that the coastal erosion in the study area from 1973 to 2011 was probably a result of climate and non-climate forcing, such as storm and tidal conditions, longshore drift, the flow of water into and out of Lagos Harbour, coastal morphology, and possibly human impacts. However, the coastal transformations between 2011 and 2017 were probably due largely to a combination of human activities (e.g. development of the Eko Atlantic construction project), coupled with longshore drift.
Through thermal expansion and the melting of glacial ice, climate change causes an increase in sea surface temperatures and subsequently an intensification of erosion as a result of sea-level rise (Church et al. 2013). There is substantial agreement among various studies around the globe that sea-level rise is an important component of coastal erosion (e.g. Swift 1968; Zhang et al. 2004; Thampanya et al. 2006; Gül et al. 2017, 2019), and similarly among studies along the coastal region of southwestern
Satellite Sensor Date Algorithm Reference
Landsat-1 Multispectral Scanner
(MSS) 19 January 1973Landsat-1 3 5 4 5 4 NDWI Landsat-2 3 5 4 5 4 NDWI Landsat-5 2 McFeeters 4 2 4 NDWI
Landsat-4 AWEIno shadow 4 (
b 2 b 5
b 4 b 5
ρ ρ )
( 0 . 2 5 × ρ + 2 . 7 5 × ρ )
Landsat-7 AWEIno shadow 4 (
b 2 b 5
b 4 b 5
ρ ρ )
( 0 . 2 5 × ρ + 2 . 7 5 × ρ )
Landsat-7 MNDWI Green MIR Green + MIR
Landsat-7 MNDWI Green MIR Green + MIR
Landsat-8 MNDWI Green MIR Green + MIR
Ouma and Tateishi (2006) Landsat-2 MSS 2 February 1979 Landsat-1 3 5 4 5 4 NDWI Landsat-2 3 5 4 5 4 NDWI Landsat-5 2 McFeeters 4 2 4 NDWI
Landsat-4 AWEIno shadow 4 (
b 2 b 5
b 4 b 5
ρ ρ )
( 0 . 2 5 × ρ + 2 . 7 5 × ρ )
Landsat-7 AWEIno shadow 4 (
b 2 b 5 b 4 b 5 ρ ρ ) ( 0 . 2 5 × ρ + 2 . 7 5 × ρ )
Landsat-7 MNDWI Green MIR Green + MIR
Landsat-7 MNDWI Green MIR Green + MIR
Landsat-8 MNDWI Green MIR Green + MIR
Ouma and Tateishi (2006) Landsat-5 MSS 18 December 1984 Landsat-1 3 5 4 5 4 NDWI Landsat-2 3 5 4 5 4 NDWI Landsat-5 2 McFeeters 4 2 4 NDWI
Landsat-4 AWEIno shadow 4 (
b 2 b 5
b 4 b 5
ρ ρ )
( 0 . 2 5 × ρ + 2 . 7 5 × ρ )
Landsat-7 AWEIno shadow 4 (
b 2 b 5
b 4 b 5
ρ ρ )
( 0 . 2 5 × ρ + 2 . 7 5 × ρ )
Landsat-7 MNDWI Green MIR Green + MIR
Landsat-7 MNDWI Green MIR Green + MIR
Landsat-8 MNDWI Green MIR Green + MIR
McFeeters (1996) Landsat-4 Thematic Mapper 27 December 1990
Landsat-1 3 5 4 5 4 NDWI Landsat-2 3 5 4 5 4 NDWI Landsat-5 2 McFeeters 4 2 4 NDWI
Landsat-4 AWEIno shadow 4 (
b 2 b 5
b 4 b 5
ρ ρ )
( 0 . 2 5 × ρ + 2 . 7 5 × ρ )
Landsat-7 AWEIno shadow 4 (
b 2 b 5
b 4 b 5
ρ ρ )
( 0 . 2 5 × ρ + 2 . 7 5 × ρ )
Landsat-7 MNDWI Green MIR Green + MIR
Landsat-7 MNDWI Green MIR Green + MIR
Landsat-8 MNDWI Green MIR Green + MIR
Feyisa et al. (2014)
Landsat-7 Enhanced Thematic
Mapper (ETM) 18 November 1999
Landsat-1 3 5 4 5 4 NDWI Landsat-2 3 5 4 5 4 NDWI Landsat-5 2 McFeeters 4 2 4 NDWI
Landsat-4 AWEIno shadow 4 (
b 2 b 5 b 4 b 5 ρ ρ ) ( 0 . 2 5 × ρ + 2 . 7 5 × ρ )
Landsat-7 AWEIno shadow 4 (
b 2 b 5
b 4 b 5
ρ ρ ) ( 0 . 2 5 × ρ + 2 . 7 5 × ρ )
Landsat-7 MNDWI Green MIR Green + MIR
Landsat-7 MNDWI Green MIR Green + MIR
Landsat-8 MNDWI Green MIR Green + MIR
Feyisa et al. (2014)
Landsat-7 ETM 17 October 2005
Landsat-1 3 5 4 5 4 NDWI Landsat-2 3 5 4 5 4 NDWI Landsat-5 2 McFeeters 4 2 4 NDWI
Landsat-4 AWEIno shadow 4 (
b 2 b 5 b 4 b 5 ρ ρ ) ( 0 . 2 5 × ρ + 2 . 7 5 × ρ )
Landsat-7 AWEIno shadow 4 (
b 2 b 5 b 4 b 5 ρ ρ ) ( 0 . 2 5 × ρ + 2 . 7 5 × ρ )
Landsat-7 MNDWI Green MIR Green + MIR
Landsat-7 MNDWI Green MIR Green + MIR
Landsat-8 MNDWI Green MIR Green + MIR
Xu (2006)
Landsat-7 ETM 2 October 2011
Landsat-1 3 5 4 NDWI Landsat-2 3 5 4 5 4 NDWI Landsat-5 2 McFeeters 4 2 4 NDWI
Landsat-4 AWEIno shadow 4 (
b 2 b 5
b 4 b 5
ρ ρ )
( 0 . 2 5 × ρ + 2 . 7 5 × ρ )
Landsat-7 AWEIno shadow 4 (
b 2 b 5
b 4 b 5
ρ ρ )
( 0 . 2 5 × ρ + 2 . 7 5 × ρ )
Landsat-7 MNDWI Green MIR Green + MIR
Landsat-7 MNDWI Green MIR Green + MIR
Landsat-8 MNDWI Green MIR Green + MIR
Xu (2006)
Landsat-8 The Operational Land Imager and the Thermal Infrared Sensor (OLI-TIRS) 17 April 2017 Landsat-2 3 5 4 5 4 NDWI Landsat-5 2 McFeeters 4 2 4 NDWI
Landsat-4 AWEIno shadow 4 (
b 2 b 5
b 4 b 5
ρ ρ )
( 0 . 2 5 × ρ + 2 . 7 5 × ρ )
Landsat-7 AWEIno shadow 4 (
b 2 b 5
b 4 b 5
ρ ρ )
( 0 . 2 5 × ρ + 2 . 7 5 × ρ )
Landsat-7 MNDWI Green MIR Green + MIR
Landsat-7 MNDWI Green MIR Green + MIR
Landsat-8 MNDWI Green MIR Green + MIR
Xu (2006)
Table 1: Details of Landsat images used in this study of coastal erosion and accumulation on the Barrier Island Coast of southwestern Nigeria, including names of the satellite and sensor, image date, the algorithm used and associated references. AWEI = automated water extraction index; MIR = mid-infrared; MNDWI = modified normalised difference water index; NDWI = normalised difference water index; ρ = the reflectance value of spectral bands
Period Count Minimum (ha) Maximum (ha) Average (ha) Total(ha) 1973–1979 92 −977.49 16.22 −12.51 −1 151.55 1979–1984 83 −476.84 301.36 −0.62 −51.46 1984–1990 101 −38.13 259.95 4.57 461.34 1990–1999 13 −683.69 10.59 −96.05 −1 248.69 1999–2005 57 −51.16 145.73 2.69 153.09 2005–2011 98 −70.15 256.05 0.44 42.82 2011–2017 106 −29.79 393.35 5.34 566.35
Table 2: Variations in coastal areas (erosion/gain) on the Barrier Island Coast of southwestern Nigeria. Count = number of areas with gain or loss; Minimum = the highest coastal erosion; Maximum = the highest coastal gain; Average = the sum of all gained and eroded areas divided by the total count; Total = total coastal area either lost (negative) or gained (positive)
African Journal of Marine Science 2020, 42(1): 43–51 47
Nigeria (e.g. Oyegun 1990; Allersma and Tilmans 1993; French et al. 1995; Fashae and Onafeso 2011; Obiefuna et al. 2013; Odunuga et al. 2014; Idowu and Home 2015; Oyedotun 2015; Danladi et al. 2017; Dada et al. 2019). Additionally, flooding and marine ecosystem disturbances owing to increasing sea-level rise are major threats that have been reported in the study area (Mintzer 2010; Fashae and Onafeso 2011). However, these studies have also suggested that coastal erosion is not solely dependent on sea-level rise (climate forcing) but also on other possible factors (non-climate forcing). In the study area, some of the
factors reported in the literature are the directional change of longshore drift (Bird 2011), sediment delivery by rivers (e.g. Syvitski et al. 2005), and human activities (Awosika and Ibe 1993) such as dredging and even the building of dams (Allersma and Tilmans 1993). Moreover, some of the coastal gains in the western subregion (from 2011 onwards) are likely due to land reclamation for the Eko Atlantic construction project (van Bentum et al. 2012) and, possibly, to the construction of breakwaters along the coast, although these breakwaters have been reported by Danladi et al. (2017) to be ineffective in terms of the prevention of erosion.
Period Subregion Count Minimum (ha) Maximum (ha) Average (ha) Total (ha) 1973–1979 WestEast 902 −977.49−48.06 16.220.50 −488.50−2.01 −976.99−181.01 1979–1984 WestEast 3152 −476.84−7.83 301.3625.63 −8.3912.41 −436.20384.74 1984–1990 WestEast 2081 −38.13−6.54 259.9534.44 22.460.15 449.1612.18 1990–1999 WestEast 112 −683.68519.22 10.590.77 −254.32−67.28 −508.63−740.06 1999–2005 WestEast 2730 −51.16−6.03 145.737.66 −7.1111.51 −192.19345.29 2005–2011 WestEast 3959 −70.15−51.47 256.0416.83 −2.354.65 −138.48181.30 2011–2017 WestEast 5254 −29.79−4.21 393.3552.79 8.192.59 426.09140.26 Table 3: Variations (erosion/gain) of coastal areas on the Barrier Island Coast of southwestern Nigeria, for subregions to the west and east of Lagos Harbour. Count = number of areas with a gain or loss; Minimum = the highest coastal erosion; Maximum = the highest coastal gain; Average = the sum of all gained and eroded areas divided by the total count; Total = total coastal area either lost (negative) or gained (positive)
Figure 2: Satellite map of the study area on the Barrier Island Coast of southwestern Nigeria, subdivided into the 23 sections shown separately in Supplementary Figure S1
Figure
3:
A representative section (i.e. section 13; see Figure 2) of the Barrier Island Coast of southwestern
Nigeria, indicating
coastal erosion
and gain. Green shading
represents coastal
gain, and blue shading represents coastal loss. Coastal variation is shown between (a) 1973 and 1979; (b) 1979 and 1984; (c)
1984 and 1990; (d) 1990 and 1999; (e) 1999 and 2005;
African Journal of Marine Science 2020, 42(1): 43–51 49
Land reclamation has been practised in the coastal regions of various countries, including China (Wang et al. 2014; Zhang et al. 2017), Egypt (Mostafa 2012), Singapore (Glaser et al. 1991; Tay et al. 2018) and the United Arab Emirates (De Jong et al. 2005) and has yielded positive results in terms of coastal gains. However, some studies have drawn attention to the impacts of land reclamation on groundwater (Waterman et al. 1998; Jiao et al. 2001; Guo and Jiao 2007). In Lagos, there are concerns related to seawater intrusion associated with reclamation (Idowu and Home 2015). These reports are consistent with our findings related to coastal erosion. It appears that when sea-level rise occurs erosion takes place (depending on the coastal morphology), and is then intensified by storm and tidal conditions, human activities (e.g. land reclamation and dredging) and longshore drift (Anthony et al. 2002; Bird 2011).
The identification of alternating areas of coastal erosion and sediment accumulation in the eastern subregion might be linked to longshore drift. It has been suggested that, as sea level rises, sediments are first eroded and later transported to adjacent areas by the longshore drift, which travels eastward (Bird 2011). The longshore drift in this region has previously been identified as the most important mechanism for the supply of sand sediment in the Gulf of Guinea, West Africa (Laïbi et al. 2014; Almar et al. 2015). The Gulf of Guinea is dominated by waves and tides (Anthony et al. 2002), and alternating areas of coastal erosion and sediment accumulation are common occurrences on the sand-barrier coasts of West Africa (Blivi et al. 2002; Laïbi et al. 2014). Consistent with our findings, Laïbi et al. (2014) observed several examples of coastal accretion adjacent to areas of coastal erosion related to longshore drift in the Bight of Benin. Similar observations were made by Boateng (2012) in Ghana. However, it is important to note that the longshore drift itself has been reported to be affected by a number of anthropogenic structures, such as the deepwater port of Lagos constructed in 1957 (Laïbi et al. 2014), and the construction of a breakwater in 1912 to facilitate entrance to Lagos Harbour (Bird 2011). We suggest that most of the coastal erosion observed in the eastern subregion of the study area since commencement of the Eko Atlantic construction project is probably related to interference with the longshore drift. Conclusions
The present study examined coastal erosion and sediment accumulation (1973–2017) along the barrier island coastal region of southwestern Nigeria. The region was subdivided into eastern and western subregions separated by Lagos Harbour. The study shows that:
1. Substantial net erosion (a total of 1 228.1 hectares) occurred over the region and study period as a whole. In the west, erosion took place during the periods 1973–1979, 1979–1984, 1990–1999 and 2005–2011, whereas in the east, erosion occurred during 1973–1979, 1990–1999 and 1999–2005.
2. Coastal gains were recorded in the western subregion during 1984–1990, 1999–2005 and 2011–2017, whereas in the east, coastal gains occurred during 1979–1984, 1984–1990, 2005–2011 and 2011–2017.
3. The coastal changes between 1973 and 2011 were possibly as a result of natural factors, such as storm and tidal conditions, longshore drift, the flow of water into and out of Lagos Harbour, coastal morphology and possibly human impacts. However, coastal transformation between 2011 and 2017 appeared to be heavily influenced by human activities (notably, development of the Eko Atlantic project), coupled with longshore drift.
4. We recommend the use of coastal surveillance and more environmentally sensitive coastal structures/defences. Careful coastal management practices (e.g. artificial nourishing and the installation of resilient structures such as seawalls) must be undertaken to protect human settlements that are already at risk from sea-level rise. 5. For the purposes of monitoring coastal change, future
studies should consider localised regions by using high-resolution satellite images, such as IKONOS satellite imagery (Dial et al. 2003).
ORCID
Iliya Bauchi Danladi: https://orcid.org/0000-0001-6173-118X Murat Gül: https://orcid.org/0000-0003-1555-6426
References
Adger WN, Hughes TP, Folke C, Carpenter SR, Rockström J. 2005. Social-ecological resilience to coastal disasters. Science 309: 1036–1039.
Allersma E, Tilmans WM. 1993. Coastal conditions in West Africa – a review. Ocean and Coastal Management 19: 199–240. Almar R, Kestenare E, Reyns J, Jouanno J, Anthony EJ, Laibi R et
al. 2015. Response of the Bight of Benin (Gulf of Guinea, West Africa) coastline to anthropogenic and natural forcing. Part 1: wave climate variability and impacts on the longshore sediment transport. Continental Shelf Research 110: 48–59.
Anthony EJ, Oyédé LM, Lang J. 2002. Sedimentation in a fluvially infilling, barrier-bound, estuary on a wave-dominated, microtidal coast: the Ouémé River estuary, Benin, West Africa. Sedimentology 49: 1095–1112.
Awosika LF, Ibe AC. 1993. Geomorphology and tourism-related aspects of the Lekki barrier-lagoon coastline in Nigeria. In: Wong PP (ed.), Tourism vs environment: the case for coastal areas. Netherlands: Springer. pp 109–124.
Awosika LF, Dublin-Green CO, Folorunsho R, Adekoya EA, Adekanmbi MA, Jim-Saiki J. 2000. Study of main drainage channels of Victoria and Ikoyi islands in Lagos, Nigeria and their response to tidal and sea-level changes. Special report. Paris: CSI-UNESCO (Coastal Regions and Small Islands: United Nations Educational, Scientific and Cultural Organization). Beatley T. 2012. Planning for coastal resilience: best practices for
calamitous times. London: Island Press.
Bird EC. 2011. Coastal geomorphology: an introduction. Chichester, UK: John Wiley and Sons.
Blivi A, Anthony EJ, Oyédé LM. 2002. Sand-barrier development in the Bight of Benin, West Africa. Ocean and Coastal Management 45: 185–200.
Boateng I. 2012. An application of GIS and coastal geomorphology for large-scale assessment of coastal erosion and management: a case study of Ghana. Journal of Coastal Conservation 16: 383–397.
Braimoh AK, Onishi T. 2007. Spatial determinants of urban land-use change in Lagos, Nigeria. Land Use Policy 24: 502–515.
Choung YJ, Jo MH. 2016. Shoreline change assessment for various types of coasts using multi-temporal Landsat imagery of the east coast of South Korea. Remote Sensing Letters 7: 91–100.
Church JA, Clark PU, Cazenave A, Gregory JM, Jevrejeva S, Levermann A et al. 2013. Sea-level change. In: Stocker TF, Qin D, Plattner GK, Tignor M, Allen SK, Boschung J et al. (eds), Climate change 2013: the physical science basis. Contribution of Working Group I to the Fifth Assessment Report of the Intergovernmental Panel on Climate Change. Cambridge, UK and New York: Cambridge University Press. pp 1137–1216. Dada OA, Agbaje AO, Adesina RB, Asiwaju-Bello YA. 2019. Effect
of coastal land-use change on coastline dynamics along the Nigerian Transgressive Mahin mud coast. Ocean and Coastal Management 168: 251–264.
Danladi IB, Kore BM, Gül M. 2017. Vulnerability of the Nigerian coast: an insight into sea-level rise owing to climate change and anthropogenic activities. Journal of African Earth Sciences 134: 493–503.
de Jong RJ, van Gelderen PJG, Lindo MH, Fernandez J. 2005. Presentation: Dubai’s extreme reclamations. The CEDA Dredging Days 2005 Conference, 2–4 November, Rotterdam, The Netherlands.
Dial G, Bowen H, Gerlach F, Grodecki J, Oleszczuk R. 2003. IKONOS satellite, imagery, and products. Remote Sensing of Environment 88: 23–36.
Do AT, de Vries S, Stive MJ. 2018. The estimation and evaluation of shoreline locations, shoreline-change rates, and coastal-volume changes derived from Landsat images. Journal of Coastal Research 35: 56–71.
Fashae OA, Onafeso OD. 2011. Impact of climate change on sea-level rise in Lagos, Nigeria. International Journal of Remote Sensing 32: 9811–9819.
Feyisa GL, Meilby H, Fensholt R, Proud SR. 2014. Automated water extraction index: a new technique for surface water mapping using Landsat imagery. Remote Sensing of Environment 140: 23–35.
French GT, Awosika LF, Ibe CE. 1995. Sea-level rise and Nigeria: potential impacts and consequences. Journal of Coastal Research 14: 224–242.
Geological Survey of Nigeria. 1984. Geological map of Nigeria 1:2000 000. Kaduna, Nigeria: Geological Survey of Nigeria. Glaser R, Haberzettl P, Walsh RPD. 1991. Land reclamation in
Singapore, Hong Kong and Macau. GeoJournal 24: 365–373. Gu Y, Hunt E, Wardlow B, Basara JB, Brown JF, Verdin JP.
2008. Evaluation of MODIS NDVI and NDWI for vegetation drought monitoring using Oklahoma Mesonet soil moisture data. Geophysical Research Letters 35: L22401.
Gül M, Danladi IB, Kore BM. 2017. Coastal types of graben: the Gulf of Gökova, Mugla-SW Turkey. Journal of Coastal Conservation 21: 127–138.
Gül M, Salihoğlu R, Dinçer F, Darbaş G. 2019. Coastal geology of Iztuzu Spit (Dalyan, Muğla, SW Turkey). Journal of African Earth Sciences 151: 173–183.
Guo H, Jiao JJ. 2007. Impact of coastal land reclamation on groundwater level and the seawater interface. Ground Water 45: 362–367.
Huang B, Thorne PW, Banzon VF, Boyer T, Chepurin G, Lawrimore JH et al. 2017. Extended reconstructed sea surface temperature, version 5 (ERSSTv5): upgrades, validations, and intercomparisons. Journal of Climate 30: 8179–8205.
Ibe AC. 1988. Coastal erosion in Nigeria. Ibadan, Nigeria: Ibadan University Press.
Idowu TE, Home P. 2015. Probable effects of sea-level rise and land reclamation activities on coastlines and wetlands of Lagos Nigeria. Proceedings of the 10th JKUAT Scientific Technological and Industrialization Conference: Water, Energy, Environment
and Climate, November 2015, Nairobi, Kenya. Nairobi, Kenya: Jomo Kenyatta University of Agriculture and Technology. pp 207–220.
IPCC (Intergovernmental Panel on Climate Change). 2014. Climate change 2014: synthesis report. Contribution of Working Groups I, II and III to the Fifth Assessment Report of the Intergovernmental Panel on Climate Change (Core writing team: Pachauri RK, Meyer LA [eds]). Geneva, Switzerland: IPCC.
Jiao JJ, Nandy S, Li H. 2001. Analytical studies on the impact of reclamation on groundwater flow. Ground Water 39: 912–920. Laïbi RA, Anthony EJ, Almar R, Castelle B, Senechal N,
Kestenare E. 2014. Longshore drift cell development on the human-impacted Bight of Benin sand-barrier coast, West Africa. Journal of Coastal Research 70(Supplement 1): 78–83.
Leal Alves DC, Espinoza JMA, Albuquerque MG, Silva MB, Fontoura JS, Serpa C, Weschenfelder J. 2018. Bathymetry estimation by orbital data of OLI sensor: a case study of the Rio Grande Harbor, southern Brazil. In: Shim JS, Chun I, Lim HS (eds.), Proceedings from the International Coastal Symposium (ICS) 2018, Busan, Republic of Korea. Journal of Coastal Research 85(special issue): 51–55.
Liang S, Fang H, Chen M. 2001. Atmospheric correction of Landsat ETM+ land surface imagery. I. Methods. IEEE Transactions on Geoscience and Remote Sensing 39: 2490–2498.
Lincke D, Hinkel J. 2018. Economically robust protection against 21st century sea-level rise. Global Environmental Change 51: 67–73.
McFeeters SK. 1996. The use of normalized difference water index (NDWI) in the delineation of open water features. International Journal of Remote Sensing 17: 1425–1432.
Mintzer R. 2010. Destroying mangroves in West Africa detrimental to people, climate, and wildlife. Media Global, 25 March.
Morain SA. 1998. A brief history of remote-sensing applications, with emphasis on Landsat. In: Liverman D, Moran EF, Rindfuss RR, Stern PC (eds), People and pixels: linking remote sensing and social science. Washington DC: National Academy Press. pp 28–50.
Moser SC, Williams J, Boesch DF. 2012. “Wicked” challenges at land’s end: managing coastal vulnerability under climate change. Annual Review of Environment and Resources 37: 51–78. Mostafa YES. 2012. Environmental impacts of dredging and land
reclamation at Abu Qir Bay, Egypt. Ain Shams Engineering Journal 3: 1–15.
NEDECO (Netherlands Engineering Consultants). 1961. The waters of the Niger Delta. The Hague, Netherlands: NEDECO. Nicholls RJ. 2018. Adapting to sea-level rise. In: Zommers Z,
Alverson K (eds), Resilience. Amsterdam, Netherlands: Elsevier. pp 13–29.
Obiefuna JN, Nwilo PC, Atagbaza AO, Okolie CJ. 2013. Spatial changes in the wetlands of Lagos/Lekki lagoons of Lagos, Nigeria. Journal of Sustainable Development 6: 123–133. Odunuga S, Badru G, Bello OM. 2014. Climate change, sea-level
rise and coastal inundation along part of Nigeria Barrier Lagoon Coast. Journal of Applied Sciences and Environmental Management 18: 41–47.
Olaniyan E, Afiesimama EA. 2002. On marine winds, waves and swells over West African Coast for effective coastal management – a case study of Victoria Island beach in Nigeria. In: OCEANS 2002 IEEE/MTS Conference Proceedings, Volume 1. Piscataway, New Jersey: IEEE (Institute of Electrical and Electronics Engineers/Oceanic Engineering Society) and Marine Technology Society (MTS). pp 561–568.
Ouma YO, Tateishi R. 2006. A water index for rapid mapping of shoreline changes of five East African Rift Valley lakes: an empirical analysis using Landsat TM and ETM+ data. International Journal of Remote Sensing 27: 3153–3181.
African Journal of Marine Science 2020, 42(1): 43–51 51 coastline of Ondo State, Nigeria. Cinq Continents 5: 219–230.
Oyegun CU. 1988. Process-form relationships along Forcados Beach in southern Nigeria. PhD thesis, University of Ibadan, Nigeria.
Oyegun CU. 1990. The management of coastal zone erosion in Nigeria. Ocean and Shoreline Management 14: 215–228. Pomeroy RS, Ratner BD, Hall SJ, Pimoljinda J, Vivekanandan V.
2006. Coping with disaster: rehabilitating coastal livelihoods and communities. Marine Policy 30: 786–793.
Pugh JC. 1954. A classification of the Nigerian coastline. Journal of the West African Science Association 1: 3–12.
RPI (Research Planning Institute). 1985. Environmental baseline studies for the establishment of control criteria and standards against petroleum related pollution in Nigeria. Final report to the Nigeria National Petroleum Corporation (NNPC). Columbia, South Carolina: Research Planning Institute, Inc.
Schowengerdt RA. 2006. Remote sensing: models and methods for image processing (3rd edn). Amsterdam, Netherlands: Academic Press/Elsevier.
Sexton WJ, Murday M. 1994. The morphology and sediment character of the coastline of Nigeria: the Niger Delta. Journal of Coastal Research 10: 959–977.
Slangen AB, Church JA, Agosta C, Fettweis X, Marzeion B, Richter K. 2016. Anthropogenic forcing dominates global mean sea-level rise since 1970. Nature Climate Change 6: 701–705. Swift DJ. 1968. Coastal erosion and transgressive stratigraphy. The
Journal of Geology 76: 444–456.
Syvitski JPM, Vörösmarty CJ, Kettner AJ, Green P. 2005. Impact of humans on the flux of terrestrial sediment to the global coastal ocean. Science 308: 376–380.
Tay JY, Wong SK, Chou LM, Todd PA. 2018. Land reclamation and the consequent loss of marine habitats around the Ayer Islands, Singapore. Nature in Singapore 11: 1–5.
Thampanya U, Vermaat JE, Sinsakul S, Panapitukkul N. 2006. Coastal erosion and mangrove progradation of southern Thailand. Estuarine, Coastal and Shelf Science 68: 75–85. Toutin T. 2004. Geometric processing of remote-sensing images:
models, algorithms and methods. International Journal of Remote Sensing 25: 1893–1924.
van Bentum KM, Hoyng CW, Van Ledden M, Luijendijk AP, Stive MJF. 2012. The Lagos coast: investigation of the long-term morphological impact of the Eko Atlantic City project. In: Kranenberg WM, Horstman EM, Wijnberg KM (eds), Proceedings of the Jubilee Conference NCK-Days 2012: Crossing Borders in Coastal Research, 13–16 March 2012, Enschede, Netherlands. Enschede, Netherlands: University of Twente.
Wang W, Liu H, Li Y, Su J. 2014. Development and management of land reclamation in China. Ocean and Coastal Management 102: 415–425.
Waterman RE, Misdorp R, Mol A. 1998. Interactions between water and land in The Netherlands. Journal of Coastal Conservation 4: 115–126.
Xu H. 2006. Modification of normalised difference water index (NDWI) to enhance open water features in remotely sensed imagery. International Journal of Remote Sensing 27: 3025–3033. Zhang K, Douglas BC, Leatherman SP. 2004. Global warming and
coastal erosion. Climatic Change 64: 41–58.
Zhang J, Su F, Ding Z. 2017. Sea reclamation status of countries around the South China Sea from 1975 to 2010. Sustainability 9: 878.
Zhao F, Huang C, Goward SN, Schleeweis K, Rishmawi K, Lindsey MA et al. 2018. Development of Landsat-based annual U.S. forest disturbance history maps (1986–2010) in support of the North American Carbon Program (NACP). Remote Sensing of Environment 209: 312–326.