Selçuk-Teknik Dergisi ISSN 1302-6178 Journal of Selcuk-Technic
Özel Sayı 2018 (ICENTE’17) Special Issue 2018 (ICENTE'17)
Abstract
Estimation of energy demand is used as an important tool for decision makers determining company strategies and policies. Apart from this, the fact that the actual consumption differs from the forecast is harmful for the economy of the company and even for the economy of the big scale. In this study, it is aimed to estimate the imbalance aberration caused by demand forecast deviation with Artificial Neural Networks and to evaluate its results.
Keywords: Artificial Neural Network, Demand Prediction, Unbalance cost, prediction,
Energy Demand
1. Introduction
Accurate estimation of the amount of energy needed by countries is important for decision makers that determine energy strategies and policies. Particularly, in energy-driven outsourcing countries and in developing countries where demand for electricity is rising relatively fast, the demand forecasts become even more important. On the basis of this precept lies both economic and political reasons. It is economically important; energy consumption has affected many economic parameters such as current account deficit, inflation and growth. Furthermore, the liberalization of energy markets, which are becoming increasingly widespread throughout the world, has led to the energy prices being
+This paper has been presented at the ICENTE'17 (International Conference on Engineering Technologies)
ESTIMATION OF UNBALANCE COST DUE TO DEMAND PREDICTION ERRORS USING ARTIFICIAL NEURAL NETWORK
Abdullah Erdal TÜMER1, Cankat YAVUZ1, Sabri KOÇER1*,+
1 Necmettin Erbakan University, Konya/Turkey, [email protected]
1Necmettine Erbakan University, Konya/Turkey, [email protected]
Selçuk-Teknik Dergisi ISSN 1302-6178 Journal of Selcuk-Technic
Özel Sayı 2018 (ICENTE’17) Special Issue 2018 (ICENTE'17)
determined by supply and demand to a large extent. For this reason, imbalances are generally punished in other examples of energy markets in the world and in Turkey.
Electricity is an energy that must be consumed when it is produced because it cannot be stored, or rather it is very costly to store. Therefore, demand forecasts in electricity markets are indispensable. In order to meet the electricity need, TETAŞ (Türkiye Elektrik Ticaret ve Taahhüt A.Ş.- Turkey Electricity Trade and Contracting Co.) receives energy with bilateral agreement depending on the estimations that it has sent from 1 year ago. However, estimates made a year ago do not adequately reflect the needs of the present day, and companies are aiming to get the energy they need by estimating demand in the Day Ahead Market (DAM). However, if the amount of energy received by TETAŞ cannot meet the amount of energy in the day, or if it is in excess of the amount of energy, companies have to provide the supply demand balance by selling the excess electricity on
their hands or by purchasing the missing part from this market. This situation causes the imbalance costs. This loss must be able to be controlled / predicted.
Recently, studies have been carried out on electricity energy consumption and load forecasting, distribution and planning analysis in electricity generation. In the paper entitled “Grey prediction with rolling mechanism for electricity demand forecasting of Turkey” are proposed in the estimation of electricity demand. The study shows that the GPRM approach can be used as a useful tool for short-term load estimation for Turkey [1].
For Niğde in Turkey, load estimation was performed by two different methods. These methods are artificial neural network backpropagation algorithm and nonlinear trend analysis moving average methods. It has been shown that the most appropriate method is artificial neural network. The estimates obtained by both methods of 2001 were compared with the actual values and it was found that the estimation results are very close to the real values [2].
Turkey's electricity consumption is modeled using the Support Vector Regression. According to the model result, Turkey's electricity consumption in the next 20 years will reach 284.9 TWh, which is estimated to be about twice the 2006 value. They stated that the
Selçuk-Teknik Dergisi ISSN 1302-6178 Journal of Selcuk-Technic
Özel Sayı 2018 (ICENTE’17) Special Issue 2018 (ICENTE'17)
relevant institutions should plan a significant increase in the future power plant capacity [3].
In order to estimate China's energy demand from the countries with the highest energy consumption and to examine the dynamic nature of electricity consumption, a statistical power consumption model from 1980 to 2012 was developed. It was developed using the model Intelligent Swarm Firefly algorithm [4].
Many other similar works have been proposed either in the past [5–9] or more recently [10–14].
In this study, models were developed to predict demand for electricity in the DAM using artificial neural networks (ANN). Different architectures have been tried to achieve the most optimal prediction in the developed models.
2. Materials and Methods
2.1. Artificial Neural Networks
Artificial neural networks can collect information about samples, make generalizations, and then decide on those samples using information they have learned in comparison with samples they have never seen before. The goal of an ANN is to compute between output and input values with some internal calculations [15]. The first computational model of artificial neural networks was based on 1943 by W.S. McCulloch ve W.A. Pitts [16]. ANN is widely used in various fields such as prediction [17], control systems [18], classification [19], optimization [20] and decision making [21]. ANNs are a parallel distribution processing method in which neurons and weights linked to neurons are put together. The relationship between the input and output can be learned, simply based on the basic principle of operation. A multilayer sensor (MLP) is one of the best-known types of ANNs consisting of an input layer, an output layer, and one or more hidden layers [22].
There are activation functions defined between layers. The most common ones are given in Table 1.
Selçuk-Teknik Dergisi ISSN 1302-6178 Journal of Selcuk-Technic
Özel Sayı 2018 (ICENTE’17) Special Issue 2018 (ICENTE'17)
Table 1: Transfer functions common used in algorithms
Transfer function Algorithm
Tansig tansig(n) = 2(1 + exp (-2n)) – 1
Purelin purelin(n) = n, for all n
Logsig logsig(n) = 1(1 + exp (-n))
Also there are many different types of training algorithms. One of the most common training algorithms is Feed Forward Back Propagation algorithm (FFBP) [23].
2.2. Data Collection
The data were obtained from TETAS web page [24]. TETAŞ, which was established as the first and only public wholesale company of Turkey with the split of Turkish Electricity Generation and Transmission Company (TEAS) in 2001 as part of the liberalization activities in the energy sector, is an Economic State Entity limited to the responsibility of the State and is in compliance with the general energy and economy policy of the State electricity trading and contracting activities. 120 data were taken from the TETAŞ web page.
DAM (Day Ahead Market), MCP (Market Clearing Price), DBA (Distribution Bilateral Agreement) and RBA (Retail Bilateral Agreement) were used as input data. The owning cost is considered as output data for each model. The statistics belong the data are given table 2.
Table 2. The ranges of data set and their statistic
Parameters Data Statistic
Ranges Mean ± S.D. Unit
Input Layer MCP 10,1 - 227,2 149,6 ± 52,53 Lira DAM 302,8 - 647,8 450,6 ± 77,01 DBA 4,0 - 248,0 116,5 ± 41,13 MWh RBA 150,0 – 386,0 271,3 ± 54,20 MWh Output Layer O. Cost -12636,9-52258,2 13051,7 ± 14421,7 Lira
This data was used as 100 training data and the remaining 20 pieces were used for testing purposes. RBA, the amount of energy received from the TETAŞ for the retail
Selçuk-Teknik Dergisi ISSN 1302-6178 Journal of Selcuk-Technic
Özel Sayı 2018 (ICENTE’17) Special Issue 2018 (ICENTE'17)
company, DBA, the amount of energy received from the TETAŞ is estimated, and the estimate of the DAM is the estimate for the day. Depending on the structure of the energy market, companies can buy from the market in several different ways. As stated earlier, the prices in the liberalizing market and the electricity market are determined by hourly supply and demand amounts. The MCP shown in our data set shows the actual hourly prices, which are based on the supply and demand balance.
And in order to obtain convergence within a reasonable number of cycles, the input and output data should be usually normalized. Normalization method as follows:
[1]
where is the normalized value, x is the original data, xmax and xmin, respectively, is the maximum and minimum values, thus the scaled data ranging between 0,1 and 0,9. 2.3. Network Properties
Neural network based modeling were performed using MATLAB. 24 different models were developed to find the architect who made the most optimal prediction. The network properties used in these models are as follows:
Network type: Feed-Forward Back-Propagation. Training function: TRAINLM.
Adaption learning function: LEARNGDM. Performance function: MSE.
Number of hidden layers: 1,2. Number of Neurons: 1-14
Input Layer Transfer function: logsig, purelin and tansig Output Layer Transfer function: purelin
Iterations numbers : 1000
The mean square error (MSE) was applied as the error function calculated from the following equation [25]:
Selçuk-Teknik Dergisi ISSN 1302-6178 Journal of Selcuk-Technic
Özel Sayı 2018 (ICENTE’17) Special Issue 2018 (ICENTE'17)
RMSE= [2]
[3]
MAE= [4]
where n is the number of data points, is the network prediction,
is the experimental response and i is an index of the data. yi is the measurement,
ŷi is the true value.
3. Result and Discussion
In this study, ANN models were developed to estimate the imbalance loss caused by the electricity demand forecast deviation of energy market suppliers. Levenberg-Marquardt (TrainLM) backpropagation algorithm, Hyperbolic tangent sigmoid (TansiG), Log sigmoid (sigmoid) and Linear (Purelin) functions are used as transfer functions in hidden layer and output layer in ANN models. In addition, 1 or 2 hidden layers were used in each model and the training process of the model was performed using 1000 iterations. The number of neurons in the hidden layer was varied from 1-14, and the predictive value of each model was measured by MSE. The most optimal number of neurons is 14, the number of hidden layers is 1, and the learning function is trainlm. The regression values for the most optimal ANN model are shown in Fig 1.
Statistical information showing the performance of the developed ANN model is summarized in Table 2. The correlation coefficient values obtained from the ANN model for the training and test data set were found to be 0.96 and 0.78, respectively.
Selçuk-Teknik Dergisi ISSN 1302-6178 Journal of Selcuk-Technic
Özel Sayı 2018 (ICENTE’17) Special Issue 2018 (ICENTE'17)
Figure 1. Optimum Network Regression Table 2: Statistical information of optimum ANN model Optimum Structure Statistic Value Train Test 4-1(14)-1
RMSE MAE R RMSE MAE R
0,080 0,032 0,976 0,105 0,079 0,952
The accuracy of the improved ANN model is proved by the low low RMSE and high correlation coefficient values for the test data set.
The results show that the ANN algorithm identifies the relation between input and output variables in a meaningful way and that the output variable can be estimated with high accuracy.
Selçuk-Teknik Dergisi ISSN 1302-6178 Journal of Selcuk-Technic
Özel Sayı 2018 (ICENTE’17) Special Issue 2018 (ICENTE'17)
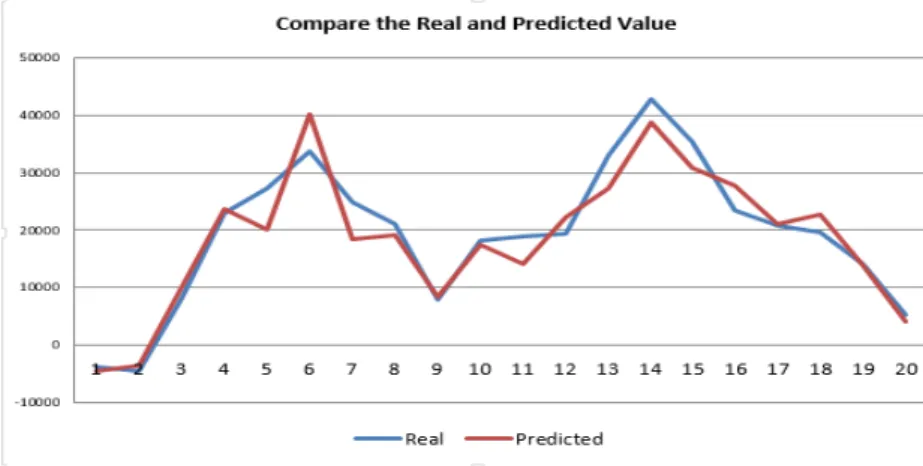
Figure 2. Compare the real and predicted value
4. Conclusion
Artificial Neural Networks (ANN) are used successfully in modeling the problem by learning the complex relationship between input and output data in the best way. In this study, ANN models were developed to estimate the imbalance loss caused by the electricity demand forecast deviation of energy market suppliers. For this purpose, 120 different data sets obtained from the TETAŞ web page were used in the development of the ANN model. Levenberg-Marquardt backpropagation algorithm is used as a learning algorithm in the ANN models developed to estimate the imbalance loss caused by demand forecast deviation, and tansig, sigmoid, purelin function is used as an activation function in the hidden layer and output layer.
In addition, it was determined that the statistical comparison of the estimated values obtained from the established ANN models with the measurement results is the structure of the network architecture (4-1(14)-1) that best predicts the resultant R%, RMSE and MAE both traing and test study.
In the results obtained from the developed model, it was seen that the best ANN model defined the relationship between the input and output variables in the data set very well and predicted the output variables at high accuracy. This has shown that ANN can be used as a successful tool in predicting the imbalance loss caused by energy market suppliers' deviation of electricity demand forecasts.
References
[1] D. Akay and M. Atak, “Grey prediction with rolling mechanism for electricity
demand forecasting of Turkey,” Energy, vol. 32(9), pp. 1670-1675, 2007.
[2] T. Yalçinöz S. Herdem, and U. Eminoğlu, “Yapay sinir ağlari ile niğde bölgesinin
elektrik yük tahmini,” ELECO 2002,pp. 25-29.
[3] K. Kavaklioglu, “Modeling and prediction of Turkey’s electricity consumption
Selçuk-Teknik Dergisi ISSN 1302-6178 Journal of Selcuk-Technic
Özel Sayı 2018 (ICENTE’17) Special Issue 2018 (ICENTE'17)
[4] G. Zhang, Y. Chen, Y. Yu, and S. Wu, “Intelligent Swarm Firefly Algorithm for the
Prediction of China’s National Electricity Consumption,” International Journal of
Bio-Inspired Computing, (In Press), 2017.
[5] W.W. Chan, and J.C. Lam, “Prediction of pollutant emission through electricity
consumption by the hotel industry in Hong Kong,” International Journal of
Hospitality Management, vol. 21(4), pp. 381-391, 2002.
[6] O. Landsiedel, K. Wehrle, and S. Gotz, “Accurate prediction of power consumption
in sensor networks,” In Embedded Networked Sensors, 2005, EmNetS-II. The
Second IEEE Workshop, pp. 37-44, May 2005.
[7] G. Altinay, and E. Karagol, “Electricity consumption and economic growth:
evidence from Turkey,” Energy Economics, vol. 27(6), pp. 849-856, 2005.
[8] A. Lendasse, J. Lee, V. Wertz, and M. Verleysen, “Forecasting electricity
consumption using nonlinear projection and self-organizing maps,” Neurocomputing, vol. 48(1), pp. 299-311, 2002.
[9] Y. Xu, and W. C. Lee, “On localized prediction for power efficient object tracking
in sensor networks,” In Distributed Computing Systems Workshops, 2003,
Proceedings. 23rd International Conference, pp. 434-439), IEEE, May, 2003.
[10] H. Kaur, and S.Ahuja, “Time Series Analysis and Prediction of Electricity
Consumption of Health Care Institution Using ARIMA Model,” In Proceedings of
Sixth International Conference on Soft Computing for Problem Solving, pp.
347-358, Springer, Singapore, 2017.
[11] R. R Rathod, and R.D.Garg, “Regional electricity consumption analysis for consumers using data mining techniques and consumer meter reading
data,” International Journal of Electrical Power & Energy Systems, vol. 78, 368-374, 2016.
[12] K. Chen, and K. Chen, “Modeling the Annual Growth Rate of Electricity
Consumption of China in the 21st Century: Trends and Prediction,” arXiv preprint arXiv:1710.07763, 2017.
Selçuk-Teknik Dergisi ISSN 1302-6178 Journal of Selcuk-Technic
Özel Sayı 2018 (ICENTE’17) Special Issue 2018 (ICENTE'17)
[13] B. Dong, Z. Li, S.M. Rahman, and R. Vega, “A hybrid model approach for
forecasting future residential electricity consumption,” Energy and Buildings, vol. 117, pp. 341-351, 2016.
[14] S. Fong, M. Yuen, R.K. Wong, W. Song, and K. Cho, “Real-Time Stream Mining Electric Power Consumption Data Using Hoeffding Tree with Shadow Features,” In Advanced Data Mining and Applications: 12th International Conference, ADMA 2016, Gold Coast, QLD, Australia, Proceedings vol. 12,(pp. 775-787, Springer International Publishing, December, 2016.
[15] V.N. Delgrange, N. Cabassud, M. Cabassud, L. Durand-Bourlier, and J.M. Laine, “Neural networks for prediction of ultrafiltration transmembrane pressure:
application to drinking water production,” Journal of Membrane Science vol. 150, pp. 111–123, 1998.
[16] W S McCulloch and W A Pitts, “A logical calculus of the ideas immanent in nervous Activity”, Bulletin of Mathematics & Biophysics, Vol.943, Issue.5, 115-133, 1943.
[17] D.T. Bui, T.A. Tuan, H. Klempe, B. Pradhan, and I. Revhaug, “Spatial prediction models for shallow landslide hazards: a comparative assessment of the efficacy of support vector machines, artificial neural networks, kernel logistic regression, and logistic model tree,” Landslides, vol. 13(2), pp. 361-378, 2016.
[18] J. Ahn, S. Cho, and D.H. Chung, “Analysis of energy and control efficiencies of fuzzy logic and artificial neural network technologies in the heating energy supply system responding to the changes of user demands,” Applied Energy, vol. 190, pp. 222-231, 2017.
[19] S. Raith, E.P. Vogel, N. Anees, C. Keul, J.F. Güth, D. Edelhoff, and H. Fischer, “Artificial Neural Networks as a powerful numerical tool to classify specific
features of a tooth based on 3D scan data,” Computers in biology and medicine, vol. 80, pp. 65-76, 2017.
[20] A.H. Sebayang, H.H. Masjuki, H. C. Ong, S. Dharma, A.S. Silitonga, F. Kusumo, and J. Milano, “Optimization of bioethanol production from sorghum grains using
Selçuk-Teknik Dergisi ISSN 1302-6178 Journal of Selcuk-Technic
Özel Sayı 2018 (ICENTE’17) Special Issue 2018 (ICENTE'17)
artificial neural networks integrated with ant colony,” Industrial Crops and Products,” vol. 97, pp. 146-155, 2017.
[21] E. B. Beşikçi, O. Arslan, O. Turan, and A.I. Ölçer, “An artificial neural network based decision support system for energy efficient ship operations,” Computers & Operations Research,” vol. 66, pp. 393-401, 2016.
[22] A. M. Ghaedi, And A.Vafaei, “Applications of artificial neural networks for
adsorption removal of dyes from aqueous solution: A review,” Advances in Colloid and Interface Science, vol. 245, pp.20-39, 2017.
[23] H. Demuth, M. Beale, and M. Hagan, “Neural Network Toolbox 5: Users Guide” Natick, MA, The MathWorks Inc., 2007.
[24] www.tetas.gov.tr
[25] M. Khajeh, and K. Dastafkan, “Removal of molybdenum using silver nanoparticles from water samples: Particle swarm optimization–artificial neural network,” Journal of Industrial and Engineering Chemistry, vol. 20(5), pp. 3014-3018, 2014.
[26] A. Witek-Krowiak, K. Chojnacka, D. Podstawczyk, A. Dawiec, and K. Pokomeda, “Application of response surface methodology and artificial neural network methods in modelling and optimization of biosorption process,” Bioresource Technology, vol. 160, pp. 150-160, 2014.