Contents lists available atScienceDirect
LWT - Food Science and Technology
journal homepage:www.elsevier.com/locate/lwtEffect of various forms of non-thermal treatment of the quality and safety in
carrots
G. Akdemir Evrendilek
a,b,∗, P. Ozdemir
aaDepartment of Food Engineering, Faculty of Engineering, Bolu Abant Izzet Baysal University, Golkoy Campus, 14280, Bolu, Turkey bDepartment of Food Engineering, Faculty of Engineering Ardahan University, 75002, Ardahan, Turkey
A R T I C L E I N F O Keywords:
Carrot Ozone
High pressure processing Ultrasonication Alkaline ionized water Surface disinfection
A B S T R A C T
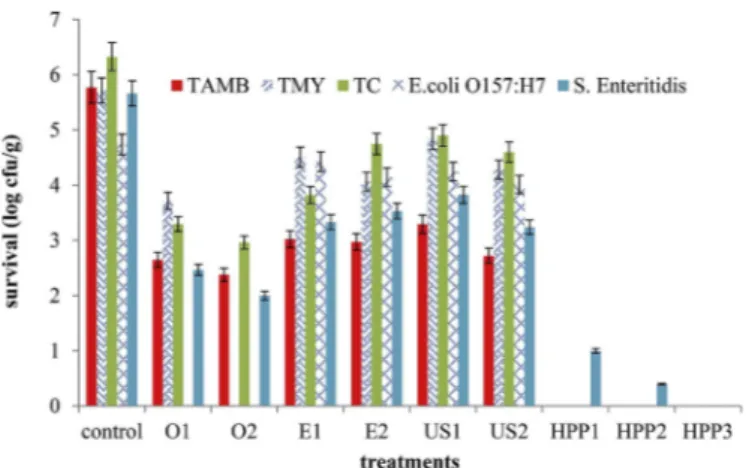
Fresh carrots were processed using ozone, ultrasonication, alkaline ionized water, and high pressure processing (HPP) as well as quantifying their effects on 28 food quality and safety responses. Out of the four treatments, HPP at 350 and 450 MPa for 5 min achieved the highest reductions by 5.8, 5.7, 6.3, 4.7 and 5.7 log cfu mL−1in
total mesophilic aerobic bacteria, total mold and yeast, total coliform, Escherichia coli O157:H7, and Salmonella Enteritidis, respectively. No downgrading changes as a function of the treatments were observed in pH,oBrix,
titratable acidity, conductivity, color values, total antioxidant capacity, organic acids, phenolic compounds, and α and β carotenes. The most pronounced textural changes occurred with HPP. Joint optimization of 25 food quality and safety responses pointed to ozone (8.2 g m−3) and HPP (450 MPa) for 5 min as the most effective
treatments, respectively.
1. Introduction
Since fresh-cut products are not subjected to processing such as blanching, freezing, canning, or heating, they are frequently involved in foodborne disease outbreaks. The growing interest to reduce or elim-inate their microbial load has led to the application of various sanitizing agents such as free chlorine (HOCl/OCl−), and hydrogen peroxide to
ensure their food safety (Koide, Shitanda, Note, & Cao, 2011; Petri, Rodríguez, & García, 2015). However, these applications have rendered some pathogens more resistant, thus limiting their efficacy (Allende, Selma, López-Gálvez, Villaescusa, & Gil, 2008;Petri et al., 2015). The inactivation of chlorine by organic materials can also form potentially carcinogenic and teratogenic trihalomethanes and haloacetic acids (Koide et al., 2011). Residues of sanitizing agents were shown to ad-versely affect food quality and safety (Birmpa, Sfika, & Vantarakis, 2013).
Ozone (O3) owing to its high reactivity, penetrability and
sponta-neous decomposition to nontoxic products (i.e., O2) is a viable
disin-fectant to ensure the microbiological safety of food products. Ozone has been used and recognized as a safe agent (GRAS) for decades by many countries thanks to its better antimicrobial properties than chlorine (Kim, Yousef, & Khadre, 2003). Relatively low O3concentrations in the
gaseous or aqueous phases are effective against the majority of micro-organisms, and even a short contact time is sufficient to inactivate
bacteria, molds, yeasts, parasites, and viruses (Kim et al., 2003). Power ultrasound (US) with a frequency of 20 kHz or more is defined as pressure waves. Intracellular cavitations cause chemical and physical changes in biological structures in a liquid medium (Butz & Tauscher, 2002). US induces the microbial inactivation through the breakage of cell walls, the disruption and thinning of cell membranes, and DNA damage via free radical production (Hulsmans et al., 2010).
Alkaline ionized water (AIW) is obtained by electrolysis of water and characterized as the strongly alkaline ionized water with pH > 12. Water is supplied to a cathode cell of an electrolytic bath where alkaline ionized water is produced. A repeated application of electrolytic voltage splits water molecules into hydrogen and hydroxide ions, with an electric current on a cation causing the accumulation of ions to increase pH. This approach is mostly used in the treatment of diseases (Koufnam & Johnston, 2012), in the control over body weight of rats (food and water intake in lactation periods) (Watanabe, 1995), against dental erosion and tooth decay (Wright, 2015), and in the disinfection of hard surfaces and radiology equipment (Pintaric, Matela, & Pintaric, 2015). High pressure processing (HPP) has been demonstrated to produce high-quality foods that exhibit the characteristics of microbiologically safe fresh products and an extended shelf-life (Hogan, Kelly, & Sun, 2005;Patterson, 2005). HPP has been also used for the pasteurization of food, and the extraction of bioactive compounds from plant tissue (Hogan, Kelly, & Sun, 2005). Different chemicals or treatments such as
https://doi.org/10.1016/j.lwt.2019.02.031
Received 30 October 2018; Received in revised form 23 January 2019; Accepted 10 February 2019
∗Corresponding author. Department of Food Engineering, Faculty of Engineering, Bolu Abant Izzet Baysal University, Golkoy Campus, 14280, Bolu, Turkey. E-mail address:[email protected](G.A. Evrendilek).
Available online 12 February 2019
0023-6438/ © 2019 Published by Elsevier Ltd.
chlorine, citric acid, ultraviolet light (UV-C), US, and O3have been
tested to disinfect the surfaces of vegetables, fruits, and fresh-cut pro-duces (Bermúdez-Aguirre & Barbosa-Cánovas, 2013; Birmpa et al., 2013).
Therefore, there exists a knowledge gap about the efficacy of non-thermal methods to reduce pathogens, and thus, to ensure food safety and quality (Birmpa et al., 2013;Bermúdez-Aguirre & Barbosa-Cánovas, 2013). To the best of our knowledge, there exists no information con-cerning the effects of AIW on both quality parameters and the disin-fection of food surfaces. The use of HPP in the disindisin-fection of product surfaces with roughness still remains to be explored. Also, there are a few studies about surface disinfection by O3, and US. Therefore, the
objectives of this study were to (1) quantify the surface disinfection efficacy of the four non-thermal treatments (HPP, O3, US, and AIW) for
fresh carrots, (2) compare effects on food quality and safety responses, and (3) determine the optimal treatment as a result of the joint opti-mization of multiple responses.
2. Materials and methods
2.1. Carrot samples
Nantes-type carrot samples (Daucus carota L.) were obtained from a local producer in Ankara (Turkey) and classified in terms of their size before their processing. 200 g of carrot samples of uniform size were immersed in 300 mL water for each process, removed from water after each process and analyzed immediately.
2.2. Bacterial cultures
Escherichia coli O157:H7 (ATCC 35218) and Salmonella Enteritidis
(OSU 799) cultures were obtained from the culture collection of the Department of Microbiology of the Ohio State University (Columbus, OH). The cultures were activated with their transfer from tryptic soy agar (TSA) slants into TSA broth followed by incubation at 35 ± 2 °C overnight. Grown cells of E. coli O157:H7 and S. Enteritidis were placed into sterile tubes separately and centrifuged at 2500 rpm for 15 min. Following the centrifugal process, the supernatants of the liquids were removed. The resulting pellets in the tubes were resuspended with 10 mL pre-sterilized phosphate buffered saline (PBS, pH 7.2). After the resuspension of the cells in PBS several times to remove TSA broth, viable bacterial concentrations were determined using a 10-fold serial dilution of 0.1 mL aliquot on a tryptic soya agar plate (TSA) (Fluka, Germany). This step was followed by incubation at 35 ± 2 °C for 24 h. The final bacterial concentrations for both were inoculated into the carrot samples suspended in water adjusted at the level of 106 to
107cfu mL−1.
2.3. Non-thermal treatments 2.3.1. Ozone treatment
A bench-scale O3generator (Yeojen, Ankara, Turkey) was used to
process the carrot samples. This generator uses a corona-discharge technology to produce O3gas. The two O3 treatments were applied
using the same dose of 8.2 g m−3but the two durations of 5 min (O1)
and 15 min (O2). Applied O3dose was measured using a dissolved O3
analyzer (ATI's model Q45H/64, Analytical Technology, Inc., Collegeville, PA, USA) with the accuracy of ± 0.02 ppm.
2.3.2. High pressure processing
A bench-scale HPP equipment with a 2-L capacity (Avure, Middletown, OH, USA) was used to process the samples. The samples were placed into flexible pouches made from a multilayer polymer/ aluminum/polymer film (polyethylene–aluminum–polypropylene) and heat-sealed before processing. The HPP treatments were carried out for 250 MPa (HPP1), 350 MPa (HPP2) and 450 MPa (HPP3) for 5 min at
room temperature. With the increased pressure up to 450 MPa, the maximum treatment temperature increased to 29 °C.
2.3.3. Alkaline ionized water
A bench-scale alkaline ionized water (AIW) system (Lydia 8090 model, EOS, Golden Bay, New Zealand) was used to process the carrot samples. The system uses tap water and supplies AIW in the pH and temperature ranges of 2.5–12 and 5 and 40 °C, respectively, with a continuous electrolysis mode. The two levels of the treatment were applied by immersing the samples into 300 mL AIW at pH 10 (AIW1) and 8.5 (AIW2) for 15 min at room temperature.
2.3.4. Ultrasonication
The US treatments with the two levels were conducted using a so-nicator (Wise Clean brand, WUC-D10H model) with the power 160/ 640 W and 35 kHz frequency. The two levels used to sonicate the samples were 5 min (US1) and 15 min (US2) at room temperature.
2.4. Physical properties
Five physical properties were measured after the samples of the control and treatment groups were grinded. Resultant carrot juice was measured for pH,oBrix, titratable acidity (TA), conductivity and color.
pH was measured using five mL of carrot juice at room temperature (Orion perpHectlogR meter, Inolab WTW, Germany). A hand-held re-fractometer (507-1 model Nippon Optical Works Co. Ltd, Japan) was used to measure °Brix. Conductivity (mS cm−1) was measured at room
temperature using a handheld conductivity meter (Sension 5 model, HACH, CO, USA). Five mL of the samples were titrated against stan-dardized 0.1 N NaOH after the addition of 0.5 mL phenolphthalein until their pH reached 8.1. Titratable acidity was calculated as mg L−1citric
acid. The three color parameters (L*, a*, and b*) were measured using a spectrophotometer (Hunter Color Flex, Hunter Associates Laboratory Inc., Reston VA, USA) based on the CIELAB color scale at D65/10°. Chroma ( =C (a 2+b 2), hue angle (
(
h =arctan( )
b)
a
0 , total
color difference ( E = (L0 L)2+ (a0 a)2+(b0 b) )2 , and browning index
(
BI=100(x0.170.31)where x=5.645La ++a1.74L3.012b)
were calculated from CIE a* and b* using illuminant D65and a 10° observerangle.
2.5. Total antioxidant capacity and total phenolic compounds
Total antioxidant capacity (TAC) after centrifugation was de-termined with the DPPH (2,2-diphenyl-1-picryl-hydrazyl-hydrate) free radical method described by Moon and Terao (1998). Similarly, the concentration of total phenolic compounds (TPC) was determined using the Folin-Ciocalteu method at 720 nm (Abdullakasim et al., 2007). A standard curve was prepared using 50, 100, 200, 300 and 400 mg gallic acid L−1stock solution.
2.6. Organic acids
Ten g of homogenously dried carrot samples were rehydrated in 90 mL distilled water and kept overnight at 4 °C. The samples were homogenized with ultra turrax (T18 Model digital, IKA, China) for 5 min at 10000 rpm at end of the rehydration period and filtered through a 0.45 μm PTFE filter (Micron Separations Inc., Westboro, MA, USA). They were injected into a high-performance liquid chromato-graphy (HPLC) system (Shimadzu LC-10AT VP model, Kyoto, Japan) equipped with manual injection port and a SPD-M20A Prominence Diode Array Detector (DAD) (Shimadzu, Kyoto, Japan).
A method described byPathy (2018) was followed to determine ascorbic acid content. Five mL of the sample filtrate and 5 mL m-phosphoric acid were mixed, and after centrifugation at 6500×g at 4 °C for 10 min, a 0.5 mL of supernatant was taken and completed to 10 mL
with m-phosphoric acid. The sample was filtrated by passing through a 0.45-μm PTFE filter (Micron Separations Inc., Westboro, MA, USA). 10 μL of the sample was injected automatically into the Inertsil ODS-4 C18 column (5 μm particle size, 4.6 mm diameter, 250 mm length, Agilent Technologies, Cheshire, UK) fitted with C18 guard column (Agilent Technologies, Cheshire, UK) at 25 °C and eluted with 2% KH2PO4(pH of 2.4) isocratically (1 mL min−1). Samples were eluted for
15 min and the peaks were identified at 244 nm. A standard calibration curve was obtained using l-ascorbic acid (Sigma Chemical Co., Stock-holm, Sweden) in concentrations ranging from 5 to 80 mg 100 mL−1.
Concentrations of tartaric, malic, citric, succinic and fumaric acids (mg L−1) were determined with the method developed by Sturm,
Koron, and Stampar (2003). Samples were diluted at 1:4 ratio, and supernatant was collected after centrifugation at 4 °C 4000 rpm for 10 min. Twenty μL of each extract filtrated through a 0.45-μm PTFE filter injected to HPLC equipped with Inertsil ODS-4 column fitted with C18 guard column at 50 °C. Five mM H2SO4at isocratic flow was used
as the mobile phase. The samples were eluted for 15 min. Peaks were determined with a PDA detector and corresponding areas were calcu-lated at 210 and 244 nm, respectively. A standard calibration curve for each organic acid was obtained using their standards (Sigma Chemical Co., Stockholm, Sweden) in concentrations ranging from 0.5 to 50 ppm.
2.7. Individual phenolic compounds
The extraction of phenolic compounds was based on the method developed by Justesen, Knuthsen, and Leth (1998). Five mL of rehy-drated and filtered samples were mixed with 10 mL of 80% methanol and kept in the ultrasound water bath for 10 min at room temperature before centrifugation at 4000 rpm at 4 °C for 10 min. Supernatants were collected and filtrated using a 0.45-μm PTFE filter. Twenty μL of the filtrate were injected to the HPLC equipped with Inertsil ODS-4C18 column fitted with C18 guard column. Gradient flow with 2% formic acid (A) and 100% acetonitrile (B) was applied at the flow rate of 0.8 mL min−1at the column temperature of 30 °C, respectively. PDA
detector at 280 nm for gallic acid, (+) catechin, (−)-epicatechin and 320 nm for caffeic, chlorogenic and para-cumaric acid were used. A standard calibration curve for each organic acid was obtained using their standards (Sigma Chemical Co., Stockholm, Sweden) in con-centrations ranging from 0.5 to 25 ppm.
2.8. Carotenoid compounds
The extraction of both α- and β-carotenoid was performed ac-cording to Meléndez-Martínez, Britton, Vicario, and Hederia (2005) with the saponification steps to remove chlorophylls and lipids that affect analysis adversely (Rodriguez-Amaya, 1999, p. 59). Five mL of the samples were mixed with 25 mL extraction solution formed by hexane:acetone:methanol (50:25:25, 0.1% BHT) in 50 mL falcon tubes. The tubes were centrifuged with 4000 rpm at 4 °C for 10 min. Super-natant was collected and washed with distilled water four times, and water was discarded before mixing with 15 mL KOH (10%, in ethanol). Tubes were settled in a fume hood in nitrogen gas for 1 h, and sapo-nification process was terminated with 10% NaCl solution (10 mL). The mixture was washed with 15 mL distilled water four times and hexane was evaporated in rotary evaporator (Buchi, Germany). Residue was disintegrated in acetone:methanol (1:2, 0.1% BHT) mixture and fil-trated through a 0.45-μm PTFE filter. Filfil-trated sample was injected automatically to the HPLC equipped with Inertsil ODS-2 (5 μm, 4.6 × 150 mm) column at 20 °C. Methanol (A), methyl-tert-butyl-ether (MTBE, B) and water (C) were used as the mobile phase with gradient programme. Flow rate of 1 mL min−1and injection volume of 50 μL
were used for the samples eluted for 65 min, and the peaks were de-termined at 450 nm.
2.9. Texture analyses
Cylinder samples (12 mm diameter and 10 mm height) of carrots were taken from both core and cortex using a stainless steel cork borer. Texture measurements were performed on three carrots from each sample with a TAXT2 texture analyzer (Stable Micro Systems, Surrey, England), using a 30 kg load cell. Texture profile analysis was con-ducted using P/100; 100 mm cylindrical probe, 200 pps acquisition rate, 2 mm s−1test speed, 10 mm s−1return speed, and 16 mm return
distance with 1 contact force. Cutting test was performed with A/ECB; Extended Craft Knife, 200 pps acquisition rate, 1.5 mm s−1test speed,
10 mm s−1return speed and 150 s test duration.
2.10. Microbial inactivation
Total aerobic mesophilic bacteria (TAMB), total mold and yeast (TMY), and total coliform bacteria (TCB) were counted as the initial microflora of carrots. Appropriate dilutions of both control and treat-ment groups were plated on plate count agar (PCA) for TAMB, potato dextrose (PDA) agar acidified with tartaric acid (10% w v−1) for TMY,
violet red bile agar (VRBA) for TCB, McConkey sorbitol agar (MCSA) for
E. coli O157:H7 and Xylose Lysine Deoxycholate (XLD) agar for S.
Enteritidis by spread plating, respectively. While PCA, VRBA, MCSA and XLD plates were incubated at 35 ± 2 °C for 24–48 h, the plates for TMY were incubated at 22 ± 2 °C for 5–7 days, respectively. Results of the plate counts were expressed in log cfu mL−1.
2.11. Statistical analyses
Statistical analyses were performed using Minitab 17.0 version (Minitab Inc., State College PA, USA). Tukey's multiple comparison tests following one-way analysis of variance (ANOVA) were performed to detect significant mean differences in physical properties, microbial inactivation and textural studies as a function of the treatments (P ≤ 0.05). Joint optimization of 25 responses was based on the best-fit simple linear regression models at P < 0.05 as a function of the treatment type. The treatment type was used as a categorical variable with nine levels (O1, O2, AIW 1, AIW2, US1, US2, HPP1, HPP2, and HPP3) and with O1 left out as the baseline in the models.
3. Results and discussion
3.1. Changes in food quality 3.1.1. Effects on physical properties
Out of a total of the 11 physical properties measured, all the four non-thermal treatments did not, on average, differ from the control group in terms ofoBrix, titratable acidity, conductivity, and browning
index (Table 1). Only the HPP treatment decreased the mean pH value relative to the control group (p < 0.05) but did not differ among its levels. All the treatments except for HPP1 and 3 significantly increased the initial mean L∗. Similarly, all the treatments except for AWI2
sig-nificantly increased the mean TCD value of the control group. The US2 treatment significantly increased a∗, b∗, and chroma and decreased hue
relative to the control groups. The HPP treatment decreased the initial mean hue, whereas the HPP3 increased the initial mean a∗(P ≤ 0.05)
(Table 1).
Processing of carrot washing with mildly heated and slightly acidic electrolyzed water (MH-SAEW) at 45 °C (23 mg L−1available chlorine
at pH 5.5), did not significantly affect hue, chroma, hardness, ascorbic acid, and β carotene (Koide et al., 2011). The atmospheric conditions of 2% O2, 5% CO2, 93% N2, 6 ± 1 °C, and 85% relative humidity were
found to decrease L∗ value of carrots (Chauhan, Raju, Ravi, Singh, & Bawa, 2011).
3.1.2. Effects on organic acids
Among the six organic acids (mg L−1) measured, the initial mean
ascorbic acid did not decrease significantly with any of the treatments, whereas all the treatments declined the initial mean succinic acid (P ≤ 0.05) (Table 2). The mean fumaric acid of the control group de-creased with all the treatments except for O2. Out of the nine treatment levels, only AIW2 decreased the initial mean malic acid. Similarly, only AIW and US1 decreased the initial mean citric acid, while only AIW2 and US2 decreased the initial mean tartaric acid (P < 0.05) (Table 2).
Significant reductions in ascorbic acid, carotenoids, and oxidative enzymes were reported due to ozonized water (1:2 w v−1; @ 200 mg O
3
h−1) for 10 min under the atmospheric conditions of 2% O
2, 5% CO2,
93% N2, 6 ± 1 °C, and 85% relative humidity (Chauhan et al., 2011).
According to Karaca and Velioglu (2014), distilled, ozonated (12 mg L−1) and chlorinated (100 mg L−1) water treatments of lettuce,
spinach, and parsley did not cause any detrimental effects on their chlorophyll-a and b, ascorbic acid, total phenolic content and anti-oxidant activity, whereas gaseous O3treatment (950 μL L−1for 20 min)
Table 1
Multiple comparisons of 11 physical properties of carrot samples in response to control and non-thermal treatment groups (n = 3).
Variable Treatment Mean SD dif Min Median Max Variable Treatment Mean SD dif Min Median Max
pH Control 6.33 0.06 a 6.29 6.32 6.43 TA (mg/L) Control 0.06 0.03 a 0.01 0.07 0.07 AIW1 6.32 0.13 a 6.24 6.29 6.56 AIW1 0.22 0.32 a 0.07 0.08 0.79 AIW2 6.41 0.15 a 6.31 6.34 6.69 AIW2 0.07 0.01 a 0.06 0.07 0.08 HPP1 5.95 0.02 b 5.94 5.94 5.99 HPP1 0.05 0.01 a 0.04 0.05 0.07 HPP2 5.99 0.00 b 5.99 6.00 6.00 HPP2 0.06 0.01 a 0.05 0.06 0.08 HPP3 5.95 0.03 b 5.93 5.94 5.99 HPP3 0.06 0.01 a 0.05 0.05 0.08 O1 6.37 0.23 a 6.22 6.23 6.73 O1 0.07 0.00 a 0.07 0.07 0.08 O2 6.40 0.17 a 6.22 6.37 6.68 O2 0.07 0.01 a 0.06 0.08 0.08 US1 6.43 0.09 a 6.33 6.48 6.50 US1 0.07 0.01 a 0.05 0.08 0.08 US2 6.46 0.03 a 6.43 6.46 6.50 US2 0.07 0.01 a 0.05 0.07 0.09 L* Control 36.90 0.77 b 36.43 36.60 38.25 a* Control 16.72 1.39 b 14.88 16.62 18.61 AIW1 45.61 1.95 a 42.65 45.66 47.60 AIW1 18.95 0.62 b 18.17 18.88 19.75 AIW1 43.65 2.89 a 40.22 42.53 46.84 AIW2 17.11 1.75 b 15.52 16.58 19.68 HPP1 41.33 1.51 ab 40.16 40.44 43.56 HPP1 24.15 6.09 ab 16.78 28.37 28.84 HPP2 43.32 5.28 a 39.35 39.56 49.23 HPP2 24.49 5.57 ab 18.34 28.51 28.60 HPP3 41.75 1.51 ab 40.54 41.01 44.23 HPP3 25.78 6.90 ab 18.22 30.69 30.95 O1 43.99 3.45 a 38.72 43.96 47.84 O1 19.36 6.31 ab 15.44 15.92 30.30 O2 45.14 2.47 a 41.06 46.40 47.24 O2 18.77 2.95 b 14.76 19.09 22.98 US1 45.01 2.47 a 41.25 44.86 47.87 US1 21.33 2.00 ab 19.81 20.30 24.37 US2 46.48 3.16 a 40.96 47.47 49.03 US2 28.65 5.87 a 18.14 31.34 31.36
b* Control 17.89 1.20 c 16.55 17.82 19.58 Hue Control 0.55 0.09 a 0.39 0.57 0.65
AIW1 22.11 0.72 bc 20.92 22.27 22.71 AIW1 0.43 0.04 abc 0.37 0.45 0.46
AIW2 20.81 1.20 bc 19.76 20.23 22.75 AIW2 0.37 0.11 abc 0.27 0.30 0.52
HPP1 32.79 11.60 abc 18.90 40.87 41.72 HPP1 0.26 0.18 c 0.12 0.13 0.48 HPP2 32.94 10.81 abc 20.12 40.81 40.82 HPP2 0.27 0.18 c 0.14 0.14 0.52 HPP3 34.36 12.05 ab 20.24 43.02 43.23 HPP3 0.28 0.15 bc 0.17 0.18 0.50 O1 24.83 10.11 abc 18.68 21.03 42.80 O1 0.32 0.15 abc 0.16 0.29 0.52 O2 21.99 2.33 bc 18.57 22.30 25.12 O2 0.41 0.07 abc 0.32 0.43 0.52 US1 23.03 1.15 bc 21.78 23.44 24.34 US1 0.53 0.15 ab 0.36 0.54 0.68 US2 39.29 8.80 a 23.61 42.74 44.53 US2 0.21 0.05 c 0.14 0.21 0.28
Chroma Control 24.50 1.65 b 23.22 23.46 27.01 TCD Control 1.28 0.98 c 0.25 0.81 2.42
AIW1 29.12 0.85 b 27.71 29.32 30.01 AIW1 4.18 0.37 ab 3.55 4.35 4.45 AIW2 26.96 1.86 b 25.50 26.76 30.08 AIW2 3.48 0.68 bc 2.99 3.03 4.45 HPP1 40.77 12.92 ab 25.27 49.75 50.72 HPP1 5.19 1.67 ab 3.18 6.35 6.47 HPP2 41.10 11.95 ab 27.29 49.79 49.83 HPP2 5.55 1.04 ab 4.32 6.30 6.31 HPP3 42.99 13.74 ab 27.23 52.85 53.13 HPP3 5.52 1.71 ab 3.39 6.72 6.79 O1 31.52 11.80 ab 24.51 26.92 52.44 O1 4.01 1.92 b 2.04 3.81 7.20 O2 28.92 3.68 b 23.72 29.36 34.05 O2 3.99 1.05 b 2.30 4.32 5.12 US1 31.43 1.58 ab 29.77 31.28 34.01 US1 4.49 0.41 ab 4.05 4.36 5.04 US2 48.63 10.55 a 29.77 53.00 54.28 US2 6.66 1.13 a 4.66 7.24 7.25
°Brix Control 7.54 1.30 a 6.00 7.00 8.90 BI Control 100.79 6.32 a 93.33 101.85 107.95
AIW1 7.40 0.84 a 6.10 7.90 8.00 AIW1 94.82 3.27 a 90.13 94.88 99.36 AIW2 7.72 1.26 a 6.20 8.50 8.70 AIW2 90.44 6.01 a 82.22 89.16 96.53 HPP1 9.00 0.00 a 9.00 9.00 9.00 HPP1 101.50 34.30 a 76.40 83.70 159.60 HPP2 7.88 0.04 a 7.80 7.90 7.90 HPP2 82.09 17.51 a 62.43 82.44 106.02 HPP3 8.00 0.00 a 8.00 8.00 8.00 HPP3 82.56 12.15 a 68.95 80.26 102.22 O1 7.60 0.89 a 6.00 8.00 8.00 O1 93.67 5.96 a 85.87 92.51 102.37 O2 7.20 1.10 a 6.00 8.00 8.00 O2 96.97 10.24 a 83.67 101.26 106.50 US1 7.70 1.43 a 5.50 8.60 8.70 US1 102.04 5.61 a 96.14 101.83 109.77 US2 7.24 1.04 a 6.00 8.00 8.00 US2 97.46 4.78 a 92.28 96.71 104.02
Conductivity (mS/cm) Control 5.55 0.01 abcd 5.53 5.55 5.57
AIW1 5.90 0.17 ab 5.77 5.78 6.08 AIW2 5.71 0.80 abc 4.53 6.26 6.27 HPP1 5.68 0.04 abc 5.62 5.68 5.72 HPP2 5.01 0.20 cd 4.83 5.00 5.34 HPP3 5.20 0.19 bcd 5.00 5.23 5.42 O1 5.67 0.61 abc 4.58 5.95 5.95 O2 5.80 0.32 abc 5.23 5.94 5.95 US1 6.12 0.54 a 5.22 6.29 6.65 US2 4.79 0.10 d 4.71 4.73 4.90
dif: Mean column values for each variable with a different letter are significantly different (P ≤ 0.05). TA: titratable acidity, BI: browning index, and TCD: total color difference.
downgraded the important bioactive compounds of parsley.
3.1.3. Effects on phenolic compounds
Out of the six phenolic compounds (mg L−1) measured, no
sig-nificant decrease was found in (−)-epicatechin, (+)-catechin, and para-cumaric acid of the control groups in response to all the treatments (Table 3). HPP2 and 3, US2, and AIW did not change the initial mean gallic acid, while HPP, AIW, O2, and US1 did not affect the initial mean caffeic acid. The mean chlorogenic acid of the control group did not change as a function of AIW2, O2, and US1.
No negative effects on the sensory attributes, and vitamin C and phenolic contents of lettuces were detected as a function of washing with aqueous chlorine dioxide (ClO2) and sodium hypochlorite (NaClO)
during 3-day storage at 4 °C followed by 7-day storage at 8 °C ( López-Gálvez et al., 2010). This finding suggests that aqueous chlorine dioxide is as effective as sodium hypochlorite for the sanitation of fresh-cut lettuces (López-Gálvez et al., 2010). Washing of uncut and shredded carrots with chlorinated and ozonated water, and their storage under (an)aerobic conditions induced phenylalanine ammonia-lyase (PAL) activity and resulted in the detection of trans and cis isomers of chlorogenic acid (∼95%) and three dicaffeoylquinic acid isomers of p-coumaroylquinic acid (∼5%) for the minimally processed carrots (Klaiber, Baur, Koblo, & Carle, 2005).
3.1.4. Effects on TAC, TPC, and α and β carotenes
No significance decrease was detected in TAC (%), and α and β carotenes (mg L−1), while no significant change was found in TPC (mg
GAE L−1) (Table 4). Aguiló-Aguayo, Gangopadhyay, Lyng, Brunton,
and Rai (2017)found pulsed light (PL) of 13.15 J cm−2to adversely
affect carrot slices but higher β-carotene, falcarindiol, falcarino, fal-carindiol-3-acetate and β-glucose concentrations with the fluences of 2.26 and 4.52 J cm−2than with the control. Chlorophyll, carotenoids,
and anthocyanin were reported not to differ in response to HPP at low
and moderate temperatures (Oey, Lille, Van Loey, & Hendrickx, 2008). Carrot carotene was rendered more stable under HPP than thermal procesing (Chen, Peng, & Chen, 1995; Nguyen, Rastogi, & Balasubramaniam, 2007). Immersion in tap water, chlorine water, ClO2
(2 mg L−1) and peroxyacetic acid (100 mg L−1) at 4 °C for 2 min in
combination with vacuum (10 mbar) or positive pressure application (3 bar) did not change the appearance and pH of shredded carrots (Petri et al., 2015).
3.1.5. Effects on textural properties
No significant change occurred in the initial mean firmness (N) with any of the treatments (Table 5). Only HPP reduced the initial mean work of shear (Ns), with the rest having no impact on it significantly. The textural properties of the carrot samples were most affected by the HPP treatment. Nguyen et al. (2010) processed carrot, zucchini, apricot, red radish, and jicama using pressure-assisted thermal proces-sing (PATP) at 600 MPa and 105 °C, HPP at 600 MPa and 25 °C, thermal processing (TP) at 0.1 MPa and 105 °C, and simultaneous PATP or se-quential HPP-TP treatment with elevated temperature (105 °C). TP and HPP-TP were found to perform worst and best at retaining texture, respectively, while PATP was better than TP in terms of texture and color retention (Nguyen et al., 2010). The HPP-TP treatment of fresh carrot tissues at 600 MPa and 80 °C was stated to lead to a textural preservation with negligible changes in softening and intercellular ad-hesion (De Roeck, Sila, Duvetter, Van Loey, & Hendrickx, 2008). Rastogi, Nguyen, and Balasubramaniam (2008)also reported a textural recovery in carrots during the pressure-holding stage of HPP-TP.
Hogan et al. (2005)concluded that the physical structure of high moisture food products did not change with HPP since it did not gen-erate enough shear forces. Color and textural properties of gas-con-taining products were reported to change due to gas displacement and liquid infiltration into the collapsed gas pockets from the surrounding. The HPP treatments at 200, 300 MPa for 5 min were found to lead to
Table 2
Multiple comparisons of six organic acids (mg L−1) of carrot samples in response to control and non-thermal treatment groups (n = 3).
Variable Treatment Mean SD dif Min Median Max Variable Treatment Mean SD dif Min Median Max
Fumaric acid Control 287.1 3.95 b 281.4 286.1 290.9 Ascorbic acid Control 1.09 0.03 c 1.05 1.09 1.12
AIW1 95.1 10.5 c 80.0 92.6 105.1 AIW1 1.13 0.04 c 1.07 1.12 1.17 AIW2 10.4 9.89 d 1.41 11.9 25.4 AIW2 0.64 0.05 c 0.59 0.66 0.72 HPP1 163.0 21.3 c 132.5 157.9 183.4 HPP1 1.94 1.01 b 0.49 1.70 2.90 HPP2 103.7 46.1 c 57.6 103.7 149.8 HPP2 2.77 0.02 a 2.76 2.77 2.79 HPP3 95.0 26.1 c 57.6 88.7 119.9 HPP3 3.05 0.18 a 2.79 3.00 3.21 O1 401.2 5.19 a 396.0 401.2 406.4 O1 0.86 0.37 c 0.49 0.86 1.24 O2 250.4 47.6 b 182.2 239.1 295.9 O2 1.20 0.005 bc 1.20 1.20 1.21 US1 122.8 82.5 c 4.50 103.1 201.7 US1 0.79 0.31 c 0.49 0.86 1.22 US2 4.46 3.02 d 1.57 5.18 8.79 US2 1.17 0.03 c 1.14 1.17 1.21
Malic acid Control 1203.4 11.5 a 1192.4 1206.2 1219.9 Citric acid Control 498.1 6.0 bc 489.5 496.7 503.8
AIW1 1237.0 14.8 a 1215.7 1233.5 1251.2 AIW1 330.2 86.5 d 247.5 350.8 454.2 AIW2 555.0 50.3 b 74.0 676.0 1277.0 AIW2 109.5 78.8 e 34.2 128.4 222.5 HPP1 1167.7 92.6 a 1079.2 1189.9 1300.6 HPP1 452.5 125.7 bcd 272.2 422.4 572.6 HPP2 1116.1 4.21 a 1111.9 1116.1 1120.3 HPP2 705.9 28.9 a 677.0 705.9 734.8 HPP3 1109.0 7.91 a 1101.4 1110.9 1120.3 HPP3 704.8 19.4 a 676.9 700.2 723.4 O1 983.2 3.55 a 979.6 983.2 986.7 O1 515.3 3.91 bc 511.3 515.3 519.2 O2 965.2 14.1 a 945.0 961.8 978.7 O2 404.8 121.3 cd 230.8 375.8 520.8 US1 1220.1 2.87 a 1216.0 1219.5 1222.9 US1 326.6 31.8 d 280.9 319.0 357.0 US2 1304.3 108.0 a 1149.3 1278.4 1407.5 US2 584.2 119.4 ab 412.9 555.6 698.4
Succinic acid Control 38.4 1.57 b 36.2 38.1 39.9 Tartaric acid Control 162.1 1.47 b 160.0 161.7 163.5
AIW1 23.7 4.81 c 16.8 22.5 28.3 AIW1 0.12 0.0001 c 0.12 0.12 0.12 AIW2 1.54 0.0001 d 1.54 1.54 1.54 AIW2 125.8 2.79 b 123.1 126.5 129.8 HPP1 1.54 0.0001 d 1.54 1.54 1.54 HPP1 396.9 50.6 a 348.5 409.0 469.4 HPP2 1.54 0.0001 d 1.54 1.54 1.54 HPP2 292.1 75.8 a 216.3 292.1 368.0 HPP3 1.54 0.0001 d 1.54 1.54 1.54 HPP3 356.7 7.84 a 349.2 358.5 367.9 O1 61.6 11.2 a 50.4 61.67 72.8 O1 297.3 132.6 a 164.7 297.3 429.9 O2 1.54 0.0001 d 1.54 1.54 1.54 O2 77.0 65.4 bc 14.5 92.7 170.9 US1 1.54 0.0001 d 1.54 1.54 1.54 US1 123.7 0.71 b 122.7 123.5 124.4 US2 1.54 0.0001 d 1.54 1.54 1.54 US2 0.12 0.0001 c 0.12 0.12 0.12
swollen glossy appearance similarly between the treatment and control groups which in turn demonstrated its non-damaging effect. The HPP treatments at 400 and 500 MPa for 5 min still resulted in intact carrot cells, but at 600 MPa changed the cellular structure, and the migration of some soluble components and led to the cell damage with the col-lapsed cells (Xu & Han, 2006). Ultrasound treatment for 10 min at 60 °C with the use of 0.5% CaCl2, and blanching for 40 min enhanced the
mechanical strength of retorted carrots (Day, Xu, Øiseth, & Mawson, 2012).
3.2. Changes in food safety
3.2.1. Effects on inactivation of endogenous microbial flora and pathogen bacteria
All the treatments achieved a significant reduction (log cfu mL−1) in
TAMB, TC, and S. Enteritidis (Fig. 1,Table 6). No significant reductions were provided in TMY by only US1 and in E. coli O157:H7 by only the AIW and US treatments. Overall, the HPP treatment was more effective in the inactivation of TAMB, TMY, TC, and S. Enteritidis than the other
Table 3
Multiple comparisons of six phenolic compounds (mg L−1) of carrot samples in response to control and non-thermal treatment groups (n = 3).
Variable Treatment Mean SD dif Min Median Max Variable Treatment Mean SD dif Min Median Max
(−)-epicatechin Control 0.20 0.06 c 0.16 0.16 0.27 (+)-catechin Control 0.31 0.01 b 0.30 0.31 0.31
AIW1 0.42 0.01 abc 0.41 0.42 0.42 AIW1 0.39 0.10 b 0.29 0.39 0.48
AIW2 0.23 0.002 bc 0.23 0.23 0.23 AIW2 0.42 0.06 b 0.37 0.42 0.48 HPP1 0.30 0.08 abc 0.23 0.30 0.38 HPP1 0.49 0.01 ab 0.48 0.49 0.50 HPP2 0.47 0.04 abc 0.43 0.47 0.51 HPP2 0.54 0.08 ab 0.46 0.54 0.62 HPP3 0.50 0.02 ab 0.47 0.50 0.52 HPP3 0.42 0.004 b 0.42 0.42 0.43 O1 0.54 0.37 a 0.18 0.54 0.91 O1 0.47 0.19 b 0.28 0.47 0.65 O2 0.33 0.06 abc 0.28 0.33 0.39 O2 0.74 0.11 a 0.63 0.74 0.86
US1 0.46 0.18 abc 0.28 0.46 0.63 US1 0.48 0.26 b 0.22 0.48 0.73
US2 0.39 0.01 abc 0.38 0.39 0.40 US2 0.35 0.12 b 0.17 0.32 0.47
Gallic acid Control 0.50 0.02 ab 0.48 0.48 0.52 Caffeic acid Control 0.53 0.06 a 0.49 0.49 0.60
AIW1 0.40 0.04 bcd 0.36 0.40 0.44 AIW1 0.54 0.02 a 0.52 0.54 0.56 AIW2 0.40 0.002 bcd 0.40 0.40 0.40 AIW2 0.51 0.01 ab 0.50 0.51 0.53 HPP1 0.33 0.07 d 0.25 0.33 0.40 HPP1 0.51 0.02 abc 0.48 0.51 0.53 HPP2 0.40 0.08 bcd 0.33 0.40 0.48 HPP2 0.48 0.02 abc 0.46 0.48 0.51 HPP3 0.47 0.02 bc 0.45 0.47 0.49 HPP3 0.48 0.01 abc 0.48 0.48 0.49 O1 0.30 0.04 d 0.26 0.30 0.34 O1 0.47 0.002 bc 0.47 0.47 0.47 O2 0.33 0.01 d 0.32 0.33 0.34 O2 0.48 0.01 abc 0.47 0.48 0.50
US1 0.38 0.09 cd 0.28 0.38 0.47 US1 0.50 0.03 abc 0.47 0.50 0.53
US2 0.60 0.05 a 0.52 0.59 0.65 US2 0.46 0.01 c 0.44 0.45 0.47
Chlorogenic acid Control 0.38 0.18 a 0.18 0.51 0.51 Para-cumaric acid Control 0.13 0.02 b 0.11 0.11 0.15
AIW1 0.27 0.11 ab 0.17 0.27 0.38 AIW1 0.11 0.004 b 0.11 0.11 0.12 AIW2 0.19 0.04 b 0.15 0.19 0.23 AIW2 0.12 0.01 b 0.11 0.12 0.13 HPP1 0.19 0.04 b 0.15 0.19 0.23 HPP1 0.12 0.002 b 0.11 0.12 0.12 HPP2 0.20 0.04 b 0.16 0.20 0.24 HPP2 0.12 0.01 b 0.11 0.12 0.12 HPP3 0.16 0.01 b 0.15 0.16 0.18 HPP3 0.13 0.01 b 0.11 0.13 0.14 O1 0.19 0.02 b 0.17 0.19 0.21 O1 0.14 0.01 b 0.13 0.14 0.15 O2 0.25 0.03 ab 0.22 0.25 0.29 O2 0.12 0.01 b 0.11 0.12 0.13 US1 0.24 0.01 ab 0.24 0.24 0.25 US1 0.16 0.05 ab 0.11 0.16 0.21 US2 0.22 0.04 b 0.16 0.21 0.25 US2 0.22 0.07 a 0.11 0.20 0.29
dif: Mean column values for each variable with a different letter are significantly different (P ≤ 0.05).
Table 4
Multiple comparisons of TAC (%), TPC (mg GAE L-1), α and β carotenes (mg L−1) of carrot samples in response to control and non-thermal treatment groups (n = 3).
Variable Treatment Mean SD dif Min Median Max Variable Treatment Mean SD dif Min Median Max
TAC Control 23.64 2.1 c 22.16 23.08 27.26 TPC Control 1.15 0.4 a 0.69 1.35 1.65
AIW1 64.39 5.3 ab 61.79 62.25 73.85 AIW1 1.09 0.4 a 0.69 1.32 1.37 AIW2 62.60 27.6 ab 42.30 42.80 92.90 AIW2 1.15 0.7 a 0.67 0.67 2.07 HPP1 68.70 24.8 ab 41.40 86.80 86.80 HPP1 0.59 0.02 a 0.56 0.60 0.60 HPP2 81.64 3.2 a 78.95 81.73 86.84 HPP2 0.58 0.04 a 0.56 0.57 0.65 HPP3 83.22 7.3 a 78.95 79.88 96.11 HPP3 0.63 0.04 a 0.60 0.60 0.69 O1 51.96 15.9 abc 28.86 60.86 64.57 O1 1.20 0.5 a 0.63 1.33 1.76 O2 53.35 10.3 abc 41.85 60.86 60.86 O2 1.12 0.4 a 0.68 1.33 1.55 US1 39.49 2.1 bc 37.00 39.32 41.85 US1 1.04 0.3 a 0.66 1.27 1.31
US2 52.60 32.7 abc 25.20 34.40 88.70 US2 0.63 0.03 a 0.57 0.63 0.65
α carotene Control 0.13 0.1 cd 0.05 0.13 0.20 β carotene Control 1.62 0.4 bc 1.20 1.62 2.03
AIW1 0.46 0.05 abc 0.41 0.50 0.50 AIW1 3.00 0.3 ab 2.70 3.20 3.20
AIW2 0.48 0.01 abc 0.47 0.48 0.49 AIW2 4.02 0.1 a 3.95 4.02 4.10
HPP1 0.07 0.0001 d 0.07 0.07 0.07 HPP1 0.83 0.4 c 0.07 1.02 1.03 HPP2 0.38 0.2 bcd 0.23 0.38 0.53 HPP2 2.95 1.1 ab 1.90 2.95 4.01 HPP3 0.77 0.2 a 0.58 0.77 0.96 HPP3 4.71 1.0 a 3.71 4.71 5.71 O1 0.51 0.4 ab 0.13 0.51 0.88 O1 3.53 1.9 ab 1.61 3.53 5.45 O2 0.35 0.1 bcd 0.25 0.35 0.45 O2 2.73 0.6 abc 2.17 2.73 3.30 US1 0.64 0.2 ab 0.47 0.64 0.81 US1 4.61 0.9 a 3.74 4.61 5.48 US2 0.36 0.2 bcd 0.15 0.36 0.57 US2 3.08 1.4 ab 1.72 3.08 4.45
treatments (P < 0.05). Both HPP and O3 treatments provided a com-plete inactivation of the initial E. coli O157:H7.
The reduction in the initial count of microbial load depends on microbial sensitivity to different treatments, treatment type, dose and exposure time, and physical properties of samples (Bermúdez-Aguirre & Barbosa-Cánovas, 2013; Birmpa et al., 2013;Petri et al., 2015). For example, high pressure carbon dioxide (HPCD) reduced the number of
E. coli inoculated in fresh-cut carrots by 7 log in 10 min at 12 MPa, in
25 min at 8 MPa at 26 °C, and in 6 min at 12 MPa at 35 °C (Ferrentino, Calliari, Bertucco, & Spilimbergo, 2014). HPCD with 12 MPa at 40 °C in 15 min inactivated the natural microbial flora of fresh-cut carrots, in-duced a four-week stability by preserving their bioactive compound content, antioxidant capacity, and enzyme stability but downgraded their texture and ascorbic acid by 90 and 40%, respectively (Spilimbergo, Komes, Vojvodic, Levaj, & Ferrentino, 2013). The HPCD treatment of fresh-cut carrot slices achieved 1.86 log cycle reduction for aerobic bacteria and 1.25 for yeasts and molds with 5 MPa at 20 °C for 20 min, with residuals of peroxidase, polyphenol oxidase, and pectin methyl esterase (Bi, Wu, Zhang, Xu, & Liao, 2011).
Aerosolized ClO2reduced the initial mean counts of E. coli O157:H7,
S. Typhimurium, and Listeria monocytogenes on washed carrots by 1.5,
1.5, and 1.3 log cfu g−1at 300 ppm, and 2.4, 2.3, and 2.1 log cfu g−1at
400 ppm for 30 min, respectively, but left ClO2residues ≤1 ppm (Cho,
Kim, Park, & Kim, 2017). High intensity pulsed white light-treated carrot slices (one pulse = 0.7 J cm−2) reduced the load of yeast cells
with up to 6 log cycles (Kaack & Lyager, 2007).
Bermúdez-Aguirre and Barbosa-Cánovas (2013)pointed out that the inactivation of microorganisms was affected by the porous surfaces of vegetables that allowed bacteria to be protected against the treatments. Lettuce, tomatoes, and carrots treated with chlorine (50, 100 and 200 ppm), citric acid (0.5, 1 and 1.5%), UV-C (0.65 and 1.6 mW cm−2),
and O3(5 ppm) revealed that, unlike citric acid, UV-C appeared to be
Table 5
Multiple comparisons of two textural properties of carrot samples in response to control and non-thermal treatment groups (n = 3).
Variable Treatment Mean SD dif Min Median Max Variable Treatment Mean SD dif Min Median Max
Firmness (N) Control 27.2 3.2 ab 24.0 27.2 30.4 Work of shear (Ns) Control 182.3 10.4 a 171.9 182.3 192.7
AIW1 26.4 6.1 ab 18.8 29.1 31.6 AIW1 170.9 41.2 ab 123.6 197.9 202.4 AIW2 27.3 3.3 ab 24.8 25.0 31.1 AIW2 179.5 10.0 ab 171.4 175.3 196.7 HPP1 19.9 2.7 b 17.2 19.9 22.6 HPP1 81.7 2.4 d 79.4 81.7 84.1 HPP2 31.1 2.0 a 29.1 31.1 33.2 HPP2 130.4 36.9 bcd 93.5 130.4 167.3 HPP3 25.1 0.3 ab 24.8 25.1 25.4 HPP3 116.5 0.2 cd 116.4 116.5 116.7 O1 30.6 5.8 a 23.3 30.3 38.7 O1 183.4 31.9 a 144.0 182.6 224.3 O2 28.6 5.3 a 21.5 27.5 35.6 O2 180.8 22.9 a 146.1 179.1 207.7 US1 26.7 2.1 ab 24.3 26.5 30.0 US1 167.9 10.1 ab 150.3 171.5 174.7
US2 26.3 3.2 ab 21.3 27.4 29.4 US2 163.9 23.3 abc 134.9 177.4 184.1
dif: Mean column values for each variable with a different letter are significantly different (P ≤ 0.05).
Fig. 1. Inactivation of TAMB, TMY, TC, E. coli O57:H7 and S. Enteritidis for
carrot samples by different treatments (n = 3).
Table 6
Multiple comparisons of five microbial inactivation variables (log cfu mL−1) of
carrot samples in response to control and non-thermal treatment groups (n = 3).
Variable Treatment Mean SD dif Min Median Max
TAMB Control 5.77 1.24 a 4.12 5.97 7.29 AIW1 3.02 0.38 b 2.60 3.30 3.30 AIW2 2.97 0.72 b 2.20 3.26 3.60 HPP1 0.00 0.00 c 0.00 0.00 0.00 HPP2 0.67 0.04 c 0.60 0.69 0.69 HPP3 0.00 0.00 c 0.00 0.00 0.00 O1 2.65 0.05 b 2.61 2.61 2.70 O2 2.38 0.22 b 2.00 2.40 2.54 US1 3.29 0.85 b 2.36 3.91 3.91 US2 2.72 0.35 b 2.34 2.97 2.97 TMY Control 5.71 0.50 a 4.90 6.01 6.10 AIW1 4.51 0.20 bc 4.30 4.54 4.70 AIW2 4.07 1.14 bc 3.00 3.83 5.42 HPP1 0.00 0.00 d 0.00 0.00 0.00 HPP2 0.00 0.00 d 0.00 0.00 0.00 HPP3 0.00 0.00 d 0.00 0.00 0.00 O1 3.72 0.34 c 3.20 3.80 4.00 O2 0.00 0.00 d 0.00 0.00 0.00 US1 4.84 0.05 ab 4.81 4.81 4.89 US2 4.28 0.44 bc 3.95 3.97 4.76 TC Control 6.33 1.58 a 4.78 5.57 8.33 AIW1 3.82 0.56 bc 3.23 4.00 4.32 AIW2 4.75 0.47 b 4.00 4.72 5.15 HPP1 0.00 0.00 d 0.00 0.00 0.00 HPP2 0.00 0.00 d 0.00 0.00 0.00 HPP3 0.00 0.00 d 0.00 0.00 0.00 O1 3.30 0.16 c 3.18 3.18 3.48 O2 2.96 0.65 c 2.30 3.00 3.60 US1 4.90 0.14 b 4.73 4.85 5.04 US2 4.60 0.24 b 4.38 4.45 4.86
E. coli O157:H7 Control 4.74 0.49 a 4.22 4.90 5.18
AIW1 4.43 0.32 a 4.08 4.40 4.95 AIW2 4.15 0.54 a 3.38 4.08 4.85 HPP1 0.12 0.27 b 0.00 0.00 0.60 HPP2 0.00 0.00 b 0.00 0.00 0.00 HPP3 0.00 0.00 b 0.00 0.00 0.00 O1 0.00 0.00 b 0.00 0.00 0.00 O2 0.00 0.00 b 0.00 0.00 0.00 US1 4.24 0.59 a 3.60 4.60 4.71 US2 4.02 0.84 a 3.00 4.42 4.78 S. Enteritidis Control 5.66 0.45 a 5.08 5.60 6.30 AIW1 3.33 0.31 b 3.00 3.45 3.61 AIW2 3.53 0.26 b 3.20 3.60 3.87 HPP1 1.00 0.00 d 1.00 1.00 1.00 HPP2 0.39 0.25 d 0.00 0.42 0.70 HPP3 0.00 0.00 e 0.00 0.00 0.00 O1 2.47 0.28 c 2.00 2.60 2.70 O2 2.00 0.00 c 2.00 2.00 2.00 US1 3.83 0.49 b 3.30 4.00 4.32 US2 3.24 0.53 b 2.71 3.23 4.00
dif: Mean column values for each variable with a different letter are sig-nificantly different (P ≤ 0.05). TAMB: total aerobic mesophilic bacteria, TMY: total mold and yeast, TC: total coliform.
effective in the inactivation of E. coli with the higher fluence, being more effective on the smooth surface of tomato (by 2.7 log). Ozone was reported to provide the inactivation of bacteria in tomatoes by 2.2 log after only 3 min, while carrots and lettuces underwent a lower in-activation by all the treatments due to their porous and rough surfaces. The UV-C treatment was pointed to as the one that most affected the color, leading to the browning of lettuce, and an increase in color index (TCI) of tomatoes and whiteness index (WI) of carrots, while the O3
treatment also affected the greenness of lettuce (Bermúdez-Aguirre & Barbosa-Cánovas, 2013).
The gaseous O3application of 5.2 mg L−1for 15 min to the shredded
lettuces and baby carrots provided 1.6 and 2.5 log reductions on the initial number of E. coli O157:H7, respectively (Kim et al., 2003). This suggests that the disinfection of fresh produces may require a combined application of several treatments to achieve a higher inactivation level (Kim et al., 2003). The O3 application of 80 mg min−1 for 20 min
caused a 1-to-4 log reduction in the mesophilic bacteria and total co-liforms in wash water of carrots (Selma, Allende, López-Gálvez, Conesa, & Gil, 2008). Ozone was stated to be responsible for the oxidation of lipids on the cells by acting on the unsaturated lipids of the cell membrane as well as in the lipopolysaccharides coat of gram-negative bacteria, enzymes, and genetic materials, thus promoting the microbial death (Kim et al., 2003).
Washing the carrot samples with MH-SAEW at 45 °C (23 mg L−1
available chlorine at pH 5.5), and rinsing with tap water (TW) for 2 min at 4 °C reduced the total aerobic bacteria by 2.2 log cfu g−1and
molds and yeasts by > 1.9 log cfu g−1compared to the TW treatment
(Koide et al., 2011).Zhang, Cao, Hung, and Li (2016)soaked radish seeds using electrolyzed oxidizing (EO) water with five concentrations (15, 20, 28, 33 and 40 mg L−1) of available chlorine (ACC) at five pH
values (2.5, 3.5, 4.5, 5.5 and 6.5) for 12 h alone or in combination with 30 and 50 mg L−1ACC. The natural microbiota was found to decrease
with the increased ACC level of the EO treatment. No significant dif-ference was detected among the EO treatments with the five pH levels. Their results showed a slightly reduced germination percentage of radish seeds during seed-soaking as a function of EO with the higher ACC and the lower pH. The EO treatments with the ACC of 30 and 50 mg L−1sprayed during seed sprouting were shown to result in 1.39
and 1.58 log reductions of total aerobic bacteria, and total yeast and mold, respectively (Zhang et al., 2016).
3.3. Linear associations among food quality and safety variables
The strongest positive and negative correlations were found be-tween α and β carotenes (r = 0.97), and chroma and hue (r = −0.72) (P ≤ 0.001), respectively (Table 7). In terms of the physical properties, pH was positively correlated with total coliform (r = 0.97). As for the organic acids, ascorbic acid exhibited the strongest negative and posi-tive correlations with S. Enteritidis (r = −0.85) and citric acid (r = 0.74), respectively. As far as the microbial inactivation is con-cerned, S. Enteritidis was positively correlated with total coliform (r = 0.95) and total mold and yeast (r = 0.88), while total coliform had a highly positive correlation with total aerobic mesophilic bacteria (r = 0.92).
Table 7
Pearson's correlation matrix among food quality and safety properties measured as a function nine treatment levels (n = 45; ** ≤ 0.01;∗p ≤ 0.001).
pH C h TAC TPC TA MA CA SA FA AA GA (+) CAA CLA PCA α TAMB TMY TC Ec
h −0.72 * TAC −0.45 * TPC 0.52 −0.36 * ** TA −0.67 * CA −0.48 0.49 −0.41 0.48 * * ** * FA 0.69 * AA −0.74 0.55 −0.43 0.55 0.74 * * * * * GA 0.44 −0.38 −0.37 −0.60 * ** ** * (+) 0.37 −0.38 ** ** CAA −0.41 ** CLA −0.46 * PCA 0.40 0.63 −0.50 ** * * α −0.43 * β −0.40 0.97 ** * TAMB 0.83 −0.39 0.40 −0.51 0.49 −0.74 −0.59 −0.79 0.39 * ** ** * * * * * ** TMY 0.68 −0.47 0.37 −0.58 −0.51 −0.71 −0.41 0.82 * * ** * * * ** * TC 0.85 −0.51 0.43 −0.75 −0.63 −0.83 0.39 0.92 0.86 * * * * * * ** * * Ec 0.53 −0.71 −0.54 −0.57 −0.56 0.38 −0.37 0.38 0.67 0.82 0.77 * * * * * ** ** ** * * * SE 0.81 0.38 −0.56 0.43 −0.72 −0.66 −0.85 0.38 0.89 0.88 0.95 0.82 * ** * * * * * ** * * * *
Table 8 Joint optimization of best-fit simple linear regression models of 25 responses to nine treatment types (D = 0.43). Response Goal Model r 2(%) r 2 pred (%) SE p DW d Fit pH 6.3 6.3780 + 0.022 O2 -0.05 AIW1 + 0.036 AIW2 + 0.048 US1 + 0.084 US2 -0.42 HPP1 -0.38 HPP2 -0.424 HPP3 78.2 66.0 0.1 0.001 2.0 0.81 6.3 Chroma 23.4 31.52–2.6 O2 -2.4 AIW1 -4.56 AIW2 -0.09 US1 + 17.1 US2+ 9.25 HPP1 + 9.57 HPP2 + 11.47 HPP3 43.6 11.9 9.2 0.004 1.4 0.73 31.5 Hue 0.5 0.3188 + 0.0956 O2 + 0.109 AIW1 + 0.0474 AIW2 + 0.2138 US1 -0.1104 US2 -0.062 HPP1 -0.0529 HPP2 -0.0414 HPP3 41.6 8.8 0.1 0.007 1.6 0.51 0.3 Firmness 27.2 30.57–1.96 O2 -4.13 AIW1 -3.28 AIW2 -3.83 US1 -4.27 US2 -10.66 HPP1 + 0.57 HPP2 -5.47 HPP3 44.6 13.5 3.8 0.003 1.8 0.70 30.5 TAC (%) Max 51.96 + 1.4 O2 + 12.4 AIW1 + 10.7 AIW2 -12.5 US1 + 0.6 US2 + 16.8 HPP1 + 29.7 HPP2 + 31.3 HPP3 41.6 8.8 17.9 0.007 1.2 0.37 51.9 TPC (mg/100 mL) Max 1.199–0.084 O2 -0.109 AIW1 -0.050 AIW2 -0.157 US1 -0.573 US2 -0.612 HPP1 -0.616 HPP2 -0.571 HPP3 39.1 4.8 0.3 0.014 1.6 0.42 1.1 Tartaric acid Max 297.3–220.3 O2 -297.2 AIW1 -171.5 AIW2 -173.5 US1 -297.2 US2 + 99.6 HPP1 -5.1 HPP2 + 59.4 HPP3 88.4 81.9 57.9 0.001 2.6 0.63 297.3 Malic acid Max 983.2–18 O2 + 254 AIW1 -428 AIW2 + 237 US1 + 321 US2 + 185 HPP1 + 133 HPP2 + 126 HPP3 64.7 44.8 174.4 0.001 3.0 0.68 983.2 Citric acid Max 515.3–110.5 O2 -185.1 AIW1 -405.8 AIW2 -188.7 US1 + 68.9 US2 -62.8 HPP1 + 190.6 HPP2 + 189.5 HPP3 86.0 78.2 82.1 0.001 2.9 0.68 515.3 Succinic acid Max 61.67–60.12 O2 -37.93 AIW1 -60.12 AIW2 -60.12 US1 -60.12 US2 -60.12 HPP1 -60.12 HPP2 -60.12 HPP3 96.5 94.6 4.0 0.001 2.7 0.84 61.6 Fumaric acid Max 401.2–150.8 O2 -306.1 AIW1 -390.8 AIW2 -278.4 US1 -396.8 US2 -238.1 HPP1 -297.5 HPP2 -306.2 HPP3 92.3 88.0 37.3 0.001 2.9 0.98 401.2 Ascorbic acid Max 0.864 + 0.341 O2 + 0.266 AIW1 -0.221 AIW2 -0.079 US1 + 0.304 US2 + 1.072 HPP1 + 1.910 HPP2 + 2.182 HPP3 85.7 77.8 0.3 0.001 3.0 0.13 0.8 Gallic acid Max 0.2992 + 0.0343 O2 + 0.1015 AIW1 + 0.1001 AIW2 + 0.0761 US1 + 0.3001 US2 + 0.0284 HPP1 + 0.1051 HPP2 + 0.1738 HPP3 75.7 62.0 0.05 0.001 2.7 0.11 0.2 (+)-catechin Max 0.4689 + 0.2734 O2 -0.0832 AIW1 -0.0452 AIW2 + 0.0076 US1 -0.1188 US2 + 0.0198 HPP1 + 0.0719 HPP2 -0.0474 HPP3 47.0 17.3 0.1 0.002 3.1 0.43 0.4 (−)-epicatechin Max 0.5426–0.2091 O2 -0.1257 AIW1 -0.3152 AIW2 -0.0872 US1 -0.1574 US2 -0.2379 HPP1 -0.0728 HPP2 -0.0457 HPP3 36.5 0.8 0.1 0.024 2.8 0.50 0.5 Caffeic acid Max 0.46822 + 0.0167 O2 + 0.0719 AIW1 + 0.0449 AIW2 + 0.03 US1 -0.0132 US2 + 0.0376 HPP1 + 0.0165 HPP2 + 0.0166 HPP3 68.2 50.4 0.01 0.001 2.8 0.25 0.4 Chlorogenic acid Max 0.186 + 0.0673 O2 + 0.0888 AIW1 + 0.0033 AIW2 + 0.0569 US1 + 0.0297 US2 + 0.0043 HPP1 + 0.0169 HPP2 -0.0231 HPP3 41.4 8.4 0.04 0.008 3.0 0.16 0.1 Para-cumaric acid Max 0.1433–0.0267 O2 -0.0306 AIW1 -0.0236 AIW2 + 0.0178 US1 + 0.0766 US2 -0.0272 HPP1 -0.0252 HPP2 -0.0163 HPP3 59.8 37.1 0.03 0.001 2.6 0.19 0.1 α carotene Max 0.5046–0.159 O2 -0.044 AIW1 -0.026 AIW2 + 0.133 US1 -0.148 US2 -0.434 HPP1 -0.125 HPP2 + 0.267 HPP3 57.7 34.0 0.1 0.001 2.7 0.48 0.5 β carotene Max 3.529–0.796 O2 -0.53 AIW1 + 0.496 AIW2 + 1.08 US1 -0.448 US2 -2.695 HPP1 -0.577 HPP2 + 1.181 HPP3 60.2 37.8 1.0 0.001 2.7 0.61 3.5 TAMB Min 2.647–0.27 O2 + 0.374 AIW1 + 0.326 AIW2 + 0.646 US1 + 0.074 US2 -2.647 HPP1 -1.977 HPP2 -2.647 HPP3 92.1 87.6 0.4 0.001 3.2 0.32 2.6 TMY Min 3.72–3.72 O2 + 0.787 AIW1 + 0.345 AIW2 + 1.12 US1 + 0.56 US2 -3.72 HPP1 -3.72 HPP2 -3.72 HPP3 96.9 95.2 0.4 0.001 1.8 0.31 3.7 TC Min 3.297–0.335 O2 + 0.525 AIW1 + 1.448 AIW2 + 1.605 US1 + 1.301 US2 -3.297 HPP1 -3.297 HPP2 -3.297 HPP3 97.7 96.4 0.3 0.001 2.7 0.35 3.2 E. coli Min −0.0001 + 0.0001 O2 + 4.426 AIW1 + 4.145 AIW2 + 4.244 US1 + 4.016 US2 + 0.12 HPP1 + 0.0001 HPP2 + 0.0001 HPP3 97.0 95.3 0.4 0.001 2.2 1.0 −0.001 S. Enteritidis Min 2.466–0.466 O2 + 0.865 AIW1 + 1.065 AIW2 + 1.359 US1 + 0.771 US2 -1.466 HPP1 -2.073 HPP2 -2.466 HPP3 96.1 93.9 0.3 0.001 1.5 0.42 2.4