In vivo and in vitro assessment of ovarian echotexture through
computer assisted real time ultrasonography in bitches
Güneş ERDOĞAN
1, Niyazi KÜÇÜK
2, Halit KANCA
3, Melih AKSOY
21Adnan Menderes University, Faculty of Veterinary Medicine, 1Department of Obstetrics and Gynecology; 2Department of
Reproduction and Artificial Insemination, Aydın; 3Ankara University, Faculty of Veterinary Medicine, Department of Obstetrics and
Gynecology, Ankara, Turkey.
Summary: In vivo and in vitro assessment of canine ovaries (n=72) were studied by computer assisted real time ultrasonography to analyse the correlation between the ovarian echotexture and serum progesterone (P4) concentration. Pre- and postoperative ovarian images were taken via B-mode ultrasonography, and analysed by an image analysis software package for total area of ovary (A), mean greyness value (MGV), heterogeneity (H), and minimum-maximum pixel value (PR). The ovaries were classified into follicular or luteal stage based upon the serum P4 concentration, vaginal cytology findings, and macroscopic inspection of ovaries postoperatively. The P4 was negatively (P<0.05) correlated with A, H and PR, whereas, it’s correlation with MGV was positive (P<0.05) in follicular stage. Also, parameters A, H and PR were higher (P<0.05) in follicular stage. In vitro parameters of MGV, H and PR were higher (P<0.05) than in vivo parameters in follicular stage. Meanwhile, in luteal stage ovaries, only in vitro MGV was higher than in vivo MGV. In this study, it was observed that the relationship between ovarian echotexture and oestrous stages could be presented numerically. Moreover, the differences between the in vivo and in vitro ovarian images were more prominent in bitches in the follicular stage.
Keywords: Bitch, image analysis, ovarian echotexture, ultrasonography.
Köpeklerde ovaryum ekotekstürünün bilgisayar destekli B-mod ultrasonografi ile in vivo ve in vitro
incelenmesi
Özet: Köpeklerde ovaryum ekotekstürü ile serum progesteron (P4) değerleri arasındaki ilişkinin belirlenmesi için köpek ovaryumları (n=72) in vivo ve in vitro olarak bilgisayar destekli real time ultrasonografi ile incelendi. Total ovaryum alanı (A), ortalama grilik değeri (MGV), heterojenite (H) ve minimum-maksimum piksel değerinin (PR) görüntü analiz yazılım sistemi ile analiz edilmesi için preoperatif ve postoperatif ovaryum B-mod ultrasonografi görüntüleri alındı. Ovaryumlar, serum P4 değerleri, vajinal sitoloji bulguları ve postoperatif makroskobik görünümlerine göre folliküler ve luteal evre olarak sınıflandırıldı. Folliküler evre grubunda P4 değeri A, H ve PR ile negatif korelasyon gösterirken (P<0.05), MGV ile pozitif korelasyon gösterdi (P<0.05). Yine folliküler evrede A, H ve PR değerleri önemli ölçüde yüksekti (P<0.05). Folliküler evrede in vitro görüntülerindeki MGV, H ve PR değerleri in vivo görüntülerdekinden daha yüksek bulundu (P<0.05). Ancak, luteal evredeki ovaryumlarda, sadece MGV in vitro görüntülerde daha yüksekti. Bu çalışmada, ovaryum ekotekstürü ile östrus dönemleri arasında sayısal olarak sunulabilen bir ilişki olduğu ve folliküler evredeki köpeklerde in vivo ve in vitro görüntüler arasında daha belirgin bir fark bulunduğu görüldü.
Anahtar sözcükler: Görüntü analizi, köpek, ovaryum ekotekstürü, ultrasonografi.
Introduction
Computerized analysis of ultrasonographic images provides precise information of the structure and function of several tissues. This technique allows quantitative and objective assessments of brightness intensity and uniformity of each pixel composing an image by overcoming the subjectivity of visual analyses (8,14). Ultrasonographic images are composed of thousands of picture elements called pixels, and each pixel is represented numerically in a scale of 256 shades of grey (0=black; 255=white) according to their intensity (10, 19). Each pixel represents the ability or a discrete unit of a
tissue to transmit or refract high-frequency ultrasound beams, which in turn depends upon the physical properties of the acoustic tissue interfaces (i.e. cellular composition, water and macromolecular content) (10). Images are displayed as two-dimensional maps of grey scale based upon location and strength of the echoes returning from the tissue interfaces. In assessment of tissue echotexture, a mathematical matrix is generated using these numerical values, and two main variables are analysed: mean pixel value and pixel heterogeneity (14).
Singh et al. (12) developed a computer assisted method for quantitative analysis of echo-texture and
demonstrated that ultrasound images reflect functional and histomorphological characteristics of corpus luteum. This analysis showed that there were characteristic cyclic changes in echogenity which were negatively related to luteal and plasma progesterone (P4) concentrations, and relationships were found between that parameter and histomorphometric characteristic. Brightness of the pixels of the sonographic corpus luteum images were found to be negatively related to the volume density of luteal cells and positively related to that of stromal tissue within the corpus luteum. Several studies carried out in bovine (6, 12, 13, 15, 16), equine (4, 5), and ovine species (3, 18) have shown that the quantitative echotextural variables are good indicators of follicular and/or luteal histomorphological changes and endocrine status. Recently, B-mode and colour Doppler ultrasonography were performed to relate ultrasonographic changes in ovarian blood flow, follicle/corpora lutea count and echotexture to periovulatory events (2). However, a computer assisted ultrasonographic image analysis approach to monitor ovarian tissue in correlation with oestrus stage and serum P4 level has not been reported yet in canine. By using this alternative ultrasonographic examination in cases without records and some reproductive disorders, the estimating of sexual phases can be more practical and noninvasively.
In the present study, it was aimed to examine changes in the ovarian echotexture by in vivo and in vitro computer assisted real time ultrasonography and its correlation with serum P4 levels in female dogs. Also, it
was examined to the effectiveness and applicability of this diagnostic method and compatibility of in vivo and in vitro images.
Materials and Methods
Thirty six mongrel bitches (1-3 years of age and 18-27 kg of body weight) were selected among ninety eight bitches those brought for elective ovariectomy at the Obstetrics and Gynaecology Clinic, Faculty of Veterinary Medicine, Adnan Menderes University. Animal handling and all procedures were performed in accordance with applicable regulations and guidelines and with the approval of the Animal Experimental Ethics Committee of Adnan Menderes University (64583101/2016/55). The animals were evaluated physically and by ultrasonographic examination. The dogs without any reproductive disorders were included in the study. After analysis of serum P4 levels (9), macroscopic inspection and ultrasonographic (in vivo/in vitro) evaluation of ovaries and also vaginal cytological examinations in uncertain cases, sixty-two dogs (with low P4 levels and also no follicular and or luteal tissue) were recorded as they were in anoestrous stage and excluded from the study.
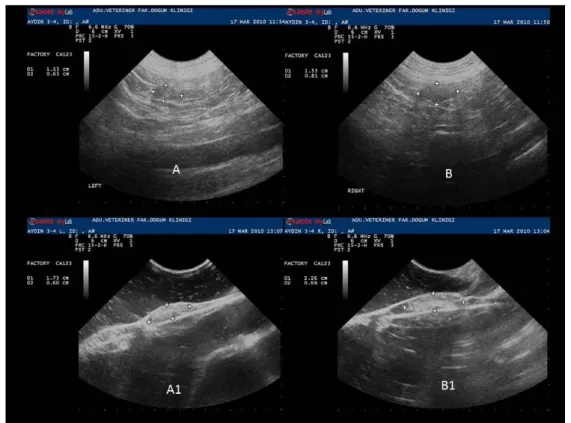
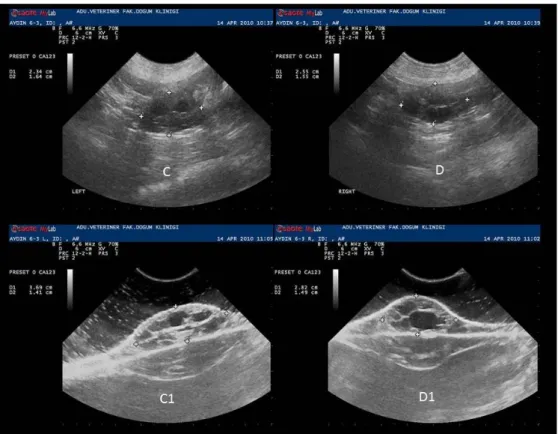
The bitches were placed in either left or right lateral recumbency and paralumbar regions were shaved. Ovaries were scanned by ultrasound equipped with 6.6 MHz microconvex transducer (MyLab Vet30- ESAOTE®, Genova, Italy). Images of each whole ovaries were taken and then transferred to computer for image analysis (Figures 1 and 2).
Figure 1. In vivo (A- B) and in vitro (A1- B1) ultrasonographic images of right and left ovaries in luteal phase. Şekil 1. Luteal dönemdeki sağ ve sol ovaryumlara ait in vivo (A - B) ve in vitro (A1- B1) ultrasonografik görüntüler.
Figure 2. In vivo (C- D) and in vitro (C1- D1) ultrasonographic images of right and left ovaries in follicular phase. Şekil 2. Folliküler dönemdeki sağ ve sol ovaryumlara ait in vivo (C - D) ve in vitro (C1- D1) ultrasonografik görüntüler.
After in vivo examinations, the bitches were anaesthetized by an injection of xylazine (2 mg/kg) and ketamine HCl (15 mg/kg). Ovariectomy was performed by medial laparotomy. Following ovariectomy, surrounding structures of each ovary were removed and visible follicular and luteal areas on the ovarian surface were recorded. Regarding to loss of image quality due to abdominal contents and lipoid tissue of bursa ovarica, it was purposed that comparing the echotexture parameters of in vivo and in vitro captured images. For in vitro scanning of sagittal plane, each ovary was fixed on plastic pad material and covered by a water sack according to normal anatomic position. The probe was covered with a copious amount of gel to eliminate the air spaces. The ultrasound settings (frequency=6.6 MHz, one focus point at the upper one third, gain=70 %, sharpness=2 through the study) were standardized, and the same were used for all the examinations as described previously (15). Images of whole ovaries were taken as described above in in vivo ovarian ultrasonography (Figures 1 and 2) due to the challenge of distinguishing between the functional (follicles and corpora lutea) and stromal areas in some cases. All ultrasonographic examinations were performed by single and trained operator. Blood samples were taken prior to in vivo ovarian ultrasonography. Serum P4 concentrations were determined by radioimmunoassay (RIA) using a gamma counter (Mini-Assay type 6-20;
Mini Instruments Ltd., London, England). A commercial P4 RIA kit (Immunotech®) was used as described by the manufacturer. Maximum intra-assay, inter-assay coefficients of variation, and minimum detectable dose were 6.5 %, 7.2 %, and 0.12 nmol/L, respectively. It is documented that the test shows a high linear correlation to the established RIA (1). Based upon the serum P4 level and vaginal cytology findings, ovaries were categorised into follicular stage (5-30.0 ng/ml) or luteal stage (> 30.0 ng/ml) as reported earlier (9).
In order to monitor variations in the echotexture of the ovarian parenchyma in response to the cyclic stage, each in vivo and in vitro ultrasonographic image was analysed for A, MGV, H and PR by using a computer assisted image analyses software package (Image J 1.42q; NIH, USA) (11). The software has been designed to quantify the grey tone within the user-defined region of the image. Echotexture was measured in terms of mean pixel value and pixel heterogeneity. Mean pixel value was quantified using values ranging from 0 (black) to 255 (white). Heterogeneity of the mean within the user-defined region was used as an indicator of the heterogeneity and a large standard deviation was taken as an indication of greater heterogeneity among pixel values. Sample regions were taken at the sagittal section and encompassed only ovarian tissue avoiding surrounding tissues. All images were analysed three times for each
parameter and mean measurements were used in statistical analyses. Each image could be analysed approximately in ten minutes using “Image J” software.
Statistical analyses were carried out using a statistical package (SPSS version 17; SPSS Inc., Chicago, IL). First the data of in vivo and in vitro images of right and left ovary were averaged and then Independent Samples-t test was applied to compare area (A), mean grey volume (MGV), heterogeneity (H) and pixel range (PR) between follicular and luteal stages. Similarly, the A, MGV, H and PR were compared between in vivo and in vitro ultrasonographic images within follicular or luteal stage by using Independent Samples- t test. The in vivo and in vitro ultrasonographic image data of right and left ovaries were pooled and Pearson correlation was applied to find the association between ultrasonogram parameters and P4 level in follicular stage or luteal stage. The means and ± standard error of means (SEM) of each parameter were calculated.
Results
Following serum P4 determination, all bitches were divided into follicular (n=17) and luteal (n=19) stage groups. Mean P4 levels of groups follicular and luteal groups were 20.05 ± 1.19 vs. 39.04 ± 0.68, respectively (P<0.01). Accurate classification rates of bitches into two stages (follicular or luteal) based on images obtained from ovaries were 41.4 % (7 / 17) and 42.1 % (8 / 19), respectively.
Correlations between P4 level and ultrasonographic images’ parameters in follicular and luteal stages were analysed. Table 1 presents the A, MGV, SD and PR in four images (preoperative right, preoperative left, postoperative right, postoperative left) were compared with serum P4 levels for each dog in follicular and luteal stage, respectively.
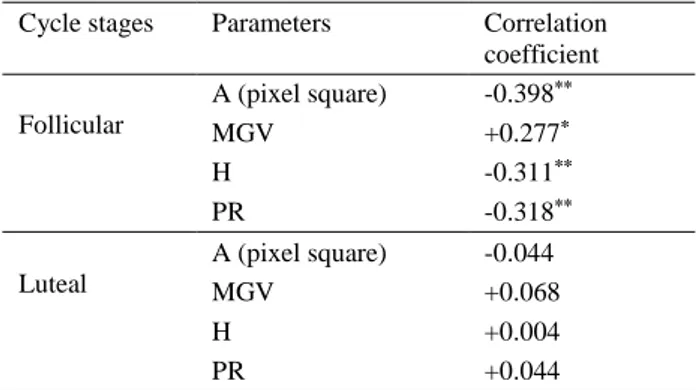
Table 1. Coefficients of correlations between serum P4 concentration and parameters of ovarian images in bitches in follicular and luteal stages of the sexual cycle.
Tablo 1. Seksüel siklusun folliküler ve luteal evresindeki köpeklerde serum P4 düzeyi ve ovaryum görüntüleri arasındaki korelasyon katsayıları.
Cycle stages Parameters Correlation coefficient Follicular A (pixel square) -0.398** MGV +0.277* H -0.311** PR -0.318** Luteal A (pixel square) -0.044 MGV +0.068 H +0.004 PR +0.044 ** (P<0.01) * (P<0.05)
Total area of ovary, MGV, H and PR were compared with serum P4 levels for each dog in follicular stage. After comparing with P4 levels, it was found that negative correlations (-0.398; P<0.01); (-0.311; P<0.01); (-0.318; P<0.01) for A, H and PR, also positive correlations (0.277; P<0.05) with MGV for in vivo and in vitro images of ovaries in follicular stage. However, no significant correlations were found between serum P4 level and A, MGV, H and PR (-0.044; +0.068; +0.004 +0.044; P>0.05) for A, H and PR for in vivo and in vitro images of ovaries in luteal stage, respectively.
Table 2 presents the A (6396.07 ± 377.54 vs. 4427.41 ± 400.68), H (21.23 ± 0.74 vs. 17.59 ± 0.68) and PR (105.41 ± 3.18 vs. 90.20 ± 2.81) were significantly (P<0.01) greater in follicular stage than luteal stage, respectively. There were no significant differences for MGV between groups (P<0.05).
Table 2. Features (Mean ± SEM) of ovarian ultrasonographic images in bitches either in follicular or luteal stages of the sexual cycle.
Tablo 2. Seksüel siklusun folliküler ve luteal evresindeki köpeklerde ovaryumların ultrasonografik görüntülerinin özellikleri (Mean ± SEM).
Cycle Stages
Parameters Follicular Luteal
A (pixel square) 6396.07 ± 377.54a 4427.41 ± 400.68b MGV 105.45 ± 4.16 112.58 ± 4.26 H 21.23 ± 0.74a 17.59 ± 0.68b PR 105.41 ± 3.18a 90.20 ± 2.81b Different superscripts within the same line differ significantly (P < 0.01).
Aynı sıradaki önemli farklılıklar farklı üst simgelerdedir (P < 0.01).
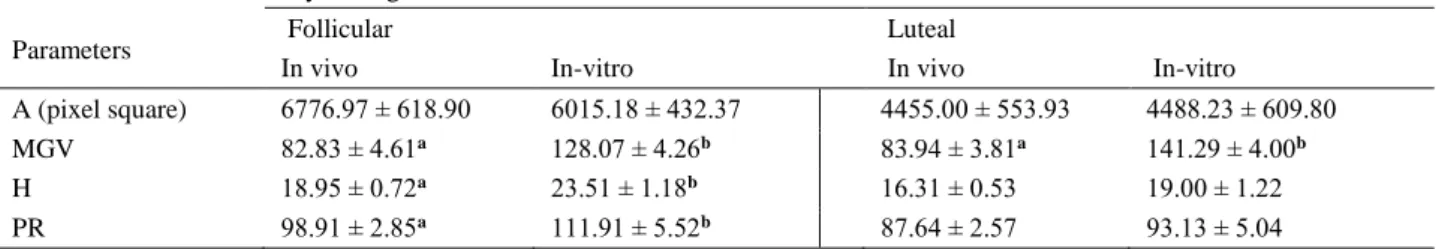
Table 3 presents the A, MGV, H and PR (mean±SEM) for in vivo and in vitro captured images. Total area of ovary (6776.9 ± 618.9 vs. 6015.1 ± 432.3), MGV (82.8 ± 4.6 vs. 128.1 ± 4.2) (P<0.05), H (18.9 ± 0.72 vs. 23.5 ± 1.2) (P<0.05), and PR (98.9 ± 2.8 vs. 111.9 ± 5.5) (P<0.05) were recorded in follicular stage, respectively. In luteal stage, A (4455.0 ± 553.9 vs. 4488.2 ± 609.8), MGV (84.9 ± 3.8 vs. 141.3 ± 4.0) (P<0.05), H (16.3±0.5 vs. 19.0±1.2) and PR (87.6±2.5 vs. 93.1±5.0) were recorded, respectively.
Discussion and Conclusion
It has been suggested that the quantitative ultrasonogram attributes are good indicators of physiological and functional status of the follicle and corpus luteum in different species (2, 3, 6, 8, 15). Unlike those studies, computer assisted real time ultrasonography was performed on images belong to all ovarian tissues with all structures (functional and connective) in this study. In this study, the accurate classification rates of
dogs according to the images obtained from ovaries were above 40 % for both stages. Regarding to other clinical approaches (vaginal cytology findings, serum P4 levels and macroscopic evaluation) this method’s diagnostic value is seen lower in this study's result. In our opinion, the technological improvements within the equipment of ultrasonography machines would make it more effective in further studies.
The significant positive correlations between luteal area and P4 levels have been documented in cattle (7, 15) and sheep (3). The negative correlation between total ovarian area and serum P4 concentration has been found in follicular stage group (r= -0.39) in the present study. This negative correlation might be owing to large ovarian size during follicular stage because of follicles filled with liquor folliculi and dilated arterioles and capillaries under the influence of high oestrogen but low P4 levels. Thus it might increase the volume of connective tissue of ovaries in follicular stage. Although, the correlation is weak negative, it is a remarkable value as all ovarian tissue was used for ultrasonography.
The promising and somewhat contradictory information regarding the relationship between MGV and P4 is available. Davies et al. (3) found positive correlation between MGV and P4 (r = 0.52 - 0.69) in sheep. In spite of this evidence in favour of positive correlation, Siqueira et al. (15) found a negative correlation (r = -0.63) between MGV and P4 level in cattle. In our study positive correlation (r = 0.27) between the MGV and P4 levels in follicular stage might be due to follicular luteinisation, which resulted in decreased contrast between follicles and ovarian connective tissue. With increasing luteinisation, homogeneity of images was increased and shade of grey was switched to hyperechogenic grey tones.
Tom et al. (17) showed no cyclic fluctuations after evaluating the heterogeneity of the grey levels of a B-mode ultrasonographic image by measuring the H from MGV. Siqueira et al. (15) observed negative correlation
between H of CL and P4 level (r = -0.71). Likewise, the negative correlations of H and PR with P4 level (both are r = -0.31) were found in follicular stage in the present study. This may be explained by the presence of anechoic follicular areas resulted in heterogenic ultrasonograms in early follicular stage. This increase in anechoic areas during follicular development made higher number of black pixels and hence resulting in higher H and PR values.
In contrast to the results of follicular stage, no significant correlations were found between ovarian echotexture parameters and P4 levels in luteal stage. It can be explained that ultrasonographic echotexture of corpora lutea is similar to the ovarian connective tissue. Therefore, any physiologic changes make no difference of computer assisted analysing parameters in the luteal stage.
In the present study, ultrasonographic features (A, H and PR) of follicular stage ovaries were higher (P<0.01) than luteal stage ovaries. However, MGV was similar among follicular and luteal stages. In follicular stage, ovaries were bigger because of follicles and dilated vessels. Hence, no difference of MGV between follicular and luteal stages could be related to inhomogeneity of the data of follicular stage groups. Whereas Herzog et al. (6) reported that the assessment of CL area facilitates the differentiation between static stage and the growing and regression stages. The higher H and PR values in follicular stage compared to luteal stage (P<0.01) may resulted from heterogenic sonograms due to follicular areas and higher number of black pixels.
In this study, in vitro parameters (MGV, H and PR) were higher (P<0.05) than in vivo parameters in ovaries at follicular stage (Table 3). In contrast, only in vitro MGV was higher than in vivo MGV in ovaries at luteal stage. These data show that application of in vivo ultrasonography during luteal stage could be more reliable than the follicular stage. In our opinion, although there were more echotexture differences between the follicles
Table 3. Comparative features (Mean ± SEM) of ovarian images obtained in vivo or in vitro in dogs in the follicular or luteal stages of sexual cycle.
Tablo 3. Seksüel siklusun folliküler ve luteal evresindeki köpeklerin in vivo ve in vitro ovaryum görüntülerinin karşılaştırmalı özellikleri (Mean ± SEM).
Parameters
Cycle stage
Follicular Luteal
In vivo In-vitro In vivo In-vitro
A (pixel square) 6776.97 ± 618.90 6015.18 ± 432.37 4455.00 ± 553.93 4488.23 ± 609.80
MGV 82.83 ± 4.61a 128.07 ± 4.26b 83.94 ± 3.81a 141.29 ± 4.00b
H 18.95 ± 0.72a 23.51 ± 1.18b 16.31 ± 0.53 19.00 ± 1.22
PR 98.91 ± 2.85a 111.91 ± 5.52b 87.64 ± 2.57 93.13 ± 5.04
Different superscripts in the same line in follicular or luteal stage columns differ significantly (P < 0.05). Folliküler ve luteal evre sütunlarında aynı sıradaki önemli farklılıklar farklı üst simgelerdedir (P < 0.05).
and ovarian stromal tissue in in vivo images of follicular stage, the loss of image quality could be originated from periovarian lipoid tissues in in vivo images.
In conclusion, the relationship between echotexture and oestrous stages could be presented numerically by using computer assisted B-mode ultrasonography both in vivo and in vitro conditions and by using serum P4 concentrations. The identification of ovarian structures and stage of the oestrous cycle may be elusive in most of the clinical cases by means of ultrasonography. When evaluating current results, estimation of the sexual cycle stage, monitoring of follicular development or intrafollicular luteinization could be done with the help of this method alternatively. In addition, loss of image quality should be considered during the follicular stage compared to those in the luteal stage for computer assisted B-mode ultrasonographic image analyses.
References
1. Alacam E, Ay SS, Saban E (2009): The evaluation of various radioimmunoassay progesterone kits for different stage of reproductive period in the cow, sheep and bitch. Vet J Ankara Univ, 56, 37-41.
2. Bergeron LH, Nykamph SG, Brisson BA, et al. (2013): An evaluation of B-mode and color Doppler ultrasonography for detecting periovulatory events in the bitch. Theriogenology, 79, 274-283.
3. Davies KL, Bartlewski PM, Pierson RA, et al. (2006): Computer assisted image analyses of corpora lutea in relation to peripheral concentrations of progesterone: A comparison between breeds of sheep with different ovulation rates. Anim Reprod Sci, 96, 165-175.
4. Gastal EL, Gastal MO, Ginther OJ (1998): The suitability of echotexture characteristics of the follicular wall for identifying the optimal breeding day in mare. Theriogenology, 50, 1025-1038.
5. Gastal EL, Gastal MO, Ginther OJ (2006): Relationships of changes in B-mode echotexture and colour-Doppler signals in the wall of the preovulatory follicle to changes in systemic oestradiol concentrations and the effect of human chorionic gonadotropin in mares. Reproduction, 131, 699-709.
6. Herzog K, Kiossis E, Bollwein H (2008): Examination of cyclic changes in bovine luteal echotexture using computer– assisted statistical pattern recognition techniques. Anim Reprod Sci, 106, 289-297.
7. Kayacık V, Salmanoğlu MR, Polat B, et al. (2005): Evaluation of the corpus luteum size throughout the cycle by ultrasonography and progesterone assay in cows. Turk J Vet Anim Sci, 29, 1311-1316.
8. Liu X, Hart EJ, Petrik JJ, et al. (2008): Relationships between ultrasonographic image attributes, histomorphology and proliferating cell nuclear antigen expression of bovine antral follicles and corpora lutea ex situ. Reprod Dom Anim, 43, 27-34.
9. Olson PN, Bowen RA, Behrendt MD, et al. (1982): Concentration of reproductive hormones in canine serum throughout late anestrus, proestrus and estrus. Biol Reprod, 27, 1196-1206.
10. Pierson RA, Adams GP (1995): Computer-assisted image analysis, diagnostic ultrasonography and ovulation induction: Strange bedfellows. Theriogenology, 43, 105-112.
11. Rasband WS (1997): Image J. U.S. National Institutes of Health. Bethesda, Maryland, USA. http:rsb.info.nih.gov/ij., 1997.
12. Singh J, Pierson RA, Adams GP (1997): Ultrasound image attributes of the bovine corpus luteum: Structural and functional correlates. J Reprod Fertil, 109, 35-44.
13. Singh J, Pierson RA, Adams GP (1998): Ultrasound image attributes of bovine ovarian follicles and endocrine and functional correlates. J Reprod Fertil, 112, 19-29. 14. Singh J, Pierson RA, Adams GP (2003): Promise of new
imaging technologies for assessing ovarian function. Anim Reprod Sci, 78, 371-399.
15. Siqueira LGB, Torres CAA, Amorim LS, et al. (2009): Interrelationships among morphology, echotexture, and function of the bovine corpus luteum during the estrous cycle. Anim Reprod Sci, 115, 18-28.
16. Thijssen JM, Herzog K, Weijers G, et al. (2011): Ultrasound image analysis offers the opportunity to predict plasma progesterone concentrations in the estrous cycle in cows: A feasibility study. Anim Reprod Sci, 127, 7-15. 17. Tom JW, Pierson RA, Adams GP (1998): Quantitative
echotexture analysis of bovine corpora lutea. Theriogenology, 49, 1345-1352.
18. Wu D, Barret DMW, Rawlings NC, et al. (2009): Relationship of changes in ultrasonographic image attributes to ovulatory and steroidogenic capacity of large antral follicles in sheep. Anim Reprod Sci, 116, 73-84. 19. Zagzebski JA (1996): Essential of Ultrasound Physics.
Mosby-Year Book Inc, St. Louis, USA.
Geliş tarihi: 02.02.2016 / Kabul tarihi: 20.09.2016 Address for correspondence:
Assoc.Prof.Dr. Güneş Erdoğan Adnan Menderes University Faculty of Veterinary Medicine
Department of Obstetrics and Gynecology, Aydın, Turkey. e-mail: gunesemsahoo.com