Effects of Setup Errors on Dose Distribution for
Tangential Wedge Field and Field-in-Field
Techniques During Breast Irradiation
Aydan SONMEZ1, Cem ONAL1, Serhat SONMEZ1, Gungor ARSLAN1, Cem PARLAK1,
Erkan TOPKAN1, Melek YAVUZ2
1 Baskent University Faculty of Medicine, Department of Radiation Oncology, Adana 2 Akdeniz University Faculty of Medicine, Department of Radiation Oncology, Antalya, TURKEY
ABSTRACT
This study is aimed to evaluate the effects of setup errors on dose distribution for target volume and healthy tissue within the irradiated volume and also critical surrounding organs for breast radiotherapy (RT) using both the tangential field and the field-in-field (FIF) technique. Ten patients with breast cancer were enrolled. For each patients two plans were generated; tangential field plan and FIF-plan. The setup errors were simulated for a series of displacements of ±5 mm and ±10 mm in superior-inferior (x-axis), medial-lateral (y-axis), and anterior-posterior (z-axis) directions and dose volume comparisons were made both between and within groups. The most prominent changes were observed in setup errors at z-axis. In wedge plan, 10-mm setup error at the +z axis caused a significant decrease in tumor coverage compared with the plan with no setup error (96.5% vs. 99.2%; p= 0.01). The 5 and 10 mm setup errors at the +z-axis resulted in signifi-cantly higher healthy tissue doses in wedge plans compared with FIF plans. The setup errors along z-axis had a significant effect on the dose distribution for target volume and also to the lungs. The setup error in the isocenter should be kept strictly below 5 mm.
Keywords: Breast cancer, Radiotherapy, Field-in-field technique, Setup errors
ÖZET
Meme Radyoterapisi Sırasında Set-up Hatalarının Tanjansiyel Wedge ve Field-in-field Tekniklerindeki Doz Dağılımına Etkileri Bu çalışmanın amacı, meme radyoterapisi (RT) sırasında kullanılan tanjansiyel alan ve ‘field-in-field’ (FIF) tekniklerindeki set-up hatalarının hedef hacim, ışınlanan hacimdeki sağlıklı doku ve çevre organ dozları üzrindeki etkilerini değerlendirmektir. Meme kanseri tanılı 10 hasta çalışmaya dahil edilmiştir. Her hasta için ikişer plan oluşturulmuştur: tanjansiyel alan ve FIF tekniği. Set-up hataları superior-inferior (x-axis), medial-lateral (y-axis), and anterior-posterior (z-axis) istikamatte ±5 mm ve ±10 mm olarak oluşturulmuş olup, doz volüm karşılaştırmaları hem grup içinde hem de gruplar arasında yapılmıştır. En belirgin değişiklik z-axis de gözlenmiştir. Tanjansiyel planda +z-axis de oluşan 10 mm lik setup hatasındaki hedef hacimi kapsama, set up hatası olmayan plana gore anlamlı düşük bulunmuştur (%96.5 vs. %99.2; p= 0.01). +z-axisteki 5 ve 10 mm’lik setup hataları sonucunda oluşan sağlıklı doku dozları tanjansiyel planda FIF planına gore anlamlı olarak yüksek bulunmuştur. z-axisteki hatalar hem hedef volüm hem de akciğer dozlarında belirgin bir etki yaratmaktadır. İzosentrdaki hataların 5 mm nin altında olması güvenlidir.
UHOD
INRODUCTION
Postoperative breast irradiation after conservative surgery is accepted as the gold standard for early-stage breast cancer.1,2 However, it is difficult to
ob-tain homogenous dose distribution properly with non-computer based treatment planning systems, especially for larger breasts. Factors contributing to dose inhomogeneity include variations in the distance between beam entry and beam exit points and tissue inhomogeneities within the irradiated fields, such as in lung and heart tissue. With the help of computer-ized tomography-based techniques, such as three-di-mensional conformal RT (3DCRT) or intensity-mod-ulated RT (IMRT), it is possible to regulate the dose distribution within the target and also organs at risk.3,4
Thus, for whole-breast irradiation, standard tangen-tial RT is gradually being replaced by IMRT forward or inverse planning techniques.5
The field-in-field (FIF) technique, also named as for-ward IMRT planning, is a simple preferred method that can be performed at any center that has a multi-leaf collimator (MLC).6,7 Although the FIF technique
achieves a more homogenous dose distribution com-pared with standard tangential field RT, IMRT plans can be more susceptible to set-up errors and breast shape changes because IMRT plans contain non-glancing segments.8
Both organ motion and patient positioning inaccura-cies have been well documented for various breast RT techniques9-11; however, the impact of motion on
dosimetry for the FIF technique has not yet been well studied. The present study was designed to evaluate the effects of setup errors on dose distribution for both the target volume and healthy tissue within the irra-diated volume and also critical surrounding organs for breast RT using the FIF technique. Additionally, the FIF technique was compared with the standard wedged tangential field plan.
METHODS AND MATERIALS Patients
A total of 10 patients (five patients with right and five with left breast cancer) with early-stage breast cancer treated with breast-conserving surgery and postopera-tive whole breast only RT were enrolled.
Treatment planning: Patients were scanned at a
2.5-mm slice thickness with normal free breathing in the supine position using a Civco C-Qual breast inclined
plane on a table-top compatible with the treatment ta-ble (Civco indexed carbon fiber MTIL4101; Civco, Kalona, IA, USA). CT data were then transferred to the treatment planning system (TPS; Eclipse, version 8.1; Varian Medical Systems, Palo Alto, CA, USA) using a DICOM network connection.
Two different treatment plans were generated from the TPS and results were compared in the present study. For each patient, a conformal tangential RT plan with wedges was created and, afterwards, the FIF-RT plan was designed on TPS. For the tangential field technique, wedges were placed on the 3D-CT dataset using the isocentric technique to obtain dose homogeneity inside the breast. For the FIF technique, hot spot volumes established from open tangential fields were created as structures by the TPS and hot spot volume blocking subfields were then determined to improve dose homogeneity for the PTV, which was previously described.12
Setup errors: The isocenter shifts were simulated
for a series of displacements of ±5 mm and ±10 mm in superior-inferior (x-axis), medial-lateral (y-axis), and anterior-posterior (z-axis) directions. After creat-ing these setup errors, the dose volume analysis was generated and a comparison was made both between groups and within groups. During generation of the dose distribution after setup errors, the monitor units (MUs) were fixed to the initial reference MUs, for overcoming planning errors.
Geometric conformality index: We used the
geo-metric index (g), which was previously defined for stereotactic RT, by the Saint-Anne, Lariboisière, Tenon (SALT) group.13,14 This index evaluates both
the low doses within the target and higher doses in healthy tissue, notably addressing the homogeneity of target volume doses with sparing of normal tissues. According to the SALT criteria:
LVRI TVRI Lesion coverage factor = ––––––– = ––––––, LV TV LV<RI Lesion underdosage factor (LUF) = ––––––, LV
HTVRI Healthy tissue overdosage factor (HTOF) = –––––––, LV Geometric conformity index: g= LUF + HTOF ,
UHOD
where LV is the lesion volume, LVRI is the lesion volume covered by the reference isodose, TV is the target volume, and TVRI is the target volume covered by the reference isodose. HTVRI is the healthy tissue volume covered by the reference isodose.
Statistical analysis
The plans were compared for dose distribution within the target and organs at risk generated from the TPS. Irradiated soft tissue volumes, ipsilateral lung doses, and heart doses for the left-sided breast were com-pared for the FIF technique and conformal wedged technique after setup errors both between groups and within groups. For target coverage and assess-ing both the low doses within the target and higher doses in healthy tissue, g was used and a comparison was performed after setup errors. Student’s t-test was used for comparisons. Values of p less than 0.05 were deemed to be statistically significant.
RESULTS
The median age of patients was 54 years old (range, 30-70 years). The mean tumor diameter was 3.2 ± 1.7 cm. Patient distribution according to T stage was as follows: four patients had T1 tumors and six had T2 tumors.
Target coverage
The mean clinical target volume (CTV) was 965.4 cm3 (range, 440.3–2053.8 cm3). The mean V95%
was 1557.9 ± 669.5 cm3 for the entire cohort. For the
wedge plan, the mean V95% was 1602.4 ± 678.6 cm3
and 1512.8 ± 659.8 cm3 for the FIF plan. The irradi-ated healthy tissue volume was significantly higher in the wedge plan than in the FIF plan (626.5 ± 263.2 cm3 vs. 530.1 ± 241.0 cm3, respectively; p = 0.002).
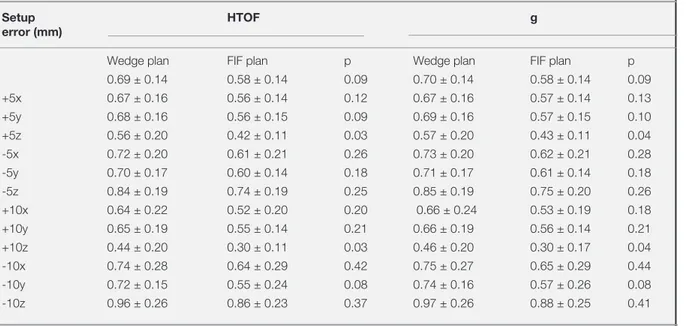
Table 1. Mean values of healthy tissue overdosage factors and geometric conformality indices for both wedge and FIF plans.
Setup HTOF g
error (mm)
Wedge plan FIF plan p Wedge plan FIF plan p
0.69 ± 0.14 0.58 ± 0.14 0.09 0.70 ± 0.14 0.58 ± 0.14 0.09 +5x 0.67 ± 0.16 0.56 ± 0.14 0.12 0.67 ± 0.16 0.57 ± 0.14 0.13 +5y 0.68 ± 0.16 0.56 ± 0.15 0.09 0.69 ± 0.16 0.57 ± 0.15 0.10 +5z 0.56 ± 0.20 0.42 ± 0.11 0.03 0.57 ± 0.20 0.43 ± 0.11 0.04 -5x 0.72 ± 0.20 0.61 ± 0.21 0.26 0.73 ± 0.20 0.62 ± 0.21 0.28 -5y 0.70 ± 0.17 0.60 ± 0.14 0.18 0.71 ± 0.17 0.61 ± 0.14 0.18 -5z 0.84 ± 0.19 0.74 ± 0.19 0.25 0.85 ± 0.19 0.75 ± 0.20 0.26 +10x 0.64 ± 0.22 0.52 ± 0.20 0.20 0.66 ± 0.24 0.53 ± 0.19 0.18 +10y 0.65 ± 0.19 0.55 ± 0.14 0.21 0.66 ± 0.19 0.56 ± 0.14 0.21 +10z 0.44 ± 0.20 0.30 ± 0.11 0.03 0.46 ± 0.20 0.30 ± 0.17 0.04 -10x 0.74 ± 0.28 0.64 ± 0.29 0.42 0.75 ± 0.27 0.65 ± 0.29 0.44 -10y 0.72 ± 0.15 0.55 ± 0.24 0.08 0.74 ± 0.16 0.57 ± 0.26 0.08 -10z 0.96 ± 0.26 0.86 ± 0.23 0.37 0.97 ± 0.26 0.88 ± 0.25 0.41
* Abbreviations: HTOF = healthy tissue overdosage factor, g = geometric conformity index
Figure 1. Mean tumor coverage factors according to setup errors for both tangential wedge and FIF plans.
UHOD
The mean tumor coverage for the wedge plan and FIF plan was 99.21 and 99.40%, respectively. In the wedge plan, a 10-mm setup error at the +z axis caused a significant decrease in tumor coverage compared with the plan with no setup error (99.21 vs. 96.5%; p= 0.01), and other setup errors resulted in no sig-nificant change in tumor coverage (Table 1). Tumor coverage was similar at each setup error and no sig-nificant difference was observed between the wedge and FIF plans, except for the10-mm setup error at the +z-axis, where the tumor coverage was mostly affect-ed and was less with the waffect-edge plan comparaffect-ed with the FIF plan with almost statistical significance (96.5 vs. 98.6%; p= 0.08; Figure 1).
The mean HTOFs for the wedge and FIF plans were 0.69 ± 0.14 and 0.57 ± 0.14, respectively, which was close to the level of statistical significance (p= 0.09). The 5- and 10-mm setup errors in the z-axis at both directions caused significant changes in healthy tissue doses in the wedge plans compared with no setup er-ror (Figure 2). Additionally, significant changes were observed with similar setup errors in the FIF plan ex-cept for the 5-mm error at the +z-axis (Table 2 and Figure 3). Furthermore, 5- and 10-mm setup errors at the +z-axis resulted in significantly higher healthy tissue doses in wedge plans compared with FIF plans (Table 1).
The mean g index for the wedge and FIF plans were 0.70 ± 0.14 and 0.58 ± 0.14, respectively. The 10-Table 2. Comparison of lesion coverage factor, lesion underdosage factor, healthy tissue overdosage factor, and geometric confor-mality index between with setup errors and normal setup in FIF and tangential wedge plans.
Set-up errors TCF LUF
Wedge plan (p) FIF plan (p) Wedge plan (p) FIF plan (p)
+5x 0.63 0.96 0.81 0.79 +5y 0.79 0.63 0.79 0.82 +5z 0.53 0.30 0.51 0.57 -5x 0.67 0.56 0.82 0.68 -5y 0.33 0.44 0.40 0.68 -5z 0.63 0.69 0.67 0.84 +10x 0.22 0.31 0.21 0.79 +10y 0.60 0.40 0.92 0.49 +10z 0.01 0.17 0.005 0.12 -10x 0.53 0.24 0.70 0.30 -10y 0.15 0.14 0.16 0.16 -10z 0.50 0.23 0.51 0.23 HTOF g
Wedge plan (p) FIF plan (p) Wedge plan (p) FIF plan (p)
+5x 0.76 0.76 0.73 0.77 +5y 0.94 0.84 0.93 0.87 +5z 0.01 0.13 0.01 0.12 -5x 0.69 0.65 0.70 0.63 -5y 0.85 0.66 0.83 0.63 -5z 0.03 0.04 0.05 0.04 +10x 0.59 0.43 0.70 0.45 +10y 0.63 0.68 0.62 0.69 +10z 0.006 0.01 0.006 0.01 -10x 0.58 0.54 0.57 0.50 -10y 0.62 0.78 0.45 0.88 -10z 0.001 0.004 0.008 0.004
* Abbreviations: TCF = tumor coverage factor, LUF = lesion underdosage factor, HTOF = healthy tissue overdosage factor, g = geometric conformity index
UHOD
mm setup error at the z-axis resulted in significant changes in the g index for both wedge and FIF plans. Additionally a 5-mm setup error caused a significant change in the g index at the +z-axis for the wedge plan and the –z-axis for the FIF plan (Table 2). Fur-thermore, a significant increment in g was observed in the wedge plan compared with the FIF plan with 5- and 10-mm shifts at the +z-axis (Table 1).
Organs at risk doses
The mean lung V20Gy values for tangential wedge and FIF plans were 14.88 ± 5.83% and 13.39 ± 5.63%, respectively. The setup errors did not result in significant changes in lung V20Gy values for tan-gential wedge plans, but the highest lung V20 Gy changes were observed with the 10-mm error at the z-axis in both directions; 9.55 ± 6.92% (p = 0.08) at the +z-axis and 20.70 ± 8.58% (p = 0.09) at the –z-axis, corresponding to a 39.1% increase and 35.8% decrease in lung V20Gy values. However, in the FIF plan, lung V20Gy values significantly changed with 10-mm setup errors at the z-axis in both directions. The V20Gy value was significantly higher in plans with a 10-mm +z-axis shift (20.89 ± 6.61%; p = 0.01) and significantly lower in plans with a 10-mm –z-axis shift (7.72 ± 4.70%; p = 0.03), corresponding to a 56.0% increase and 42.3% decrease in mean lung
V20Gy values. The setup errors did not result in sig-nificant changes in lung V20Gy values between tan-gential wedge and FIF plans (Figure 4A).
The mean lung doses for wedge and FIF plans were 8.21 ± 3.03 Gy and 7.89 ± 2.96 Gy, respectively; addi-tionally, no significant difference was noted between the two groups. Although the setup errors caused no significant change in MLD for wedged tangential ir-radiation, the highest changes in MLD were observed at the z-axis with the 10-mm setup error: a 29.2% (p= 0.10) decrease at the +z-axis and 31.0% (p = 0.10) increase at the –z-axis. However, in the FIF plan, a 10-mm shift at the +z direction results in a significant decrease in MLD (4.92 ± 2.18 Gy; p= 0.02) corre-sponding to 39.2% and a significant increase in MLD was observed in plans with a 10-mm shift at the –z direction (11.16 ± 3.57 Gy; p= 0.04) corresponding to 40.0% changes. Nevertheless, the MLD changes did not differ significantly between wedge and FIF plans (Figure 4B).
The mean heart V30Gy values for wedge and FIF plans were 1.90 ± 0.69% and 1.87 ± 1.20%, respec-tively. Setup errors did not result in significant chang-es in heart V30Gy valuchang-es for both tangential wedge and FIF plans. Likewise, changes in heart V30 Gy values caused by setup errors did not differ signifi-cantly between wedge and FIF plans (Figure 4C).
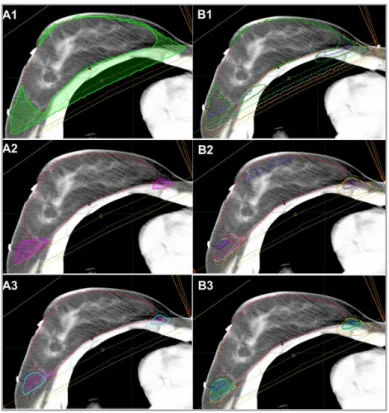
Figure 2. Dose distribution in the FIF plan. (A1) Healthy tissue receiving 95% of the prescribed dose (yellow area). (A2) 107% dose area (ma-genta). (A3) and healthy tissue receiving 107% of the prescribed dose. Dose distribution changes after setup errors at +5z ,–5z (yellow), +10z (blue), and –10z (orange) axis. (B1) Healthy tissue receiv-ing 95% of the prescribed dose. (B2) 107% dose area. (B3) Healthy tissue receiving 107% of the prescribed dose.
UHOD
DISCUSSION
The present study evaluates the possible effects of setup errors on both target volume dose distribution and doses of irradiated healthy tissue and organs at risk in the FIF plan. Additionally, a comparison was performed with the standard tangential wedge plan to assess whether setup errors in the FIF plan affect the dose distribution severely compared with the stand-ard tangential plan.
The potential gain in using this simple IMRT method may be lost with any setup error, or patient and/or organ movement. For this reason, most centers pre-fer to treat patients with standard tangential field RT using wedges because of these uncertainties of dose distribution caused by setup errors. Although this the-oretical idea has been supported by some clinicians, it has not been properly evaluated yet. Setup errors have been vigorously assessed in various studies and the most important causes of setup errors were patient positioning variability, breathing motion, and shape changes of the breast.10,15,16 Truong et al.17
demon-strated that ≤5-mm setup errors at all directions were observed in 83.5% of patients and >5- and <10-mm setup errors were observed in 15.2% of patients. Dis-placements of >10 mm were found in only 1.2% of patients. However, the use of immobilization devices and image-guided RT techniques using cone-beam
CT (CBCT) has been demonstrated to improve setup reproducibility in RT for breast cancer.6,9,10 As was
demonstrated in various studies, the setup errors were less when CBCT was used (≤5 mm) and was more (>5 mm) with portal images.9,10 For this reason, we
preferred virtual setup errors of 5 and 10 mm at all directions, for both evaluating setup errors observed with simple methods using portal images and more accurate techniques using CBCT.
The effect of setup errors on dose distribution was scarcely evaluated; some studies evaluated this effect on standard tangential plans11,16 and some studies for
partial breast irradiation.9 Furthermore, studies
evalu-ating the dose distribution changes originevalu-ating from setup errors were focused on only target volume dose changes and did not evaluate organs at risk doses and healthy tissues within the irradiated breast.10 In
a study by van Mourik et al.18, the effects of setup
errors and breast changes on dose distribution have been evaluated for wedge, simple IMRT, and full IMRT plans. The authors found that wedge and sim-ple IMRT plans were primarily affected by patient er-rors (6% loss of coverage near the dorsal field edge and 2% near the skin) and plan deterioration due to breast errors was primarily observed in full IMRT plans (2% loss of coverage near the dorsal field edge and 4% near the skin). Prabhakar et al.11 evaluated the
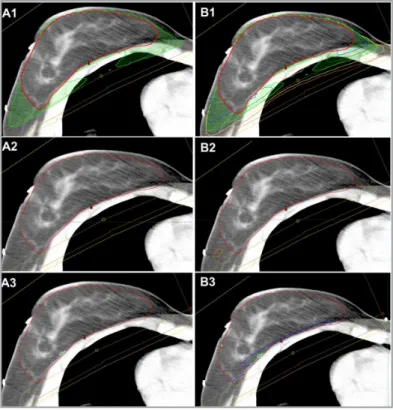
Figure 3. Dose distribution in the wedge plan. (A1) Healthy tissue receiving 95% of the prescribed dose (yellow area). (A2) 107% dose area (ma-genta). (A3) and healthy tissue receiving 107% of the prescribed dose. Dose distribution changes after setup errors at +5z , –5z (yellow), +10z (blue), and –10z (orange) axis. (B1) Healthy tissue receiv-ing 95% of the prescribed dose. (B2) 107% dose area. (B3) Healthy tissue receiving 107% of the prescribed dose.
UHOD
possible consequences of different isocenter shifts in all three directions with target dose distribution and organs at risk doses for tangential wedge plans. The authors showed that isocentric shifts along the posterior direction had a very significant effect on the dose to the heart, lung, and contralateral breast, which was followed by the lateral direction. In another
study, the dosimetric impact of respiratory breast mo-tion and daily setup error on whole breast irradiamo-tion using conventional wedge, FIF and irregular surface compensator was evaluated in 16 breast cancer pa-tients.19 The authors found that the dosimetric impact
of AP respiratory breast motion and setup error has been largest on irregular surface compensator plan, and the average variations of CTV V95 were about 6.0%. However, the deviation of target dose cover-age from the original plan for irregular surface com-pensator and FIF were relatively small, and hot spot regions represented by body V105 were significantly reduced by irregular surface compensator and FIF plans compared to the conventional technique. Our study evaluated not only the target coverage, but also critical doses. We clearly demonstrated that a setup error of 10 mm at the z-axis in both directions causes
impairment in dose distribution both for wedge and FIF plans. These results demonstrated that, although significant changes were observed at the z-axis error for both wedge and FIF plans, the dose distribution within the target—including both less target dose vol-umes and healthy tissue volvol-umes that reached treat-ment doses—was significantly less affected by setup errors in the FIF plan compared with the wedge plan, further resulting in better treatment outcome and cos-mesis.
Another concern regarding setup errors is organs at risk, including the ipsilateral lung and heart for left-sided breast cancer. In a study by Prabhakar et al.11
that evaluated setup errors for tangential field RT with virtual 3- and 10-mm shifts at three directions, the isocentric shift along the anterior-posterior direc-tion had a very significant effect on the dose to the heart and lung, which was followed by the lateral di-rection. In that study, the posterior shift contributed a high dose to the lung 1.17 and 1.59 times higher for 3- and-10-mm shifts, respectively. In the current study, we found that the greatest difference in lung V20 values was found in the posterior shift: 1.24 and 1.34 times higher for 5- and 10-mm shifts at the z-axis in the wedge plan than the plan with no shift, and was 1.25 and 1.50 times higher for the FIF plan. Although V20Gy values were similar for the 10-mm
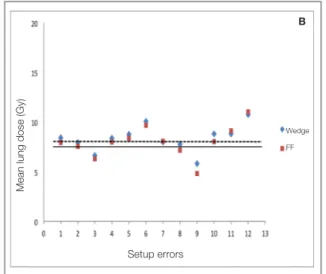
Figure 4. (A) Lung V20Gy values, (B) mean lung doses, and (C) heart V30Gy values according to setup errors for both wedge and FIF plans. The dashed line represents the mean values of corresponding measurements for the wedge plan and the solid line represents the corresponding mean values for the FIF plan.
Lung V20Gy (%)
Wedge FF
Setup errors Setup errors
Mean lung dose (Gy)
Wedge FF B A Heart V30Gy (%) Wedge FF Setup errors C
UHOD
error at the z-axis in both directions with the wedge and FIF plans, V20Gy values were significantly in-creased (56.0%; p= 0.01) at the –z-axis and dein-creased (42.3%; p= 0.03) at the +z-axis for 10-mm setup er-rors in the FIF plan. This may be due to lower V20Gy values in the FIF plan compared with the wedge plan in reference plans with no setup error (Figure 2A). For this reason, although changes in lung V20Gy val-ues were similar for both plans, the difference was more pronounced in the FIF plan compared with the wedge plan. Likewise, MLD was 1.19 and 1.28 times higher for 5- and 10-mm shifts at z-axis in the wedge plan and 1.27 and 1.45 times higher for the FIF plan than the reference plan, respectively. The cause for the FIF plan increasing the MLD is that the lower MLD was measured in the FIF plan without a setup error compared with the wedge plan. Although MLDs measured at the z-axis with 10-mm setup errors did not differ significantly for both plans, the 10 mm set-up error at the –z-axis significantly increased MLD (40.0%; p= 0.04) and significantly decreased MLD (39.2%; p= 0.02) in the FIF plan (Figure 2B). How-ever, the setup errors caused no significant change in heart doses for both plans.
CONCLUSIONS
The FIF plan is a safe method for delivering a homo-geneous dose distribution without increasing organs at risk doses, and setup changes did not impair the dose distribution in the FIF plan more than that in the wedge plan. Furthermore, setup errors did not cause an increase in organ at risk doses in the FIF plan more than those in the wedge plans. Simulation of differ-ent isocdiffer-enter shifts in all 3 directions showed that the isocentric shifts along the anterior-posterior direction (z-axis) had a very significant effect on the dose dis-tribution for target volume and also to the lungs. The setup error in the isocenter should be kept strictly be-low 5 mm. Further prospective or randomized studies are required to support these findings to make a clini-cal conclusion.
REFERENCES
1. Romestaing P, Lehingue Y, Carrie C, et al. Role of a 10-Gy boost in the conservative treatment of early breast cancer: results of a randomized clinical trial in Lyon, France. J Clin Oncol 15: 963-968, 1997.
2. Bartelink H, Horiot JC, Poortmans PM, et al. Impact of a higher radiation dose on local control and survival in breast-conserving therapy of early breast cancer: 10-year results of
the randomized boost versus no boost EORTC 22881-10882 trial. J Clin Oncol 25: 3259-3265, 2007.
3. Vicini FA, Sharpe M, Kestin L, et al. Optimizing breast cancer treatment efficacy with intensity-modulated radiotherapy. Int J Radiat Oncol Biol Phys 54: 1336-1344, 2002.
4. Donovan EM, Bleackley NJ, Evans PM, et al. Dose-position and dose-volume histogram analysis of standard wedged and intensity modulated treatments in breast radiotherapy. Br J Radiol 75: 967-973, 2002.
5. Onal C, Oymak E, Kotek A, et al. Correlation of conventional and conformal plan parameters for predicting radiation pneu-monitis in patients treated with breast cancer. J Breast Can-cer 15: 320-328, 2012.
6. Trouncer RJ, Rowbottom CG, Budgell GJ, et al. Intensity-modulated radiotherapy planning from limited anatomical information: is Sim-CT sufficient for planning women with breast cancer receiving intensity-modulated radiotherapy? Clin Oncol (R Coll Radiol) 17: 343-351, 2005.
7. Onal C, Sonmez A, Arslan G, et al. Evaluation of Field-in-Field Technique for Total Body Irradiation. Int J Radiat Oncol Biol Phys 83: 1641-1648, 2012.
8. Harsolia A, Kestin L, Grills I, et al. Intensity-modulated ra-diotherapy results in significant decrease in clinical toxicities compared with conventional wedge-based breast radiother-apy. Int J Radiat Oncol Biol Phys 68: 1375-1380, 2007. 9. Fatunase T, Wang Z, Yoo S, et al. Assessment of the residual
error in soft tissue setup in patients undergoing partial breast irradiation: results of a prospective study using cone-beam computed tomography. Int J Radiat Oncol Biol Phys 70: 1025-1034, 2008.
10. Jain P, Marchant T, Green M, et al. Inter-fraction motion and dosimetric consequences during breast intensity-modulated radiotherapy (IMRT). Radiother Oncol 90: 93-98, 2009. 11. Prabhakar R, Rath GK, Julka PK, et al. Simulation of dose
to surrounding normal structures in tangential breast radio-therapy due to setup error. Med Dosim 33: 81-85, 2008. 12. Onal C, Sonmez A, Arslan G, et al. Dosimetric comparison of
the field-in-field technique and tangential wedged beams for breast irradiation. Jpn J Radiol 30: 218-226, 2011.
13. Feuvret L, Noel G, Mazeron JJ, et al. Conformity index: a re-view. Int J Radiat Oncol Biol Phys 64: 333-342, 2006. 14. Theodorou K, Platoni K, Lefkopoulos D, et al. Dose-volume
analysis of different stereotactic radiotherapy mono-isocen-tric techniques. Acta Oncol 39: 157-163, 2000.
15. Topolnjak R, Sonke JJ, Nijkamp J, et al. Breast patient setup error assessment: comparison of electronic portal image de-vices and cone-beam computed tomography matching re-sults. Int J Radiat Oncol Biol Phys 78: 1235-1243, 2010. 16. Harron EC, McCallum HM, Lambert EL, et al. Dosimetric
ef-fects of setup uncertainties on breast treatment delivery. Med Dosim 33: 293-298, 2008.
17. Truong PT, Berthelet E, Patenaude V, et al. Short commu-nication: Setup variations in locoregional radiotherapy for breast cancer: an electronic portal imaging study. Br J Radiol 78: 742-745, 2005.
UHOD
18. van Mourik A, van Kranen S, den Hollander S, et al. Effects of setup errors and shape changes on breast radiotherapy. Int J Radiat Oncol Biol Phys 79: 1557-1564, 2011.
19. Furuya T, Sugimoto S, Kurokawa C et al. The dosimetric im-pact of respiratory breast movement and daily setup error on tangential whole breast irradiation using conventional wedge, field-in-field and irregular surface compensator techniques. J Radiat Res 54: 157-165, 2013.
Correspondence Dr. Cem ÖNAL
Başkent Üniversitesi Tıp Fakültesi Adana Uygulama ve Araştırma Merkezi Radyasyon Onkolojisi Anabilim Dalı 01120 Yüreğir
ADANA / TURKEY
Tel: (+90.322) 344 44 44 / 1304 Fax: (+90.322) 344 44 45 E-mail: [email protected]